Lean Hogs (LH) Has Rallied in 10 Straight 45-Day Spring Windows Starting Mar 18
Lean Hogs futures are heading into a 45-day spring stretch that has quietly delivered double-digit gains in every year of the past decade, just as traders weigh supply, demand and volatility into early grilling season.
Key takeaways
- A 45-day spring window for Lean Hogs begins on Mar 18 and has favored long positions over the past decade.
- Across the last 10 years, this window has produced gains in 10 of 10 years, with no losing seasons in the sample.
- Average profit in those winning years has been 11.94%, with a median gain of 13.7% and a 205% cumulative return across the decade.
- The pattern is long-biased, with a TradeWave Ratio of 3.28 and a Sharpe ratio of 2.09, pointing to strong risk-adjusted returns.
- Intraperiod swings have been meaningful, with some years showing deep drawdowns before finishing higher, so risk management still matters.
According to historical data from TradeWave.ai, this upcoming stretch has behaved very differently from an average month on the Lean Hogs calendar. The next section walks through that seasonal pattern in detail and how it frames the risk backdrop for spring trading.
Seasonal window
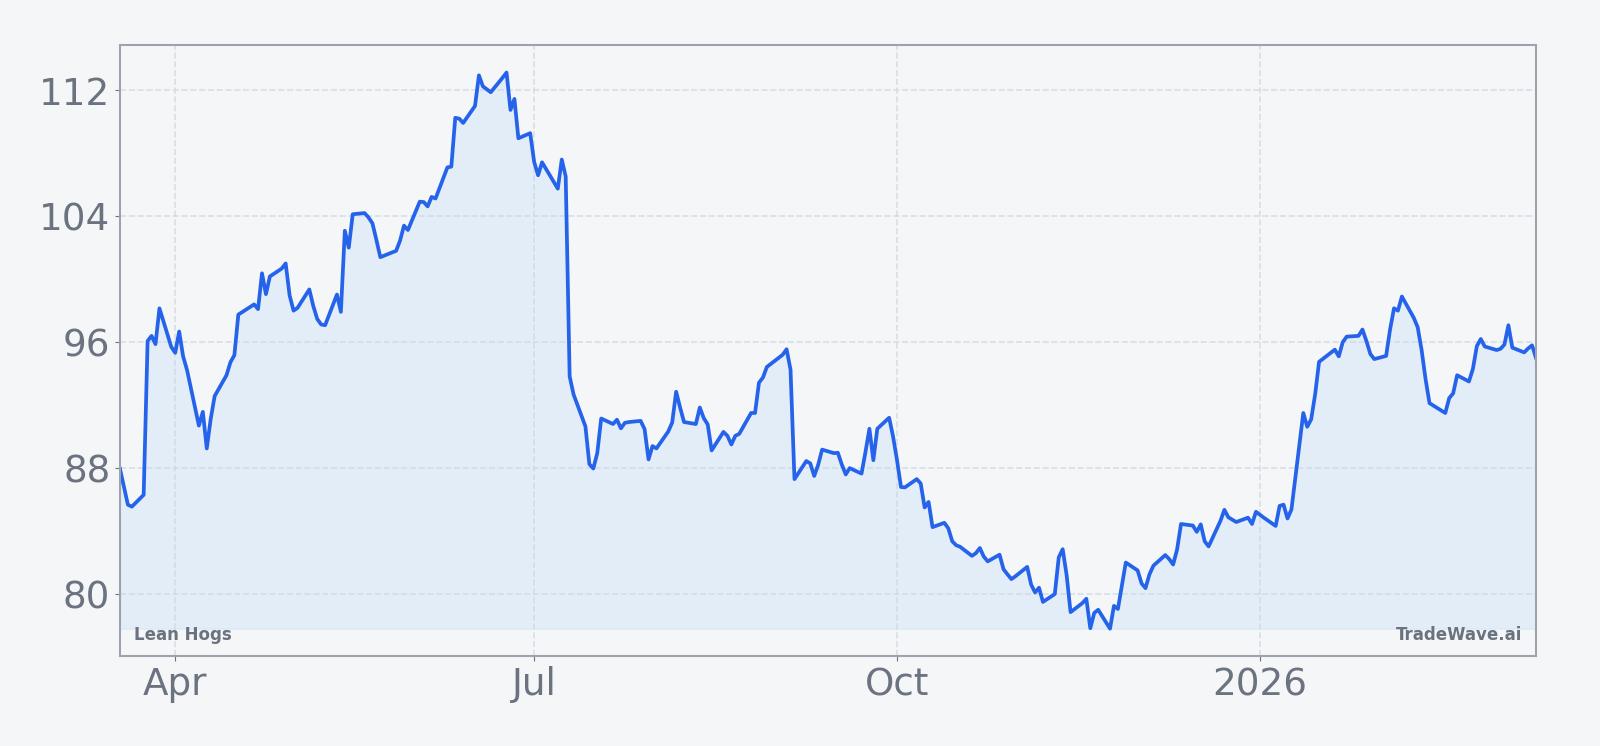
Lean Hogs has risen in 10 of 10 years during this 45-day spring window, averaging 11.94% gains, and the next iteration begins on Mar 18. Futures settled most recently at 93.45 cents per pound, leaving the contract about 17.6% below its 52-week high of 113.375 and roughly 21.2% above its 52-week low of 77.125.
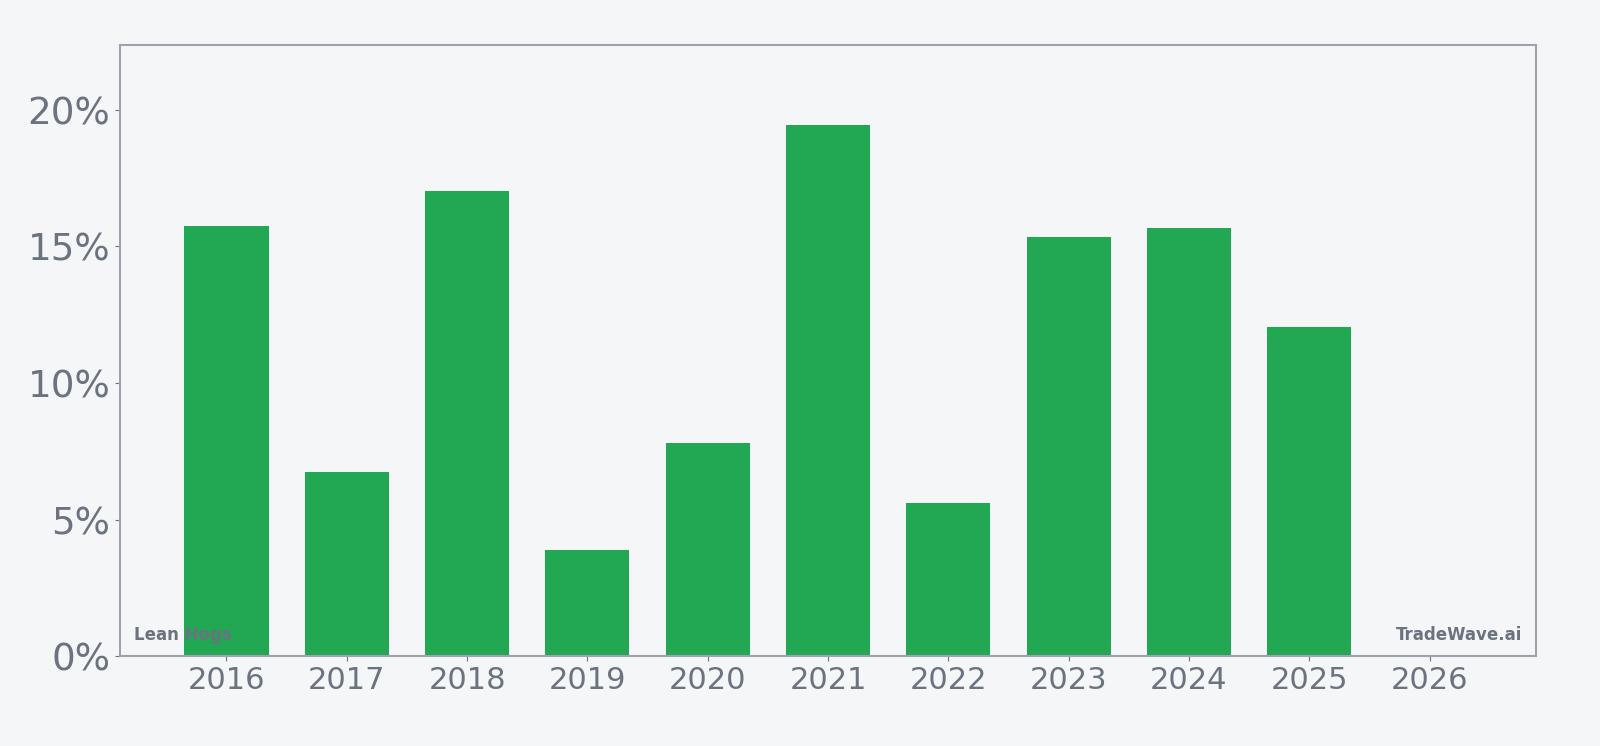
Historically this has been a long-biased window. The trade direction is explicitly long, and every one of the past 10 years finished the 45-day stretch with a positive net return. Average gains of 11.94% sit alongside a 13.7% median profit, which means the typical year has delivered a low double-digit move rather than being skewed by a single outlier.
The strongest year in the sample was 2021, when the window produced a 19.46% net gain from an entry near 94.3 cents to an exit around 112.65. The softest outcome still landed in positive territory: 2019 logged a 3.9% rise, with Lean Hogs climbing from 87.8 to 91.225 by the end of the window. Add it up and the cumulative return across the decade is 205%, a powerful run for a repeatable 45-day slice of the calendar.
Intraperiod swings have been anything but gentle. In 2020, for example, the best point-to-peak move inside the window, known as the maximum favorable excursion, reached 27.26%, while the worst drawdown from entry, or maximum adverse excursion, hit -28.63%. In 2018, the contract rallied as much as 25.26% at its best point but also suffered a -20.07% slide at its worst before finishing the window up 17.02%.
That mix of large positive and negative excursions is what the TradeWave Ratio of 3.28 is flagging. TradeWave Ratio (TWR) reflects how far price typically travels in the trade direction within the window regardless of the final close, and a value above 3 suggests that intrawindow swings have often been several times larger than the average net gain. The Sharpe ratio of 2.09, based on end-of-window outcomes, shows that despite those swings, the final results have been unusually strong relative to volatility.
The 10-year average seasonal trend chart shows gains tending to build through the middle of the window rather than spiking only at the start or end. In many years, Lean Hogs has chopped early, absorbed a drawdown, then pushed higher into the back half of the period, which fits with the idea of producers and packers adjusting positions as spring demand signals firm up.
Year-by-year bars that combine net returns with peak rallies and worst drawdowns put those swings into perspective.
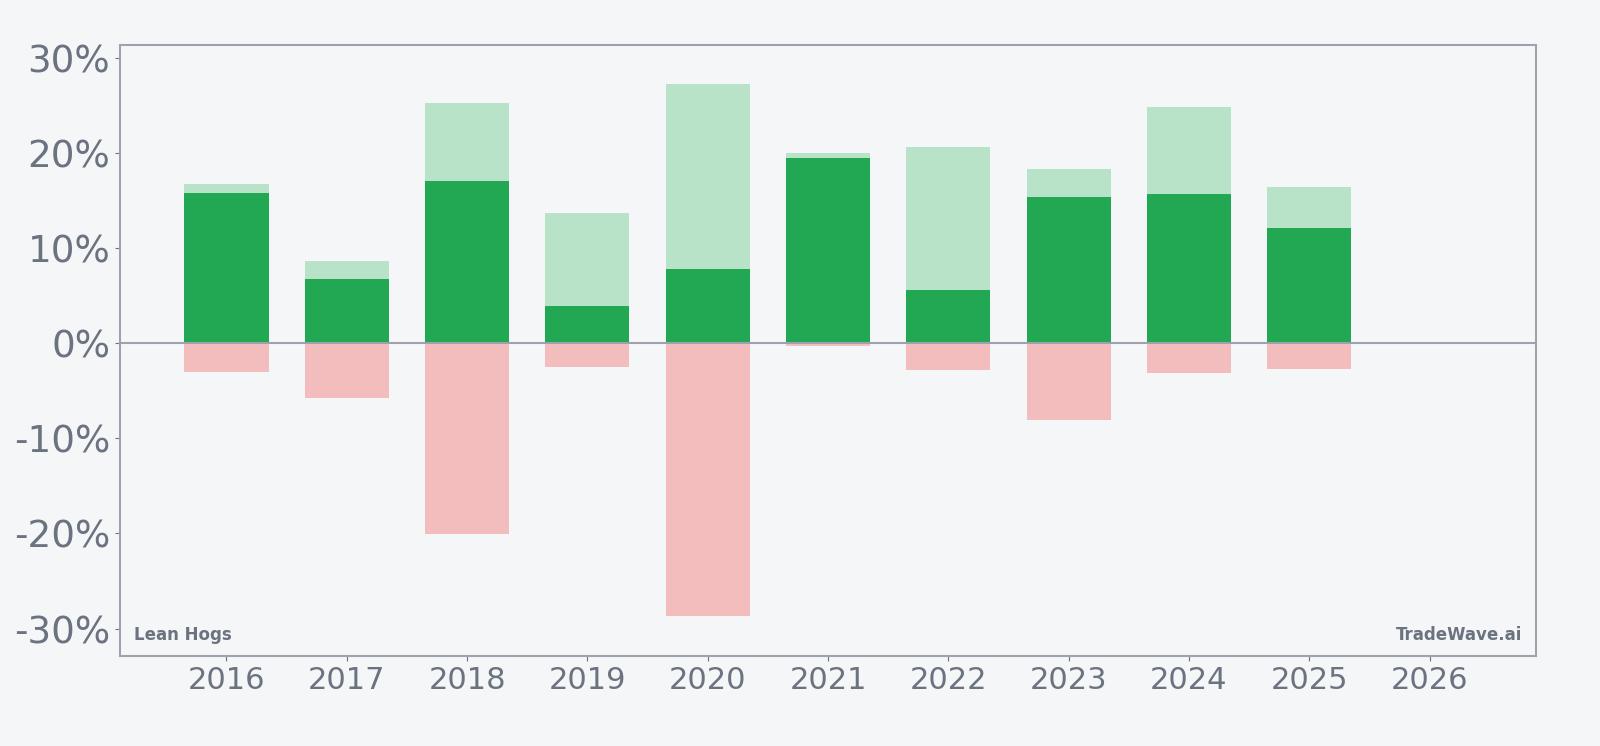
History does not guarantee future results; adverse excursions can be large even in winning windows, and traders have repeatedly faced double-digit drawdowns inside this otherwise strong seasonal stretch.
Price and near-term drivers
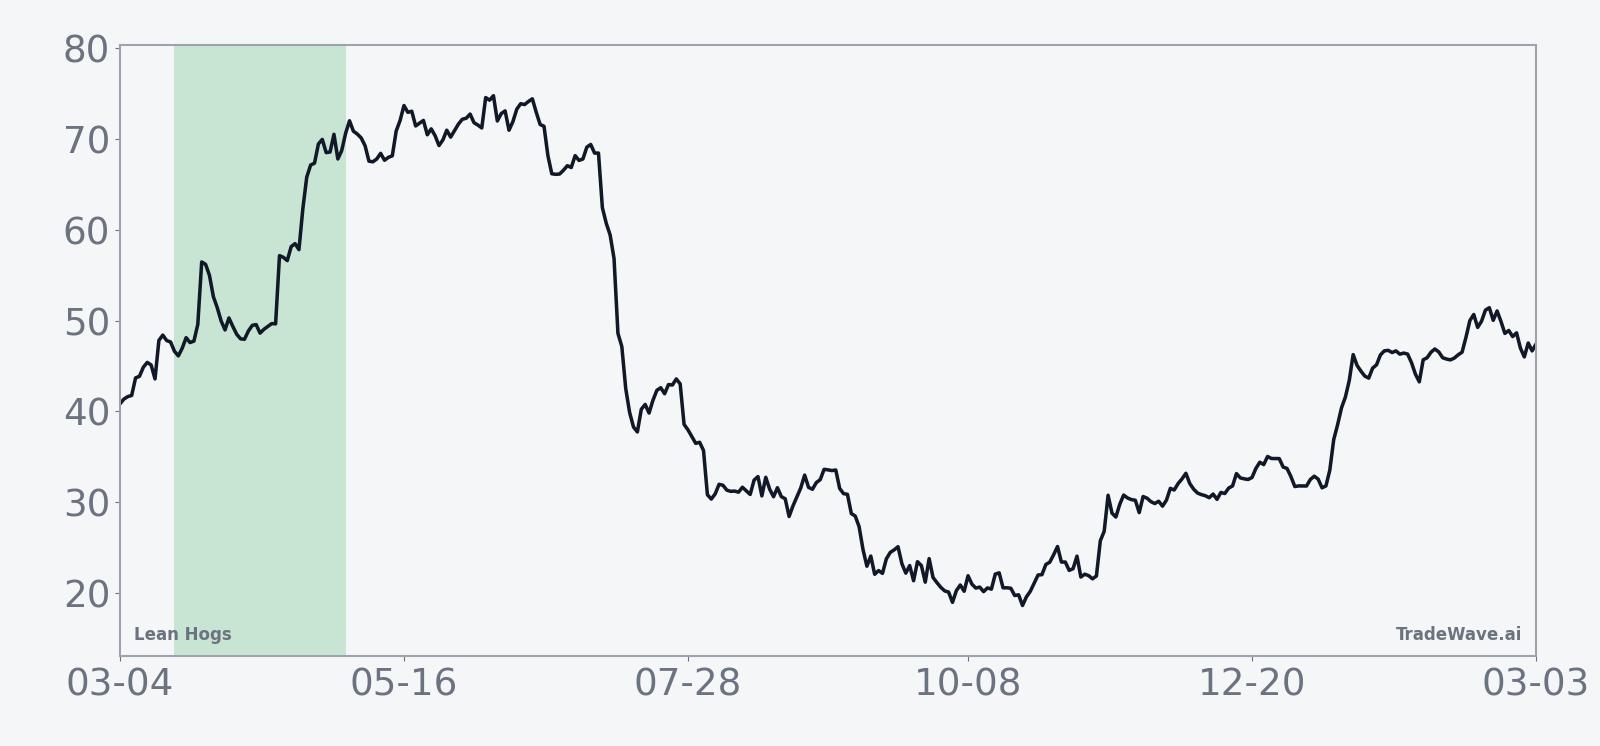
Lean Hogs futures last settled at 93.45 cents per pound, leaving the contract in the middle of its 52-week range between 77.125 and 113.375 and only a touch below its 50-day moving average of 93.559. One-month performance has been modest at 0.53%, and 20-day average volume of 25,828.55 contracts points to a market that is active but not yet in full seasonal gear.
That positioning matters because the spring window that starts on Mar 18 arrives just as U.S. consumers shift toward warmer-weather protein demand and as producers fine-tune herd management decisions. When prices sit well below the prior year’s highs, as they do today, the seasonal pattern has sometimes coincided with margin rebuilding for producers and better pricing power for packers. When prices have been closer to the top of the range, the same window has still delivered gains historically, but often with sharper intraperiod reversals before the trend reasserted itself.
Macro conditions also shape how this contract trades into spring. Lean Hogs is sensitive to feed costs, which are tied to grain markets, and to broader inflation expectations that influence consumer spending on meat. A stable or softer dollar can support export demand, while any renewed strength in the currency can pressure overseas buyers and shift more product back into the domestic channel. With the Federal Reserve still focused on inflation and growth, rate expectations and the dollar’s path will remain part of the backdrop for hog prices in the weeks ahead.
The chart below situates the latest move in its recent multi-month context.
Supply, demand and logistics
Behind the seasonal pattern sits a familiar supply and demand story. Spring is when U.S. hog supplies often tighten relative to late-winter levels, while demand begins to firm ahead of the summer grilling season. That combination has historically supported prices during the March-to-May stretch, especially when producers have already culled herds in response to earlier price weakness.
On the demand side, domestic consumption tends to improve as weather warms and outdoor cooking picks up, while export flows can add another layer of support if key buyers in Asia and Latin America are active. Any disruption to shipping lanes or port operations can quickly ripple through the market by delaying product or shifting where supplies land, which in turn can amplify price moves during a period that is already seasonally strong.
Weather is another wildcard. Adverse conditions in major hog-producing regions can affect weight gains and feed efficiency, while extreme heat or disease outbreaks can tighten supplies more abruptly. In years when such shocks have overlapped with the spring window, the historical data shows some of the largest maximum favorable excursions, as prices reacted quickly to perceived shortages before stabilizing later in the season.
Positioning and risk management
While detailed positioning data for this specific snapshot is limited, the pattern of large intraperiod swings suggests that both commercial hedgers and speculative traders have tended to adjust exposure aggressively during this window. When prices dipped early in the period in prior years, commercials likely added hedges or lifted shorts, while funds stepped in on the long side, contributing to the subsequent rallies.
For traders looking at the upcoming window, the key takeaway from the historical record is not just that the end result has been positive, but that the path has often been bumpy. Maximum adverse excursions of -20% to nearly -29% in some years show how quickly a position can move against traders before recovering. That profile argues for clear risk limits and an awareness that even a statistically strong seasonal edge has come with meaningful volatility.
What to watch as the window opens
As the Mar 18 start date approaches, the first thing to watch is how Lean Hogs trades around the 93 to 95 cent band that has defined recent action. A firm push higher into the window, especially on rising volume, would be more in line with the historical pattern of strength, while a sharp break lower with heavy selling would test how resilient this decade-long seasonal record really is.
Second, keep an eye on weekly hog slaughter and carcass weight data, which will signal whether supplies are tightening in a way that could support prices through late April and early May. If packers begin to bid more aggressively for animals or if export sales pick up, that would add fundamental fuel to a window that has already shown a strong long bias in the past.
Third, monitor macro drivers such as grain prices, the dollar and interest-rate expectations. A benign backdrop for feed costs and a stable currency would make it easier for the seasonal pattern to play out, while a spike in input costs or a dollar surge could blunt some of the upside by pressuring producer margins and export demand.
Finally, behavior inside the window will matter as much as the final outcome. A familiar script would involve early chop or a pullback followed by a sustained grind higher into the back half of the 45-day stretch. A very different pattern, such as a fast rally that quickly reverses and stays weak, would be a clear sign that this cycle is diverging from the last decade’s playbook. For now, the record is simple: 10 for 10, with double-digit average gains, and another spring window about to open.