Lean Hogs (LH) Has Rallied in 10 Straight Spring Windows as a 44-Day Run Kicks Off
Lean Hogs is entering a 44-day spring stretch that has delivered double-digit gains in every year of the past decade, putting a rare seasonal tailwind on hog prices.
Key takeaways
- Lean Hogs enters a 44-day spring seasonal window starting Mar 19 that has been bullish for 10 of 10 years.
- The pattern is long-biased, with an average profit of 12.1% across all years and a 100% win rate over the past decade.
- Individual winning years have ranged from modest 2.5% gains to rallies above 19%, with a 208% cumulative return across the sample.
- Intraperiod swings have been large in some years, with adverse moves exceeding 30% even in windows that ultimately finished higher.
- A TradeWave Ratio of 3.74 and a Sharpe ratio of 1.72 point to strong, directional behavior compared with typical commodity noise.
- History shows this window often starts choppy but tends to build upside momentum into late April and early May.
According to historical data from TradeWave.ai, this specific spring stretch in Lean Hogs has behaved very differently from an average month on the calendar, and the next iteration begins today.
Seasonal window
Lean Hogs has posted gains in all 10 of the past years during this 44-day spring window, averaging a 12.1% profit for long positions. The new window begins on Mar 19 with front-month futures recently trading in the low-to-mid 90s, between a 52-week low near 77 and a high above 113, leaving plenty of room on either side of the recent range. That combination of a clean 10-for-10 record and a wide price band gives this slice of the calendar unusual weight for hog traders watching both upside potential and downside risk.
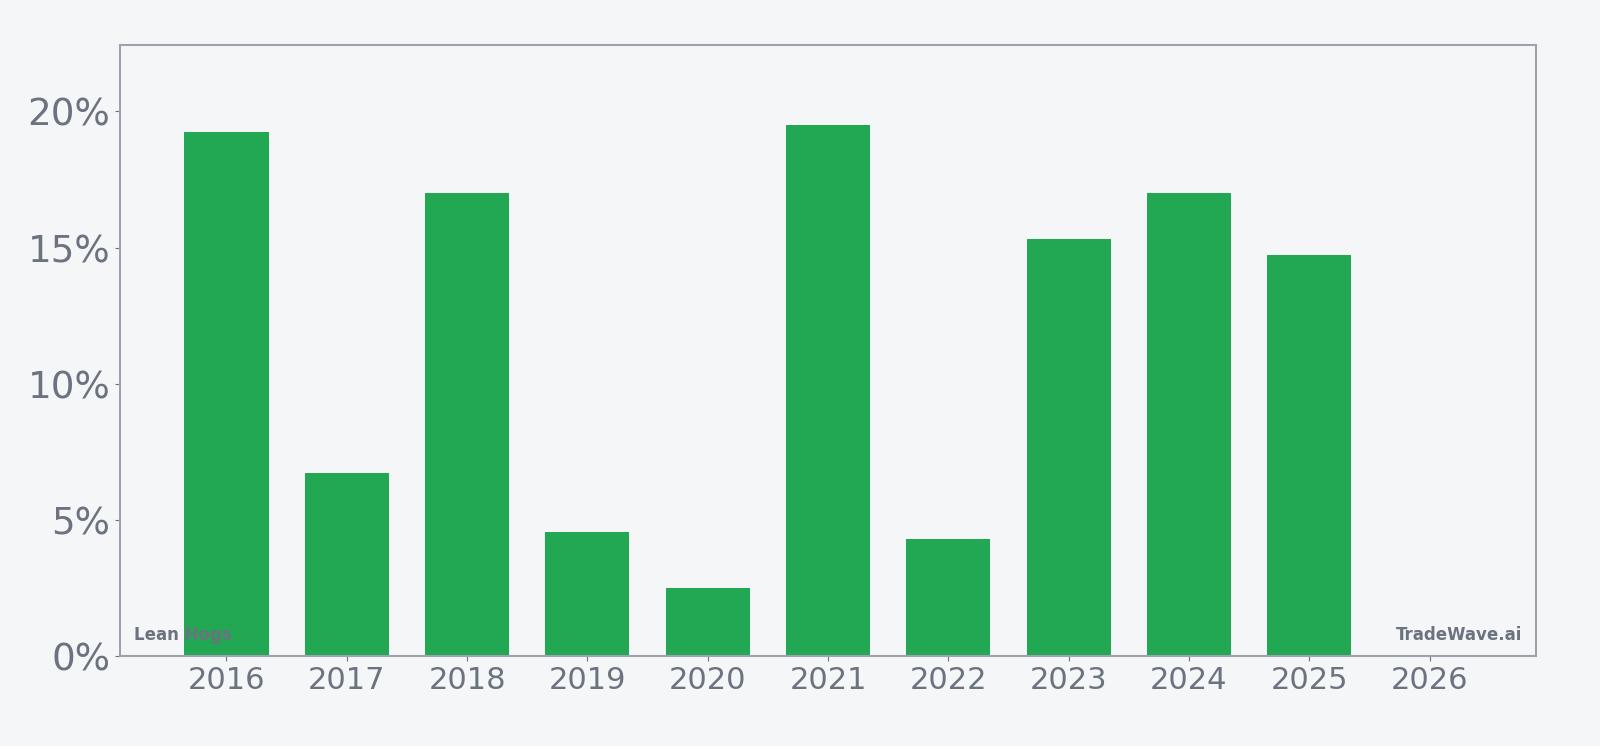
Across the 10-year sample, the long trade direction has been firmly rewarded in this window. Percent Profitable sits at 100%, with 10 winners and 0 losers, and the average profit of 12.1% means even the softer years still finished comfortably positive. The strongest season in the set came in 2021, when the window captured a 19.52% gain from roughly 94 to 113, while the weakest was 2020, which still managed a 2.53% rise despite intense volatility early in the pandemic period.
The historical path of returns shows that this is not a slow grind higher. The TradeWave Ratio of 3.74 indicates that price has typically traveled meaningfully in the long direction within the window, reflecting strong directional swings rather than flat noise. The Sharpe ratio of 1.72, based on end-of-window outcomes, is high for a commodity contract and signals that the gains have come with a relatively favorable risk-adjusted profile over this specific slice of the calendar.
The 10-year average trend line for the window slopes higher, with much of the typical gain accruing in the back half of the period. In many years, Lean Hogs has chopped sideways or even dipped slightly in the first couple of weeks before momentum built into late April. That pattern suggests traders have often been rewarded for staying with the move once it starts rather than expecting an immediate surge on day one.
Yearly net and peak moves highlight how upside bursts have come alongside meaningful drawdowns inside the window.
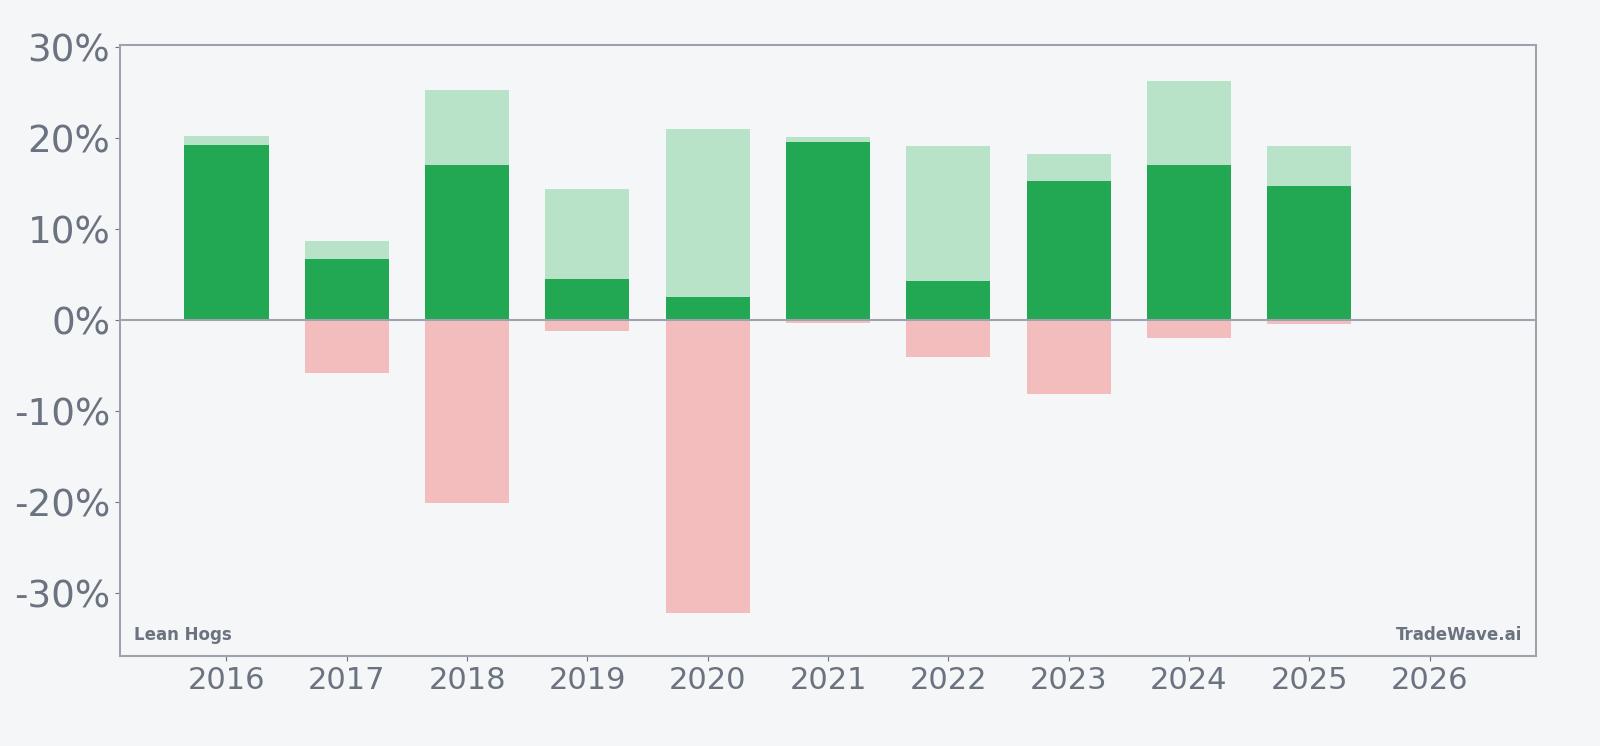
Maximum favorable excursions in the sample have been striking, with several years seeing peak run-ups above 20% inside the window, including 2018 and 2024. At the same time, maximum adverse excursions have occasionally been severe, most notably in 2020 when the worst intraperiod drawdown exceeded 30% even though the window still finished higher. That mix of large MFE and large MAE underscores that this is a high-energy stretch for Lean Hogs, where the long side has historically won out but the path has not been smooth.
History does not guarantee future results; adverse excursions can be large even in winning windows, and traders should size risk with that volatility in mind.
Price and near-term drivers
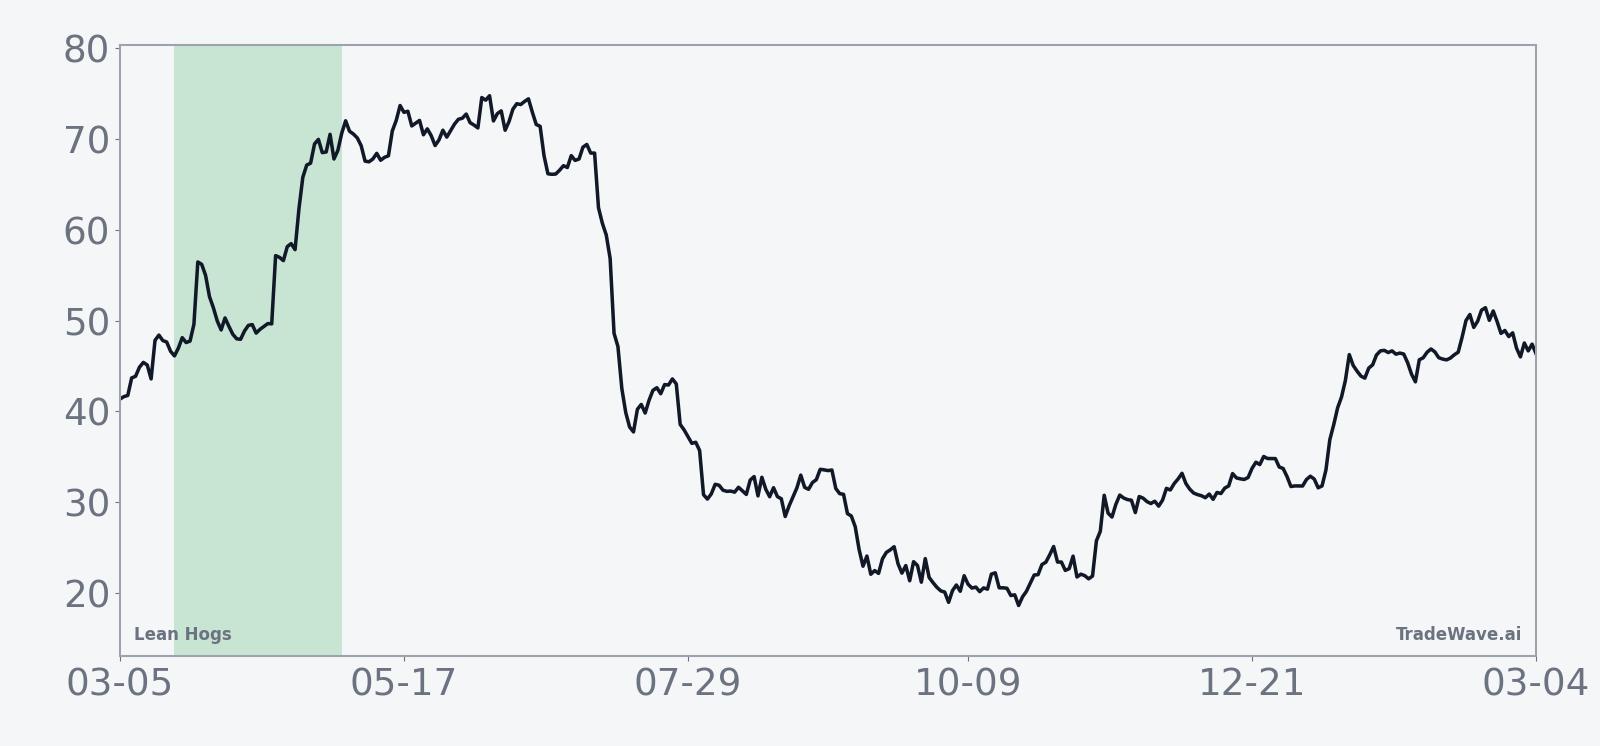
Front-month Lean Hogs futures head into this seasonal window after a year of two-way trade, with prices recently hovering just below the 50-day moving average around 94 and well off the 52-week high near 113.375. The contract has climbed about 1.54% over the past month, a modest recovery from last year’s lows near 77.125 that leaves the tape neither stretched nor deeply oversold as the spring pattern kicks in.
In the absence of a single dominant macro headline, the usual hog-market drivers are likely to shape how this year’s window plays out. On the demand side, traders will be watching consumer spending and protein demand signals as grilling season approaches in North America, where retail promotions and restaurant traffic can quickly tighten or loosen packer margins. On the supply side, any shift in herd liquidation plans, disease headlines, or feed-cost moves in corn and soybean meal can alter slaughter weights and forward supply expectations, feeding directly into Lean Hogs pricing.
Logistics and cold-storage dynamics also matter in this stretch. Spring often brings a transition in product flows as processors pivot from winter cuts to summer items, and any bottlenecks in transportation or export channels can show up in weekly cold-storage and export-sales data. For a contract that has historically moved sharply in this window, even routine inventory surprises can become catalysts when they land against a backdrop of seasonal positioning.
Positioning data for hogs is typically dominated by commercial hedgers and managed money funds, with speculators quick to add or cut length when price starts to trend. If this year follows the historical script, a modest early pullback inside the window could be met with fresh buying from funds looking to ride the seasonal pattern, while a fast upside break might instead trigger profit-taking from commercials that have seen this movie before. Either way, the 44-day stretch from late March into early May has repeatedly been where the bigger moves have clustered.
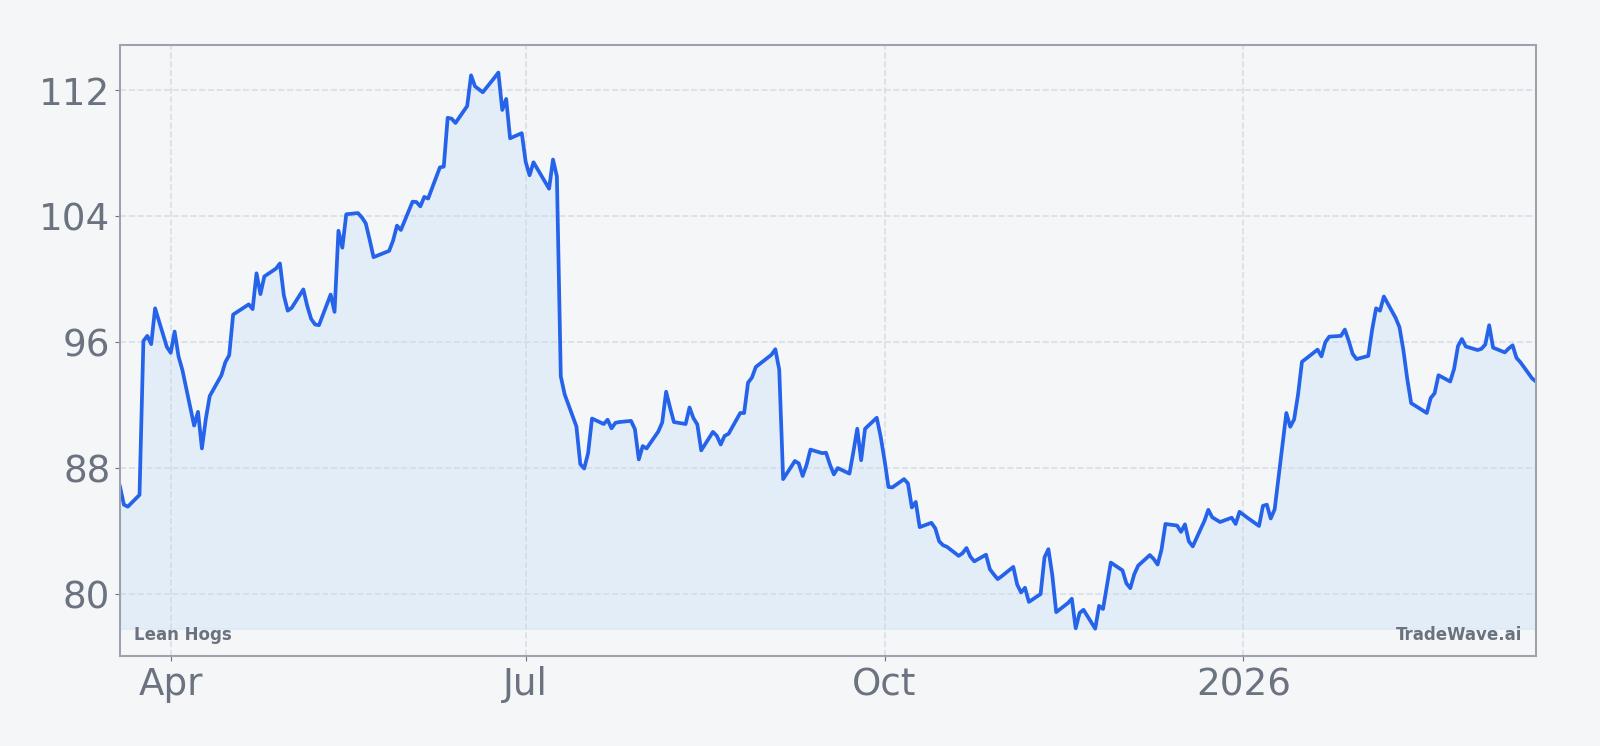
The chart below situates the latest Lean Hogs action against its recent 12-month range.
What to watch in this year’s window
For traders tracking this 44-day stretch, the first checkpoint is how Lean Hogs behaves in the opening two weeks. In many of the past 10 years, early dips have not broken the pattern, but deeper-than-usual selling or a failure to stabilize could signal that this season’s tape is diverging from the historical script. A quick push back toward the mid-100s, by contrast, would be more in line with the typical late-window strength seen in prior cycles.
Second, watch the weekly flow of supply-and-demand data. Slaughter numbers, carcass weights, and export-sales reports will help confirm whether fundamental tightening is emerging to justify a seasonal rally or whether price is running ahead of the data. If cold-storage inventories start to draw down while export demand firms, that would add a fundamental backbone to a historically bullish calendar period.
Third, keep an eye on related markets. Corn and soybean meal prices feed directly into hog production costs, and sharp moves there can either amplify or blunt the seasonal pattern in Lean Hogs. A spike in feed costs during this window has historically coincided with more aggressive producer hedging and sometimes sharper price swings in the futures curve.
Finally, monitor intraday volatility and depth of book as the window progresses. The historical record shows that when Lean Hogs moves in this period, it can move quickly, with large peak run-ups and sizable drawdowns inside otherwise winning seasons. If liquidity thins out on rallies or selloffs, that could be a sign that larger players are leaning into the seasonal tendency, increasing the odds of air pockets in either direction.
Add it up: Lean Hogs is stepping into a calendar window that has been 10 for 10 on the long side over the past decade, with double-digit average gains and plenty of volatility along the way. Whether this year keeps the streak alive will depend on how spring demand, herd decisions, and feed markets intersect with a contract that has a habit of making its bigger moves right about now.