Cleveland-Cliffs (CLF) Has Fallen in 9 Straight Late-March Windows Favoring the Short Side
Cleveland-Cliffs is under pressure ahead of a late-March stretch that has rewarded short-side seasonality in every year of the past decade.

Key takeaways
- Cleveland-Cliffs enters a 16-day spring window starting Mar 31 that has favored short positions in all 9 years of data.
- The pattern is short-directed, with 100% Percent Profitable, 9 winners and 0 losers, and an Avg Profit of 6.77% for shorts.
- The TradeWave Ratio of 1.61 signals that price has typically moved meaningfully in the trade direction within the window.
- Historical best and worst intraperiod swings show sizable rallies and drawdowns, underscoring that this is a high-volatility stretch for CLF.
- Shares trade at 8.35, about 50.0% below the 52-week high of 16.70, as the stock digests a tough earnings year and heavy short interest.[8]
- Investors face a backdrop of negative recent earnings, a Hold consensus rating, and a seasonal window that has repeatedly leaned bearish on the stock price.[1]
According to historical data from TradeWave.ai, this late-March stretch has behaved very differently from an average month for Cleveland-Cliffs. The next section unpacks how that pattern has played out across the past nine years and what it means for traders watching the stock today.
Seasonal window
Cleveland-Cliffs has delivered profitable short-side results in 9 of 9 years during this 16-day spring window, with average gains of 6.77% for the short trade. The next iteration begins on Mar 31, with the stock last changing hands at 8.35, about 50.0% below its 52-week high of 16.70 and roughly 48.3% above the 52-week low of 5.63. That combination of a deeply discounted spot price and a perfect short-side seasonal record makes this a window equity traders will be watching closely.
Year-by-year net returns and intraperiod swings show how consistently this window has leaned bearish on price while still delivering sharp rallies and drawdowns along the way.
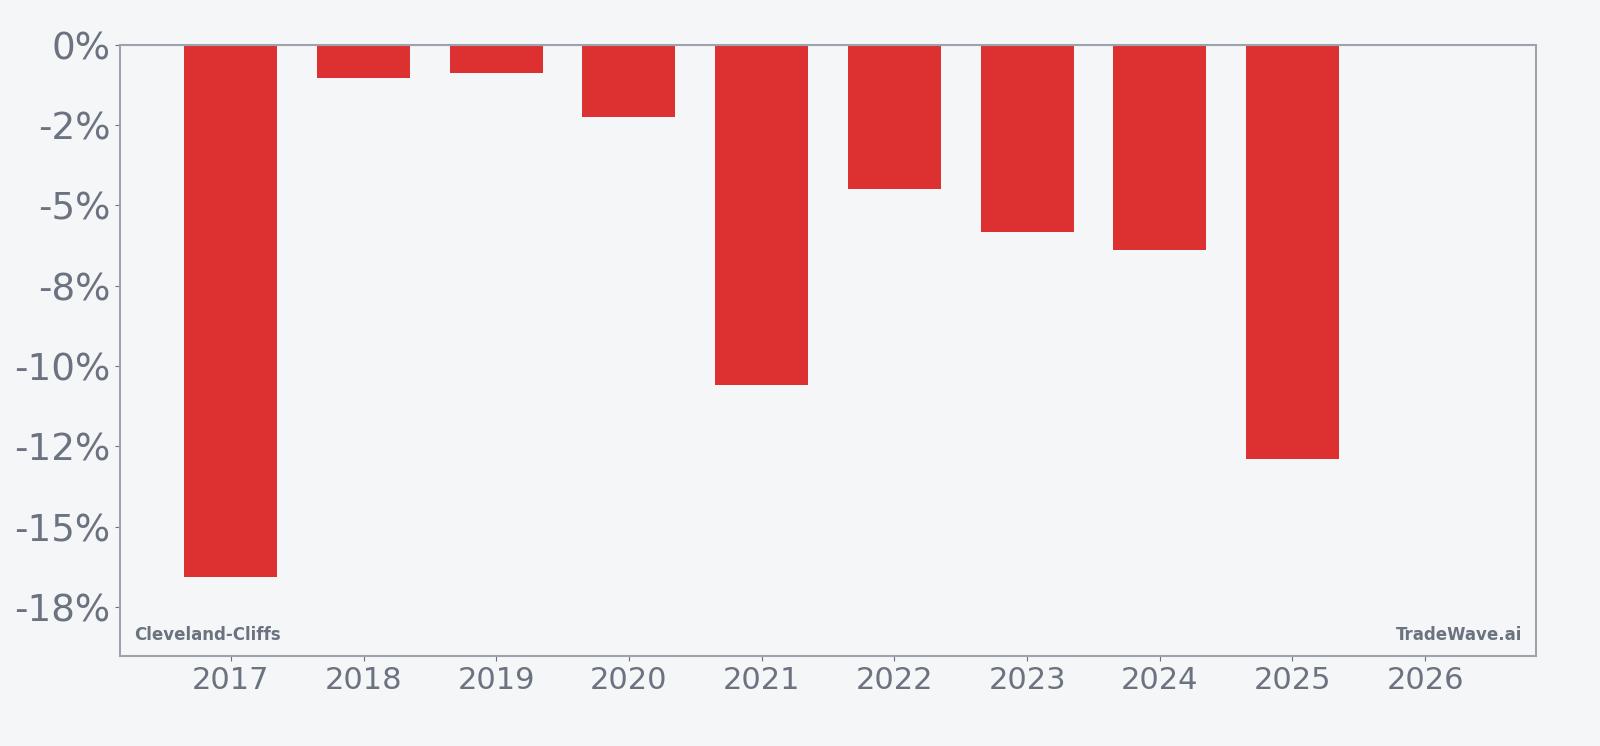
The trade direction for this pattern is short, which means negative returns are favorable outcomes for the strategy. Across the nine-year sample, every iteration produced a net decline in the stock price over the 16-day span, from a modest 0.88% drop in 2019 to a 16.56% slide in 2017 and a 12.90% fall in 2025. Average winner gains of 6.77% for the short position line up with a 7% all-years average, since there were no losing years in the sample.
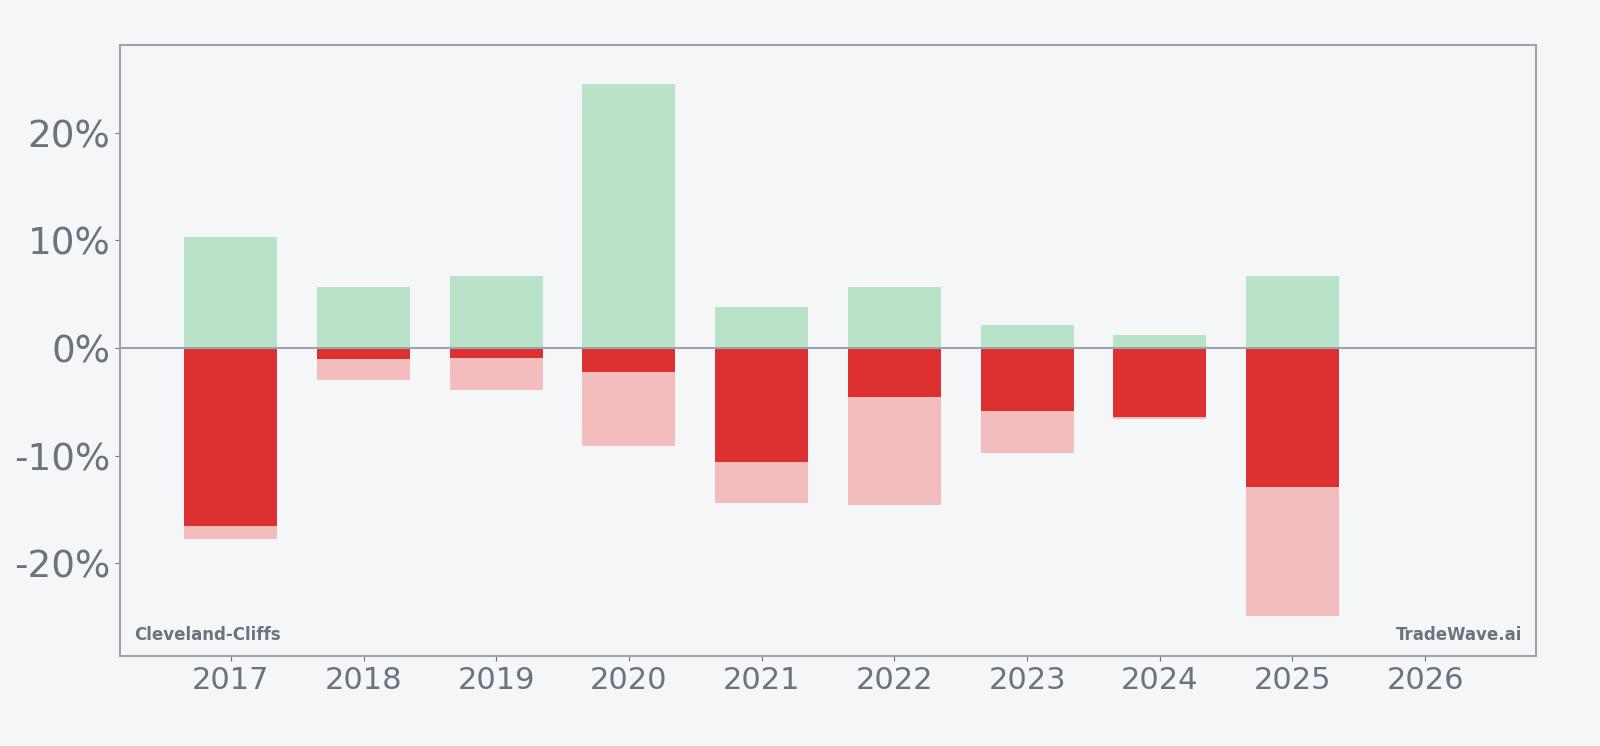
The intraperiod behavior has been anything but quiet. In 2020, for example, the best point-to-peak move in the trade direction, known as the maximum favorable excursion, reached 24.5%, while the worst drawdown from entry, or maximum adverse excursion, was 9.11%. In 2025, the short trade ultimately finished up 12.90%, but not before enduring a 24.91% adverse move at one point in the window. That mix of large favorable and large adverse swings is what the 1.61 TradeWave Ratio is flagging: when this window moves, it tends to move hard.
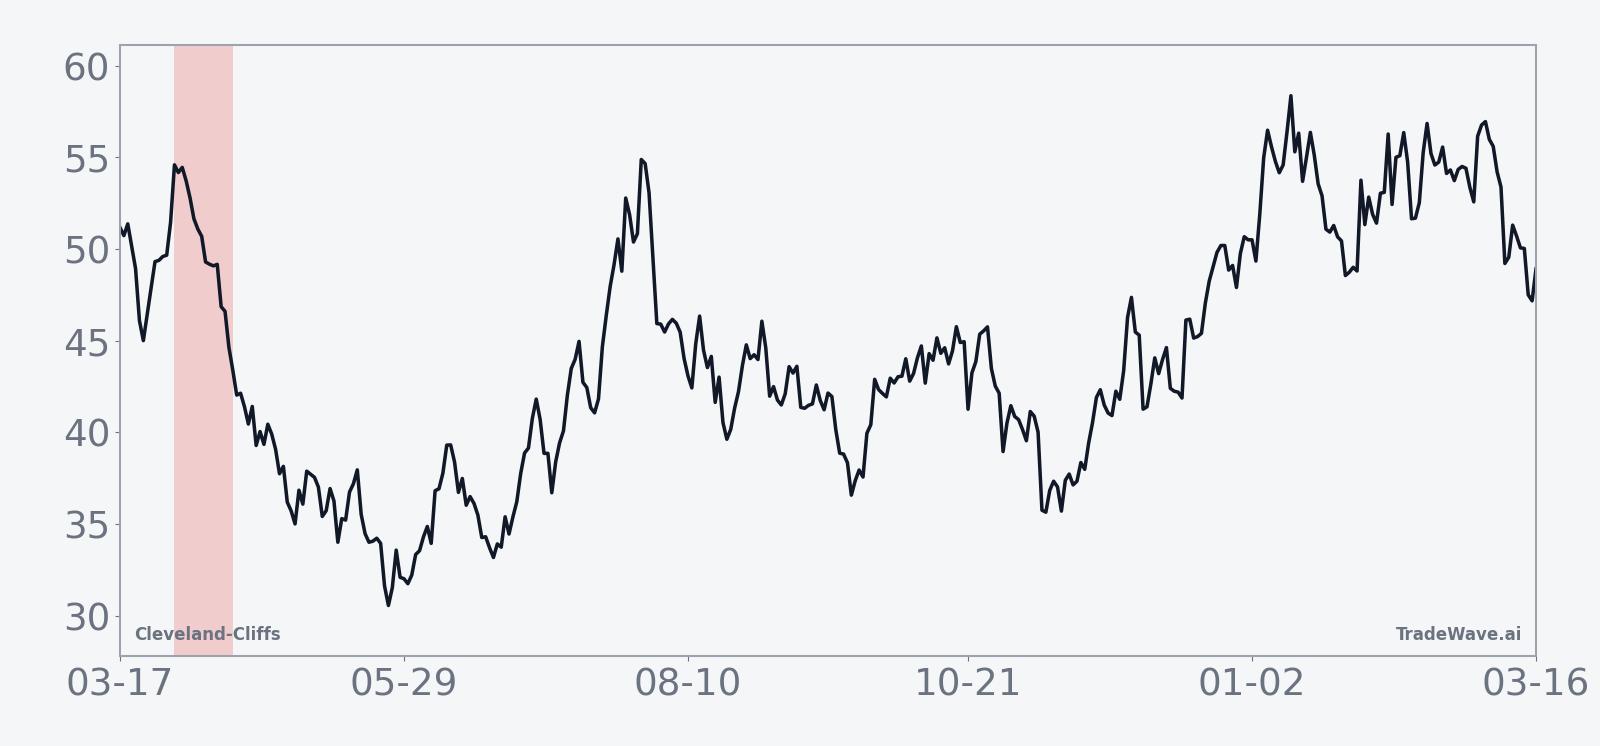
The seasonal trend chart shows that, on average, the bulk of the downside for CLF in this window has tended to accrue in the middle of the 16-day span rather than right at the start. Early days often feature countertrend rallies that pressure shorts before the pattern has historically tilted back in their favor. The cumulative return profile across the nine years climbs steadily for the short strategy, with no multi-year flat spots, which is unusual for such a short calendar slice.
Looking at individual years, 2017 stands out as the strongest for the short pattern, with a 16.56% net gain for bears and a 17.78% worst drawdown from the stock’s perspective. On the other side, 2018 and 2019 were the softest, with net declines of just 1.02% and 0.88% respectively, and relatively contained adverse moves. Even in those quieter years, the short trade still finished in the green, which is why the Percent Profitable metric sits at 100% with 9 winners and 0 losers.
History does not guarantee future results; adverse excursions can be large even in winning windows, and traders using this pattern still face the risk of sharp countertrend moves.
Price and near-term drivers
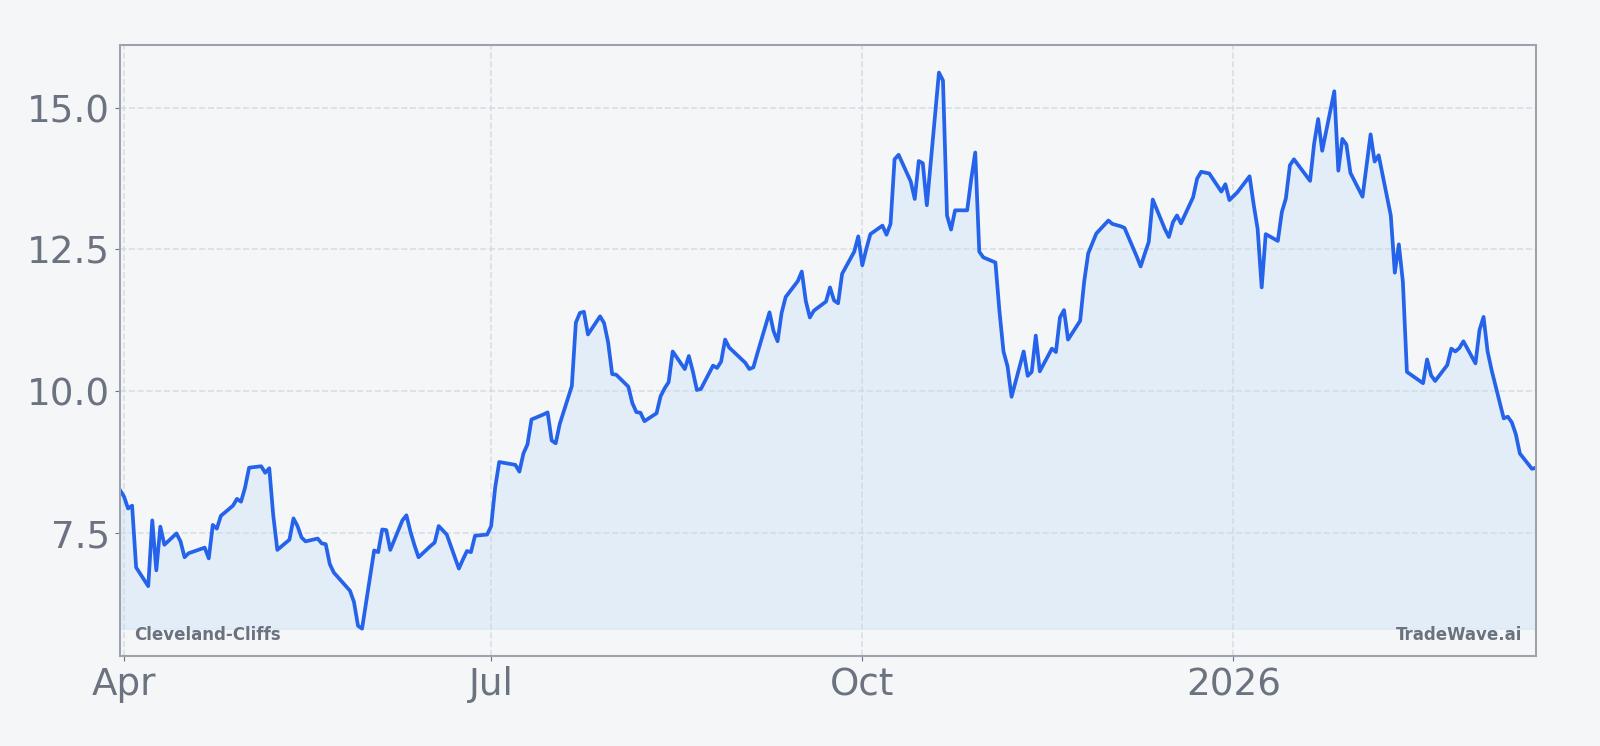
Cleveland-Cliffs closed at 8.35 on Mar 18, down 3.0% on the day, extending a one-month slide of 20.63% and leaving the stock about 50.0% below its 52-week high of 16.70. The shares sit well under the 50-day moving average of 12.05 and are trading with elevated liquidity, with roughly 22.7 million shares changing hands against a 20-day average volume of about 16.9 million. That price action reflects a market still digesting a tough earnings year and a balance sheet that has been under pressure from steel-cycle volatility.[1]
In Q1 2025, Cleveland-Cliffs posted a loss of 0.92 dollars per share, missing consensus by 0.14 dollars, on revenue of 4.63 billion dollars that fell 11.0% year over year.[1] By Q2 2025, the company narrowed the loss to 0.50 dollars per share and beat estimates by 0.18 dollars, with revenue improving to 4.93 billion dollars and growing 7.5% from the prior year period.[2] Even so, analysts highlighted negative return on equity and net margins across those quarters, underscoring that the recovery in operations has been uneven.[1]
Street expectations remain cautious. MarketBeat data from mid-2025 showed a Hold consensus rating on CLF and a consensus price target of 11.09 dollars, implying upside from current levels but reflecting an earlier price regime when the stock traded higher.[1] Analysts as a group expect full-year earnings of negative 0.79 dollars per share, which keeps the valuation conversation focused less on traditional multiples and more on balance-sheet resilience and operating leverage to any upturn in steel demand.[3]
Positioning has also shifted. In June 2025, MarketBeat reported a significant increase in short interest in Cleveland-Cliffs shares, alongside insider selling by Executive Vice President James D. Graham, who sold 120,000 shares at 6.85 dollars, cutting his stake by 19.60%.[8] Several institutional investors adjusted their holdings through mid-2025, with some funds adding exposure and others trimming positions, a pattern consistent with a stock caught between value buyers and macro-driven sellers.[2][3][4][5][6][7]
The chart below situates the latest move in its recent multi-month context.
Earnings backdrop
The earnings story behind CLF’s chart is one of transition. The company moved from a deeper loss in Q1 2025 to a narrower loss in Q2, with revenue stabilizing and even growing modestly year over year.[1][2] Management has been working through cost pressures and demand swings tied to autos, construction and energy, all of which feed directly into the steel complex.
Analysts expect the company to remain in the red for the current fiscal year, with the consensus calling for negative 0.79 dollars in earnings per share.[3] That expectation keeps the focus on cash generation and debt metrics rather than headline EPS beats or misses. For traders, it also means that any upside surprise in future quarters could have an outsized impact on a stock that is already heavily discounted versus its 52-week peak.
Macro and sector context
Cleveland-Cliffs sits at the intersection of U.S. manufacturing, autos and infrastructure, so its fortunes are tightly linked to the broader industrial cycle. While the research set here does not include fresh macro data, the 2025 earnings pattern shows how quickly revenue can swing with end-market demand.[1][2] When auto builds and construction activity pick up, CLF’s top line tends to respond, but margins can lag if input costs or labor expenses move against the company.
Institutional flows through mid-2025 reflected that push and pull. Some asset managers increased positions, betting on a cyclical rebound in steel, while others reduced exposure, citing uncertainty around demand and pricing power.[2][3][4][5][6][7] That split positioning helps explain why the stock can move sharply on relatively modest news, especially when short interest is elevated.[8]
Valuation and positioning
With CLF trading at 8.35 and consensus targets from mid-2025 clustered around 11.09 dollars, the stock screens as discounted versus where the Street thought it should trade last year.[1] Because the company is expected to post a loss for the current fiscal year, traditional valuation metrics like price-to-earnings are less useful, and investors instead focus on enterprise value relative to revenue and the replacement cost of CLF’s steel assets.[3]
The combination of a Hold rating, negative expected earnings and a stock price that has already been cut in half from its 52-week high creates a tricky setup. Value-oriented investors may see room for mean reversion if the steel cycle turns, while short sellers point to weak profitability and heavy capital needs. That tension is exactly the kind of backdrop where a strong, short-directed seasonal pattern can matter more than usual.
What to watch as the window opens
The 16-day seasonal window for Cleveland-Cliffs starts on Mar 31 and runs into mid-April. Historically, it has been a clean short-side stretch, with 9 winners, 0 losers and an average 6.77% gain for the short trade. The most important confirmation signal this time around will be how the stock behaves in the first few sessions of the window. If CLF rallies sharply early, as it has in several past years, traders will be watching to see whether that strength fades into the middle of the window, where the historical pattern has tended to assert itself.
On the fundamental side, any updates on steel pricing, auto production schedules or infrastructure spending could shift sentiment quickly. With the stock already about 50.0% below its 52-week high, a positive macro surprise could squeeze shorts, especially given the significant short interest reported in June 2025.[8] Conversely, if volumes stay heavy and the price fails to reclaim the 50-day moving average near 12.05 during the window, that would line up with the historical tendency for this period to lean bearish on the stock price.
Traders should also keep an eye on positioning signals. If short interest builds further from the levels highlighted in mid-2025 or if insider activity turns more negative, that would reinforce the idea that professional money is leaning against the stock into this seasonal stretch.[8] A reversal in those signals, with shorts covering or insiders buying, would cut against the historical pattern and could blunt the downside that has so often appeared in this window.
Add it up: a stock trading at a steep discount to its recent highs, a mixed but improving earnings backdrop, and a 9-for-9 short-side seasonal record converging into a tight 16-day span. For Cleveland-Cliffs, what happens between Mar 31 and mid-April will offer a clear test of whether that pattern still has bite.
Sources
- MarketBeat: Cleveland-Cliffs (NYSE:CLF) Shares Up 3% - What's Next? (Jun 17, 2025)
- MarketBeat: Triumph Capital Management Makes New Investment in Cleveland-Cliffs Inc. (NYSE:CLF) (Jul 27, 2025)
- MarketBeat: Drexel Morgan & Co. Increases Holdings in Cleveland-Cliffs Inc. (NYSE:CLF) (Aug 2, 2025)
- MarketBeat: GAMMA Investing LLC Has $582,000 Position in Cleveland-Cliffs Inc. (NYSE:CLF) (Jun 19, 2025)
- MarketBeat: Entropy Technologies LP Sells 50,579 Shares of Cleveland-Cliffs Inc. (NYSE:CLF) (Aug 17, 2025)
- MarketBeat: Edgestream Partners L.P. Purchases New Shares in Cleveland-Cliffs Inc. (NYSE:CLF) (Jul 19, 2025)
- MarketBeat: Twelve Points Wealth Management LLC Raises Position in Cleveland-Cliffs Inc. (NYSE:CLF) (Jul 12, 2025)
- MarketBeat: Cleveland-Cliffs Inc. (NYSE:CLF) Sees Significant Increase in Short Interest (Jun 18, 2025)
- MarketBeat: Cleveland-Cliffs (NYSE:CLF) Stock Price Down 1.3% - Here's Why (Jul 12, 2025)