14 of 15 Late-April Windows Have Delivered Gains for Natural Gas (CME) (NG)
Natural Gas (CME) is grinding near the bottom of its recent range just weeks before a late-April window that has delivered gains in most years, setting up a tension between bearish storage trends and bullish seasonality.

What is the seasonal pattern for Natural Gas (CME) (NG)?
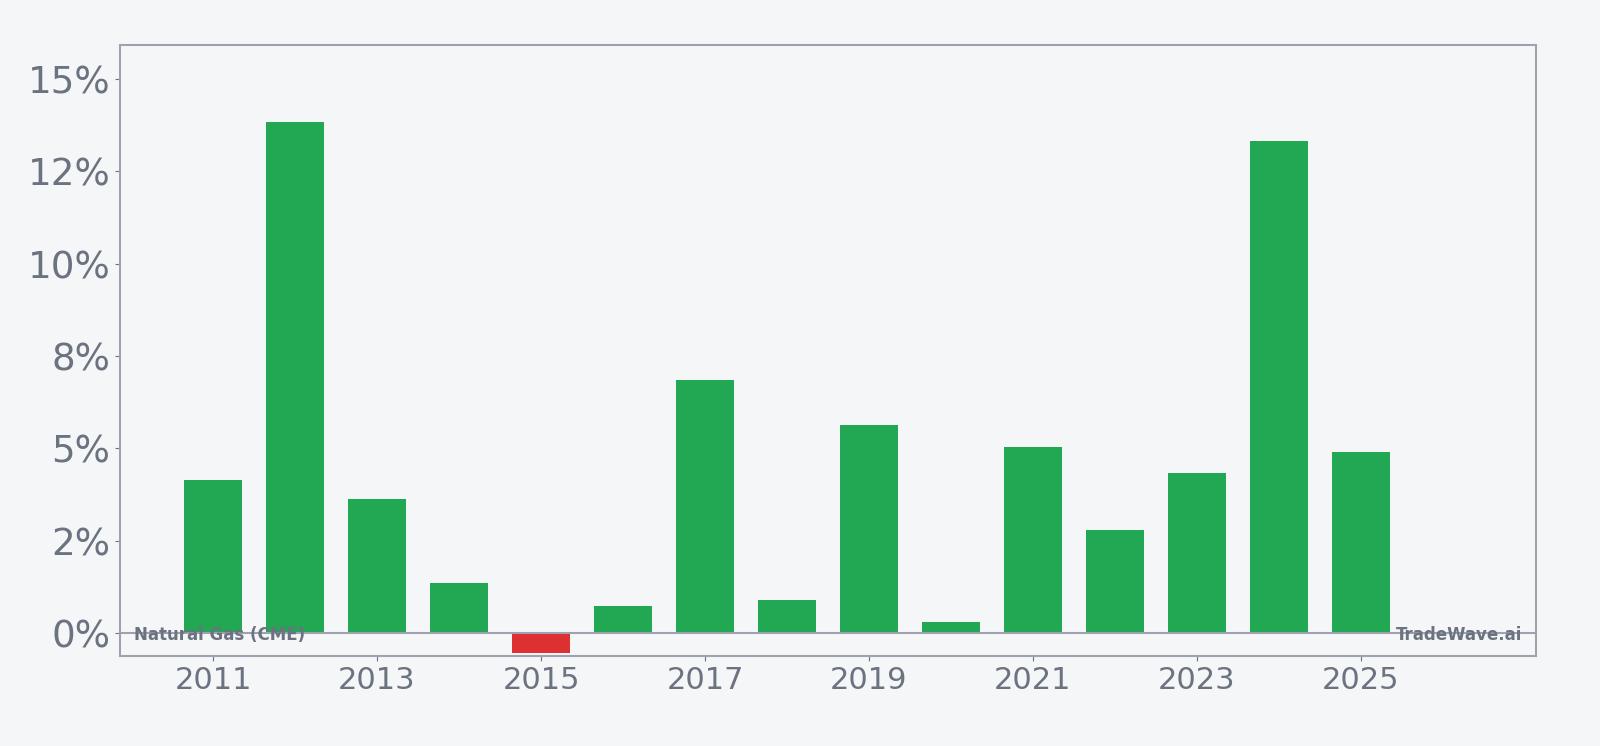
Natural Gas (CME) has risen in 14 of 15 years during this late-April six-day window, with an average gain of 4.84% in winning years.
- 14 for 15 in this window, with winning years averaging 4.84% gains over six trading days.
- The upcoming pattern runs from Apr 23, 2026 and spans 6 days, forming a historically bullish Natural Gas (CME) trading window.
- Percent Profitable is 93%, with 14 winners and just 1 loser across the 15-year lookback.
- Avg Profit - All, which includes the lone losing year, still comes in at 4%, pointing to a strong upside bias.
- Individual years have seen sharp swings, with some windows posting double-digit maximum favorable moves alongside notable intraperiod drawdowns.
- Add it up: a 90% cumulative return across the sample, concentrated in a short late-April seasonal pattern.
According to historical data from TradeWave.ai, this late-April stretch has behaved very differently from an average spring week in natural gas, and the next iteration is now less than a month away.
How has Natural Gas (CME) (NG) traded in this late-April window?
Natural Gas (CME) has rallied in 14 of the past 15 years during the six trading days starting Apr 23, with winning years averaging a 4.84% gain and only one small loss on record. Today the front-month NG contract settled at 2.859, up 1.4% on the session and hovering just above its 52-week low of 2.622, far below last year’s 7.827 peak.[7]
The trade direction for this pattern is long, and the track record is unusually one-sided for a commodity as volatile as natural gas. Across the 15-year sample, Percent Profitable sits at 93%, with 14 winners and just one losing year, and even after including that down year the all-years average return is still 4% for the window. The median outcome is a 4.15% gain, which lines up closely with the average, suggesting the typical late-April move has been a mid-single-digit pop rather than a rare outlier.
Individual years show how that plays out. In 2024, the window delivered a 13.32% net gain, with the contract’s best intraperiod run-up reaching 14.18% before giving back a small portion into the close. In 2017, NG added 6.85% over the six days, while 2019 and 2021 posted 5.64% and 5.04% respectively, all consistent with a bullish late-April NG seasonal trend. The lone losing year in the sample, 2020, saw only a 0.31% decline, underscoring how limited the downside has been at the end of the window even when conditions were unfavorable.
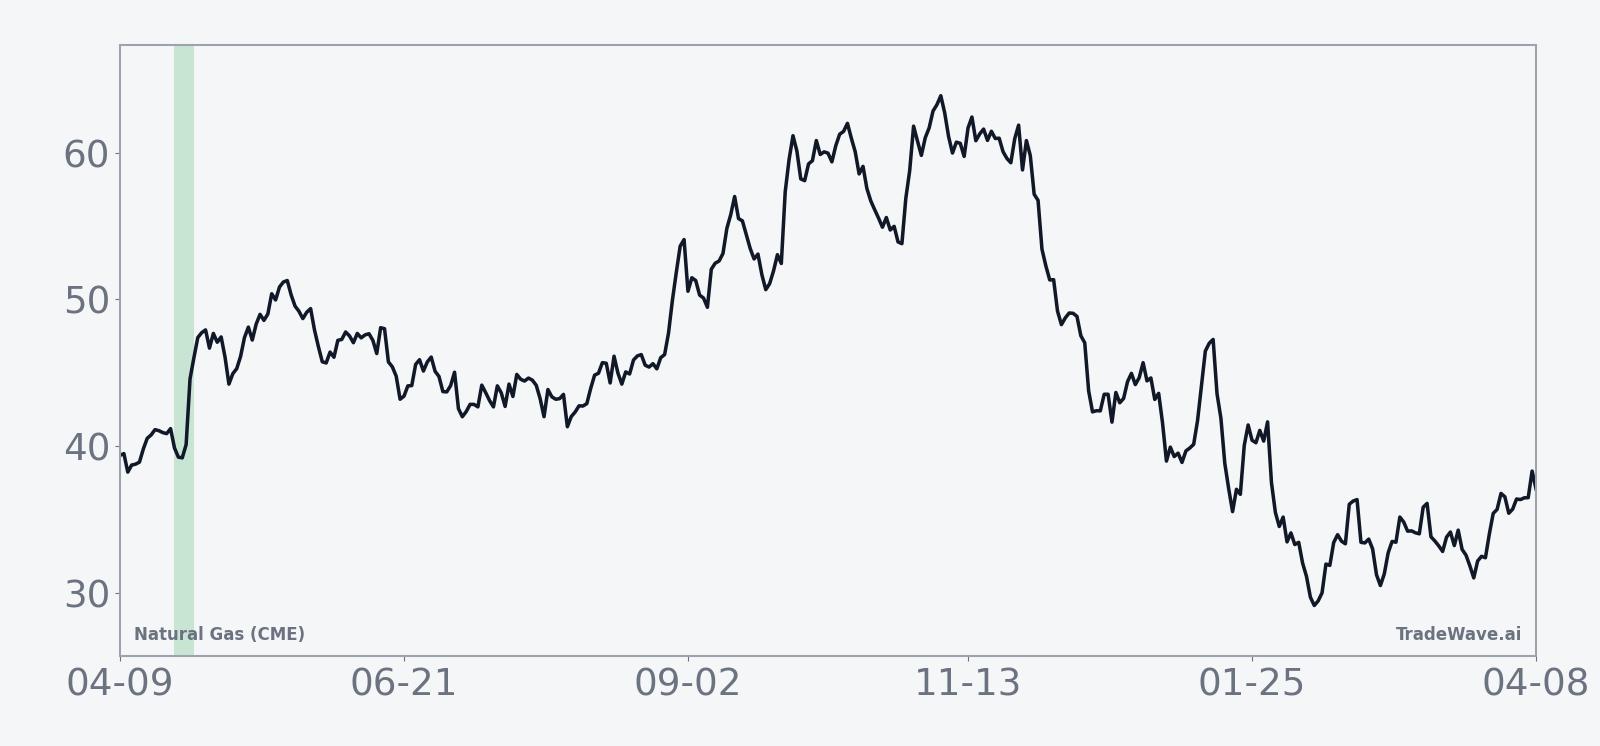
The historical seasonal average curve for this window slopes steadily higher, with most of the gains accruing in the middle of the six-day stretch rather than in a single spike. That suggests prior years have often seen traders lean into the pattern over several sessions, rather than a one-day weather shock or headline-driven jump. The cumulative return profile, at 90% across the sample, reflects that repeated clustering of modest but consistent late-April rallies.
Year-by-year maximum favorable and adverse moves show how much NG has typically swung inside this short window.
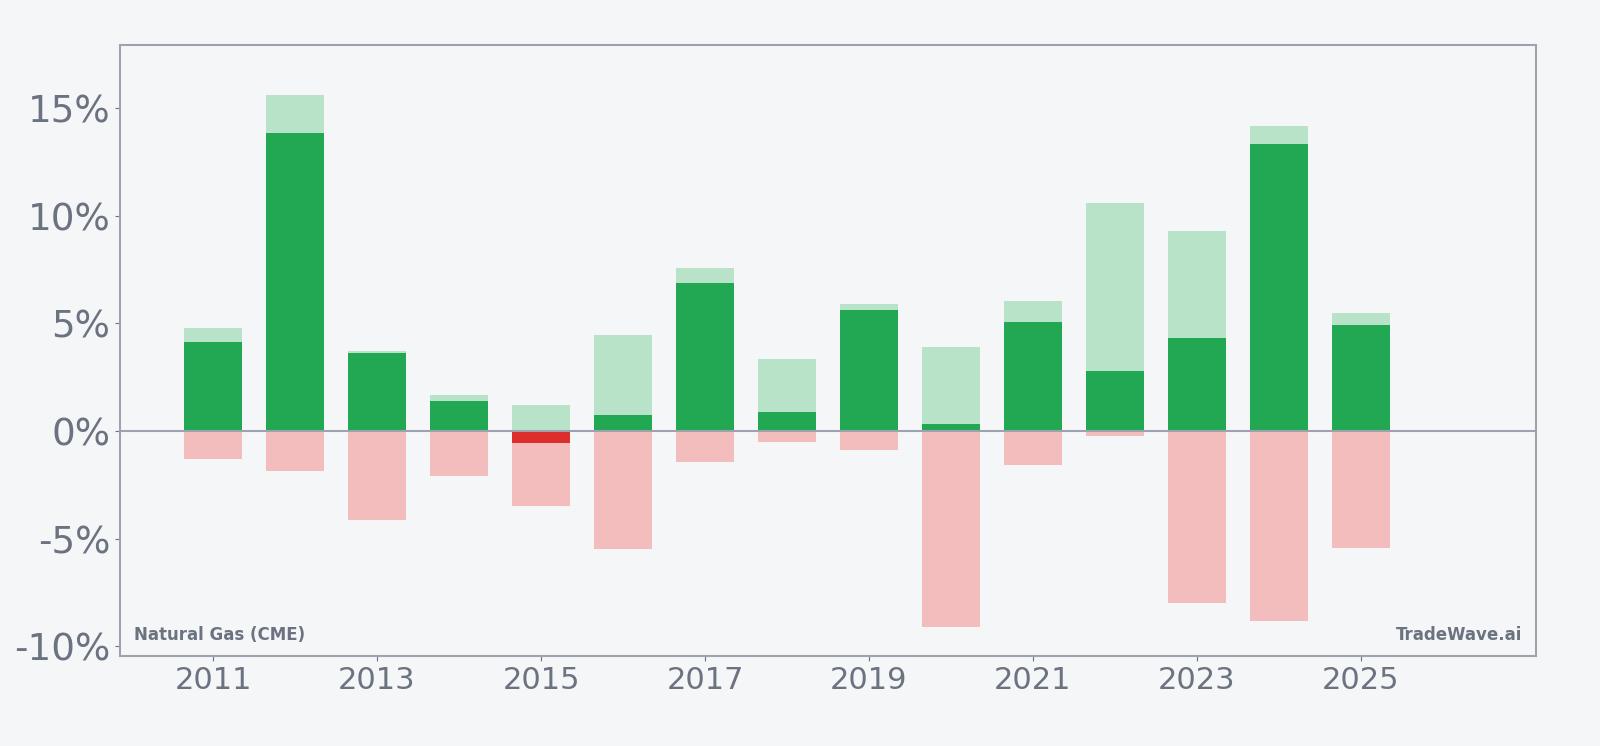
The maximum favorable excursion and maximum adverse excursion profile shows that even winning years have not been smooth. In 2022, for example, NG’s best intraperiod move reached 10.57% while the worst drawdown from entry was just 0.22%, a clean upside skew. By contrast, 2023 and 2024 both saw double-digit peak run-ups of 9.27% and 14.18% respectively, but also deep intraperiod drawdowns of 7.97% and 8.83%, reminding traders that late-April has often delivered fast two-way trade before finishing higher. The TradeWave Ratio of 1.52 captures that tendency for price to travel meaningfully in the long direction within the window, even when the final close does not fully reflect the intraday swings.
History does not guarantee future results; adverse excursions can be large even in winning windows, and natural gas remains one of the most volatile contracts on the board.
Why does Natural Gas (CME) (NG) follow this seasonal pattern?
This late-April pattern likely reflects the handoff from peak winter heating demand to the start of the injection season, when traders reassess storage levels and summer power-burn expectations. One likely driver is the way utilities and producers adjust hedges and physical flows as storage data clarifies whether the market is heading into summer with a surplus or a deficit. That repositioning, layered on top of shifting weather models for early summer, can create a short burst of buying interest that has historically favored the long side in this specific window.
What is driving Natural Gas (CME) (NG) today?
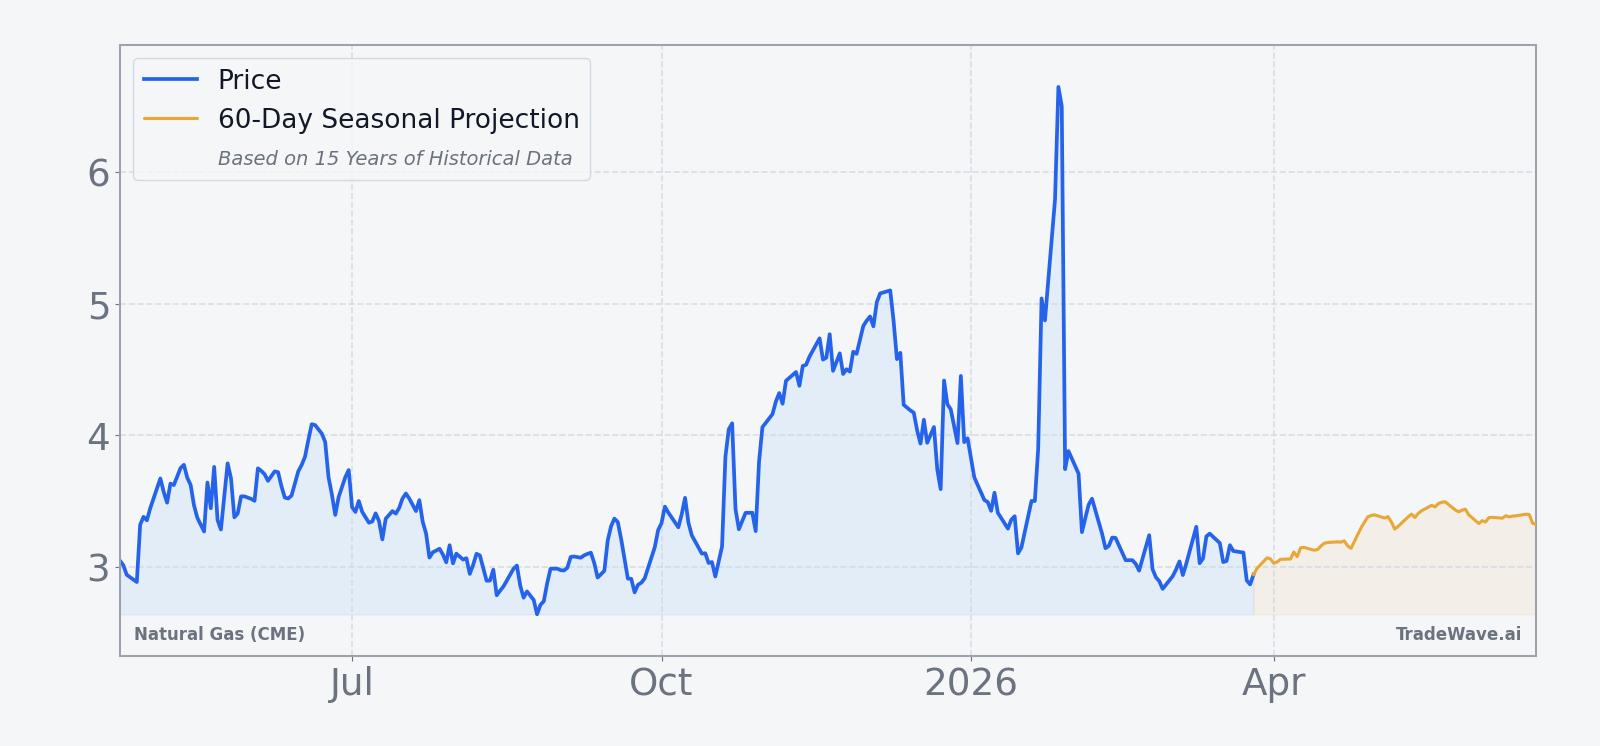
Front-month Natural Gas (CME) futures closed at 2.859 on Apr 2, up 0.04 on the day for a 1.4% gain, but still pinned near the lower end of the past year’s range as traders digest a milder late-winter demand profile and easing storage deficits.[7] The contract has bounced about 3.25% over the past month, yet it remains far below last year’s 7.827 high and is trading under its 50-day moving average of 3.51298 on relatively light volume of 8,015 contracts versus a 20-day average of 145,580.8, a sign that many participants are waiting for clearer signals on weather and inventories before committing fresh capital.[7]
In Feb 2026, U.S. natural gas futures slipped in choppy trade after a smaller-than-expected inventory withdrawal and lower storage deficits, reinforcing the idea that high supply and comfortable stockpiles are capping rallies for now.[7] Earlier in the winter, extreme cold in the Northeast briefly sent prices sharply higher, but that spike faded as forecasts reverted toward more normal conditions and storage remained robust.[3] Across the past two heating seasons, a recurring theme has been that cold snaps can trigger short-lived squeezes, yet sustained upside has been hard to maintain when inventories sit above average and weather models lean mild.[1][5][6][8][10]
The chart below situates the latest move in its recent multi-month context, alongside a 60-day seasonal projection based on prior years.
From a macro standpoint, the key swing factors remain weather and storage. Cold weather spikes demand and can quickly tighten balances, while mild forecasts suppress heating loads and leave more gas available for injection into storage.[3] On the supply side, robust production and prior storage surpluses have limited upside potential beyond the injection season in several recent years, keeping a lid on rallies even when short-term demand jumps.[1] Sector-wide, energy demand tied to heating and power generation continues to dictate short-term price action, with traders watching each weekly storage report for signs that withdrawals are slowing and surpluses are eroding into the shoulder season.[2][7]
Looking ahead to the Apr 23–30 window, the tension is clear. On one side, the historical seasonality for NG is strongly bullish in this slice of the calendar. On the other, current fundamentals still point to comfortable inventories and a market that has struggled to hold gains when weather turns less supportive. For traders, the setup is less about a guaranteed bounce and more about how the next few storage reports and weather model updates line up with a window that has repeatedly delivered sharp, if volatile, upside moves in the past.
What should traders watch as this late-April window approaches?
First, weekly U.S. storage data will be critical. If withdrawals continue to shrink and inventories track toward the upper end of recent ranges, it would argue for a more muted response even in a historically strong window. A surprise acceleration in draws or early signs of tighter balances heading into summer would instead align with the bullish seasonal pattern and could amplify any upside move.
Second, watch the 2.62 to 3.00 band on the chart. Holding above the 52-week low near 2.622 while reclaiming the psychologically important 3-handle during or just after the Apr 23–30 stretch would be consistent with prior late-April rallies. A decisive break below the recent floor during the window would contradict the historical pattern and signal that supply and storage pressures are overwhelming the usual seasonal tailwind.
Third, monitor how intraday volatility behaves inside the window. Past years have seen large maximum favorable excursions alongside sizable drawdowns, so a pattern of wide daily ranges with closes skewed higher would fit the historical script. Conversely, a quiet, low-volatility drift with little follow-through on intraday spikes would suggest that the NG seasonal trend is taking a back seat to macro fundamentals this year.
Finally, keep an eye on how weather models evolve for early summer power demand. If forecasts shift toward hotter conditions that would boost air-conditioning load and gas-fired generation, that would add a second layer of support to a window that has already favored the long side in 14 of 15 years. If models instead lean cooler with continued high production, traders may treat any late-April bounce as an opportunity to reset hedges rather than the start of a sustained move.
Sources
- [1] The Wall Street Journal, "Natural-Gas Futures Face Mild Temperatures," Oct 3, 2025.
- [2] The Wall Street Journal, "U.S. Natural Gas Picks Up Ahead of Storage Data," Dec 10, 2025.
- [3] MarketWatch, "Natural-gas prices soar as temperatures drop," Jan 20, 2026.
- [4] The Wall Street Journal, "U.S. Natural Gas Futures Gain Ahead of Delayed Storage Data," Dec 29, 2025.
- [5] The Wall Street Journal, "U.S. Natural Gas Extends Pullback on Shifting Weather Outlook," Dec 9, 2025.
- [6] The Wall Street Journal, "U.S. Natural Gas Futures Extend Decline," Dec 12, 2025.
- [7] The Wall Street Journal, "U.S. Natural Gas Futures Slip in Choppy Trade," Feb 19, 2026.
- [8] The Wall Street Journal, "U.S. Natural Gas Futures Extend Losing Streak," Dec 15, 2025.
- [10] The Wall Street Journal, "U.S. Natural Gas Futures Give Back Some Gains," Dec 8, 2025.
About this seasonal analysis
Seasonal pattern data is sourced from TradeWave.ai, which analyzes historical price behavior across annual calendar windows going back up to 30 years. Read the full data methodology or the book The 100-Year Pattern by Afshin Moshrefi (2026 edition). Past performance of seasonal patterns does not guarantee future results. This article is for informational purposes only and does not constitute investment advice.