Sugar (SB) Has Fallen in 9 of 10 Midterm Windows Starting Mar 28
Sugar futures are slipping from recent highs just as a 37-day midterm-election seasonal window with a strong short-side record comes into view.
Key takeaways
- A 37-day seasonal window for Sugar tied to midterm election years begins on Mar 28 and has historically favored short positions.
- Across the last 10 midterm-election cycles, this window has produced profitable short trades in 9 years and losing outcomes in 1 year.
- Average gains in winning years have been 7.01%, while the all-years average including the lone loss still comes in at 6%.
- Intraperiod swings have been large, with several years showing double-digit peak drawdowns even when the short ultimately worked.
- Sugar settled at 15.53 on Mar 24, down 2.2% on the day and well below its 52-week high of 19.63, leaving room for both squeezes and further softening.
- Traders watching this window should treat it as a historically bearish but volatile stretch rather than a one-way bet.
According to historical data from TradeWave.ai, this late-March setup in Sugar behaves very differently from an average month on the futures calendar, especially in midterm election years.
Seasonal window
Sugar has delivered profitable short trades in 9 of the last 10 midterm-election windows that start around Mar 28 and run for 37 days, with winning years averaging 7.01% gains for the short side. The next iteration of that window begins on Mar 28, with Sugar last quoted at 15.53 on Mar 24 after a 2.2% drop and sitting about 20.9% below its 52-week high of 19.63. That combination of a strong historical short pattern and a market already backing off last year’s highs gives this window more bite than a typical spring lull.
The presidential election cycle matters here because this pattern is built only from midterm election years, a phase that often brings shifting policy expectations, subsidy debates and risk repricing across agricultural markets. Grouping the data this way strips out noise from other phases of the cycle and focuses on how Sugar has behaved when Washington is in the middle of a term and markets are looking ahead to the next campaign.
Within that midterm framework, the trade direction is explicitly short. In other words, the historical record treats years where Sugar fell during this window as “good” outcomes and years where it rallied as “bad” outcomes for the pattern. Across the last 10 such windows, 9 delivered net declines by the end of the 37 days and only 1 finished slightly higher, which is why the Percent Profitable metric sits at 90% with 9 winners and 1 loser.
The average winning year saw Sugar drop 7.01% from entry to exit, while including the lone losing year pulls the all-years average to 6%. That gap between Avg Profit and Avg Profit - All is small, which tells you the one losing year was modest rather than a violent squeeze against shorts. Median Profit of 4.93% reinforces the idea that while some years delivered double-digit declines, the typical outcome has been a mid-single-digit move lower.
Intraperiod swings have still been rough. In 2010, for example, Sugar fell 14.45% over the window, but the worst drawdown from entry during the trade reached 16.9% before the final close, while the best point-to-peak move in favor of the short was 4.23%. In 1986, the short ultimately made 4.9%, yet the contract first rallied as much as 4.36% against the position and at one point was down 16.99% from the entry before rolling over. Those best and worst excursions, known as maximum favorable excursion and maximum adverse excursion, show how choppy the path can be even in winning years.
The per-year table also shows that the only losing outcome, in 1990, was barely a scratch: Sugar finished the window up just 0.06% from the entry price, with a 4.36% move in favor of the short at one point and a 4.43% move against it at the worst. That kind of “flat but volatile” year is a reminder that the pattern’s edge has come from a cluster of sizable declines rather than a grind of tiny wins.
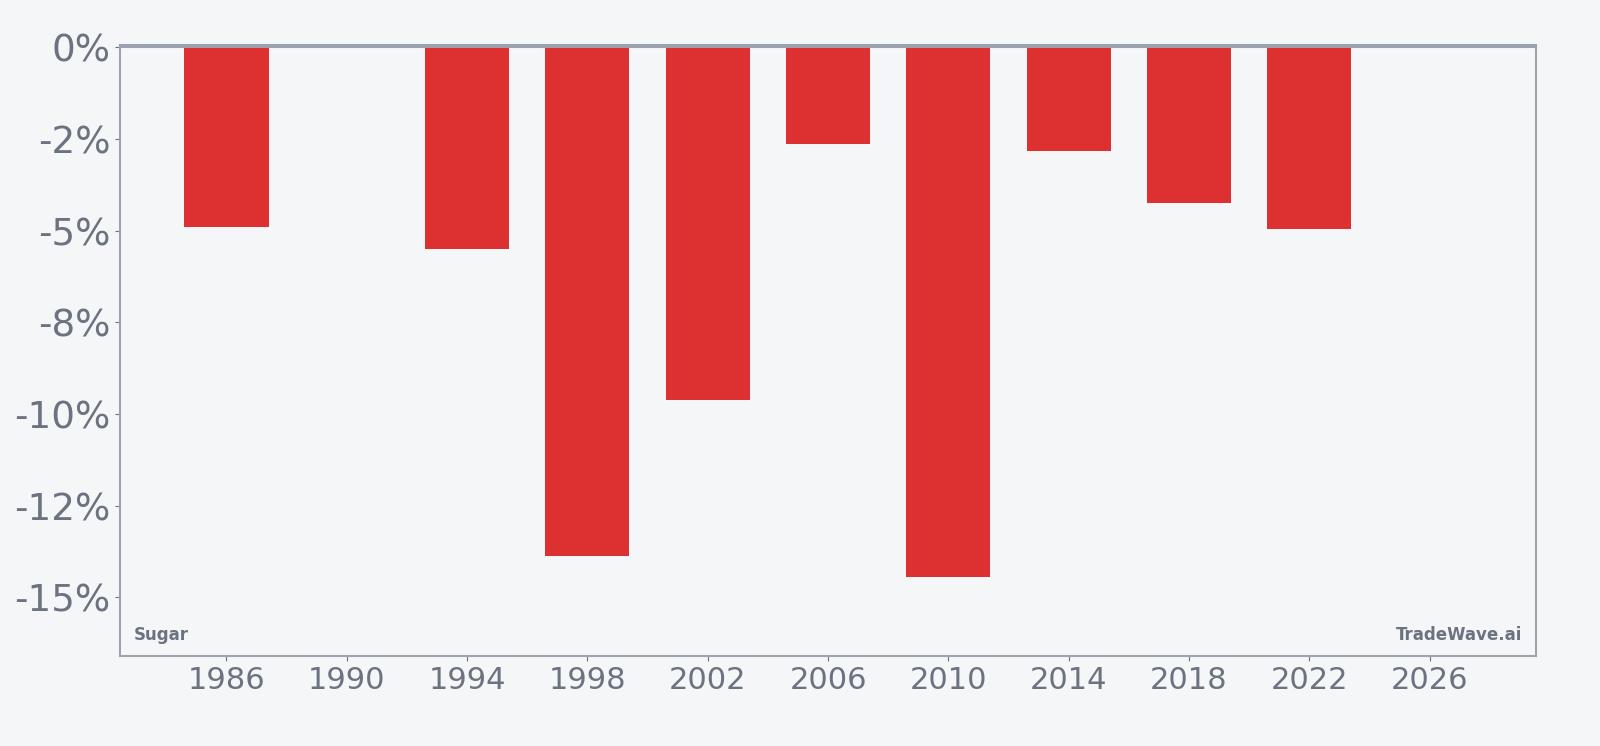
The historical seasonal trend line slopes steadily lower across most of the 37 days, with the bulk of the average decline accruing in the middle of the window rather than in a single sharp break. That suggests prior midterm years have often seen Sugar soften in stages, with rallies tending to fade rather than extend.
Year-by-year bars that combine net results with peak favorable and adverse moves show how often shorts have had to sit through squeezes before the pattern paid off.
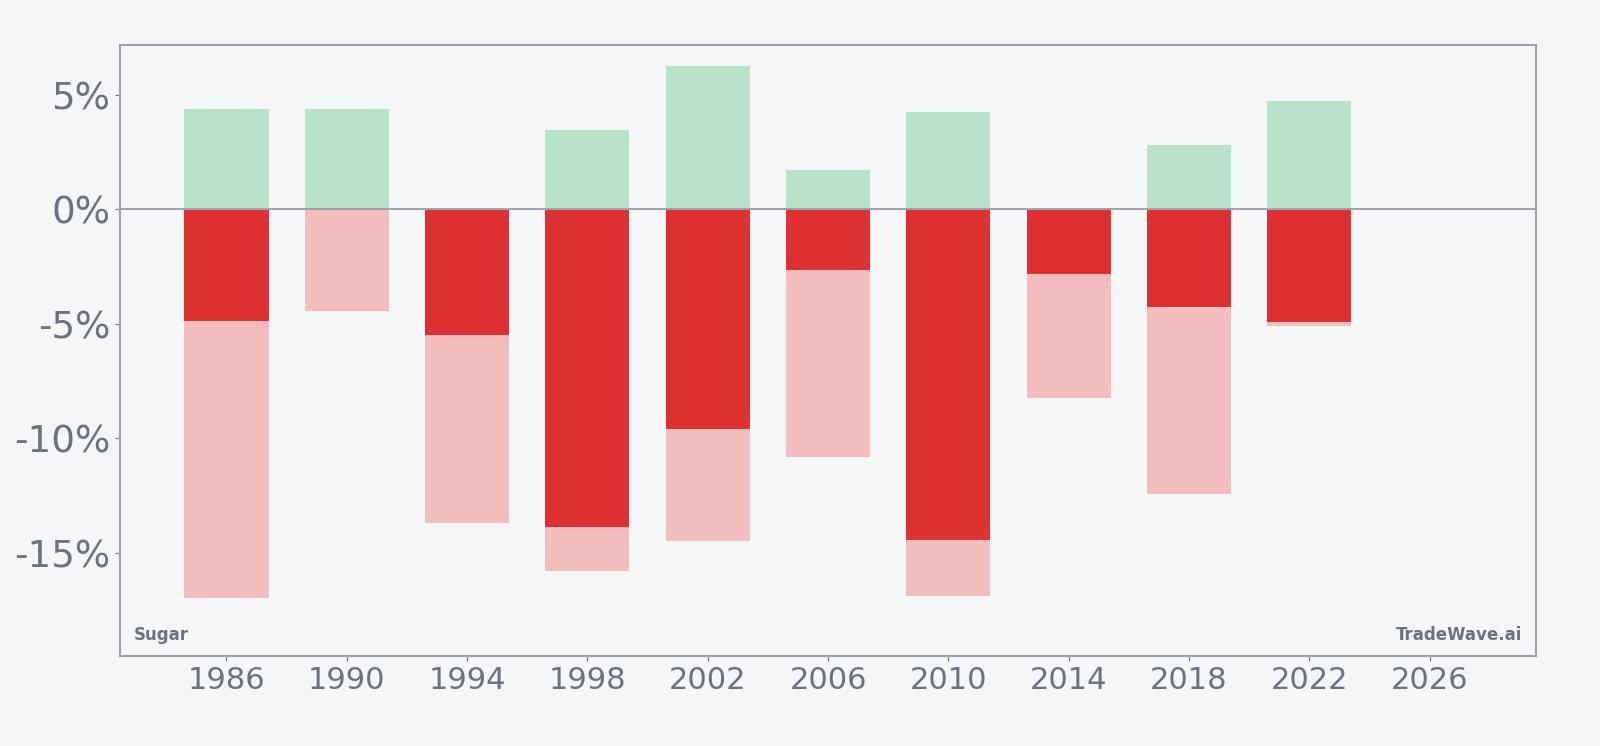
The stacked bars make the trade-off clear: in most years the maximum favorable move in the direction of the short has been meaningful, but the maximum adverse move has also been large, often in the high single digits or low double digits. For traders, that means the window has historically rewarded patience on the short side but punished tight stops and over-levered positions.
History does not guarantee future results; adverse excursions (MAE) can be large even in winning windows.
Price and near-term drivers
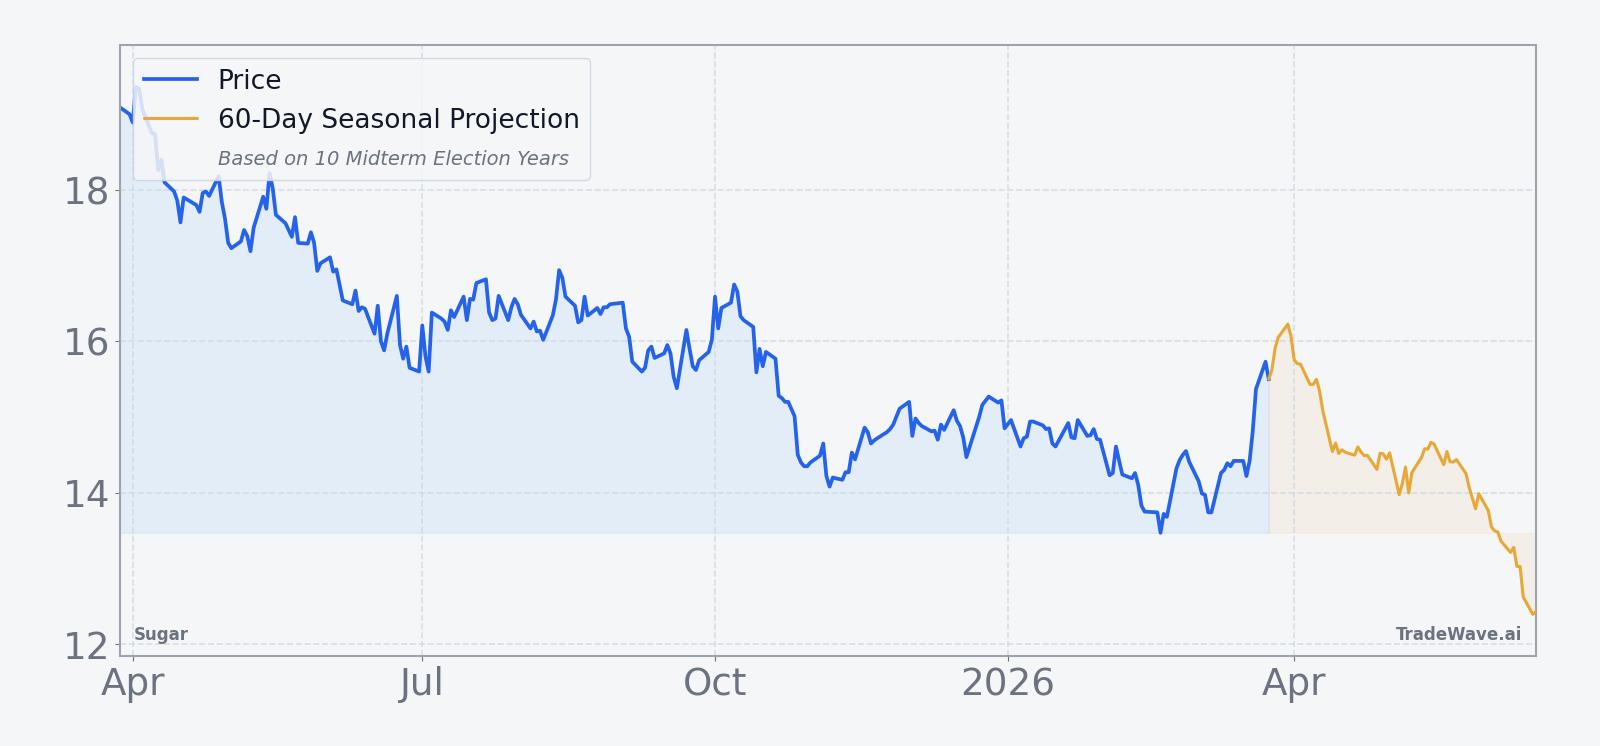
Sugar futures last settled at 15.53 on Mar 24, down 0.35 points or 2.2% on the day, after trading between 15.32 and 15.83 in a session that saw volume of 93,616 contracts. The contract is well off its 52-week high of 19.63 and sits above a 52-week low of 13.46, with a 20-day average volume of 82,106 contracts and a 50-day simple moving average at 14.45, which Sugar has been trading above.
That setup leaves Sugar in a kind of no-man’s land: not stretched at the highs where producers rush to hedge, but not at panic lows either. The recent one-month gain of 9.28% shows buyers have been in control into late March, even as the latest pullback hints at some fatigue. With no single macro or policy headline dominating the tape, positioning and technical levels are likely to drive the next leg.
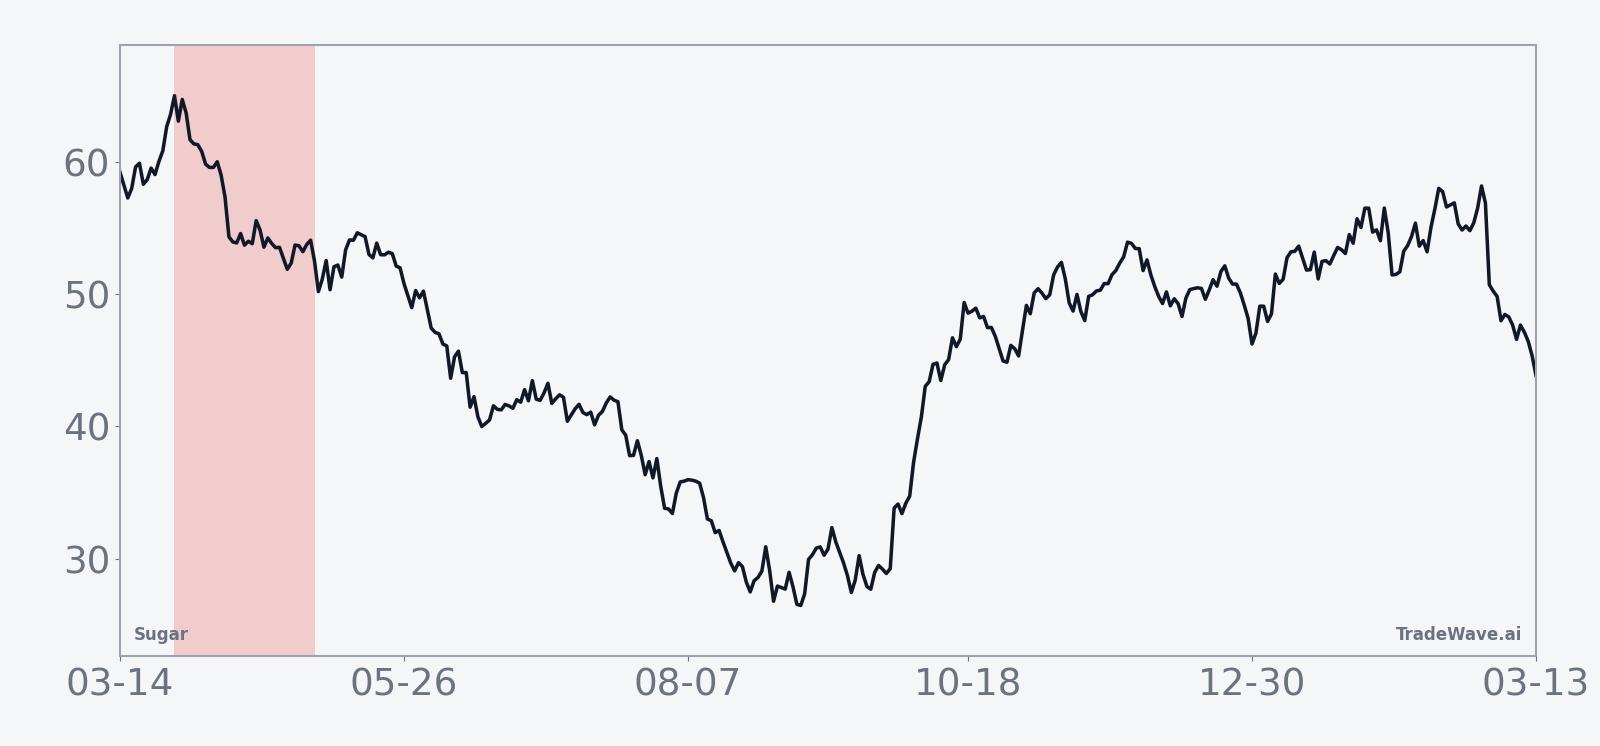
The chart below situates the latest move in its recent multi-month context and overlays a 60-day seasonal projection.
For refiners and food companies, this matters because Sugar is a key input cost. A historically weak window that lines up with a midterm election year can ease margin pressure if it repeats, but the same volatility that has defined past cycles means hedging strategies need room for squeezes. For macro traders, Sugar is not as systemically important as crude or copper, yet sharp moves can still ripple into emerging-market currencies and inflation expectations at the margin.
What to watch as the window opens
First, watch how Sugar behaves as the window kicks off around Mar 28. In prior midterm years, rallies early in the window have often faded into lower closes by day 37, so a fast push higher that stalls and reverses would be consistent with the historical pattern. A clean breakout that holds above recent highs would be the clearest sign this cycle is diverging from the past.
Second, the 15 level and the 50-day moving average near 14.45 are important reference points. A break back through the 50-day with expanding volume would fit the short-side seasonal bias, while a sustained hold above 16 with shrinking volatility would argue that the market is absorbing supply more easily than in prior midterm years.
Third, monitor intraday ranges and order-book depth. The historical record shows that even winning short windows have seen sharp countertrend spikes, so a pickup in daily ranges without clear direction would not be unusual. What would stand out is a stretch of tight, low-volatility sessions, which has been rare in this specific slice of the calendar.
Finally, keep an eye on the broader policy and macro backdrop as the midterm year unfolds. Shifts in trade policy, subsidy programs or biofuel mandates can all alter demand and supply expectations for Sugar, either reinforcing or overwhelming the seasonal tendency. If those catalysts line up with the historical window, the combination of policy surprise and a seasonally weak stretch could amplify moves in either direction.