Live Cattle (LE) Has Fallen in 10 of 10 Midterm Windows Starting Apr 14
Live Cattle is hovering just below record highs as it approaches a 47-day midterm-election seasonal window that has historically favored the short side.
What is the seasonal pattern for Live Cattle (LE)?
Live Cattle has fallen in 10 of 10 midterm-election-year windows starting around Apr 14, with an average 6.99% gain for short positions in winning years.
- 10 for 10 in this window, with short trades averaging 6.99% profit across the last 10 midterm election years.
- The upcoming 47-day Live Cattle trading window runs from Apr 14 through late May and has historically favored downside moves.
- Percent Profitable is 100%, with 10 winners and 0 losers for the short-side seasonal pattern.
- Average winner profit of 6.99% comes with a Sharpe ratio of 2.22, indicating unusually strong risk-adjusted returns for this window.
- The TradeWave Ratio of 2.46 suggests Live Cattle typically travels meaningfully in the trade direction within the window, even before final settlement.
- Individual years have seen adverse excursions as deep as roughly 18% against the short before finishing lower, underscoring intraperiod volatility.
According to historical data from TradeWave.ai, this midterm-election slice of the calendar has behaved very differently from an average spring for Live Cattle. The next section walks through how that pattern has played out and what it might mean for the coming 47 days.
How has Live Cattle (LE) traded in this midterm-year spring window?
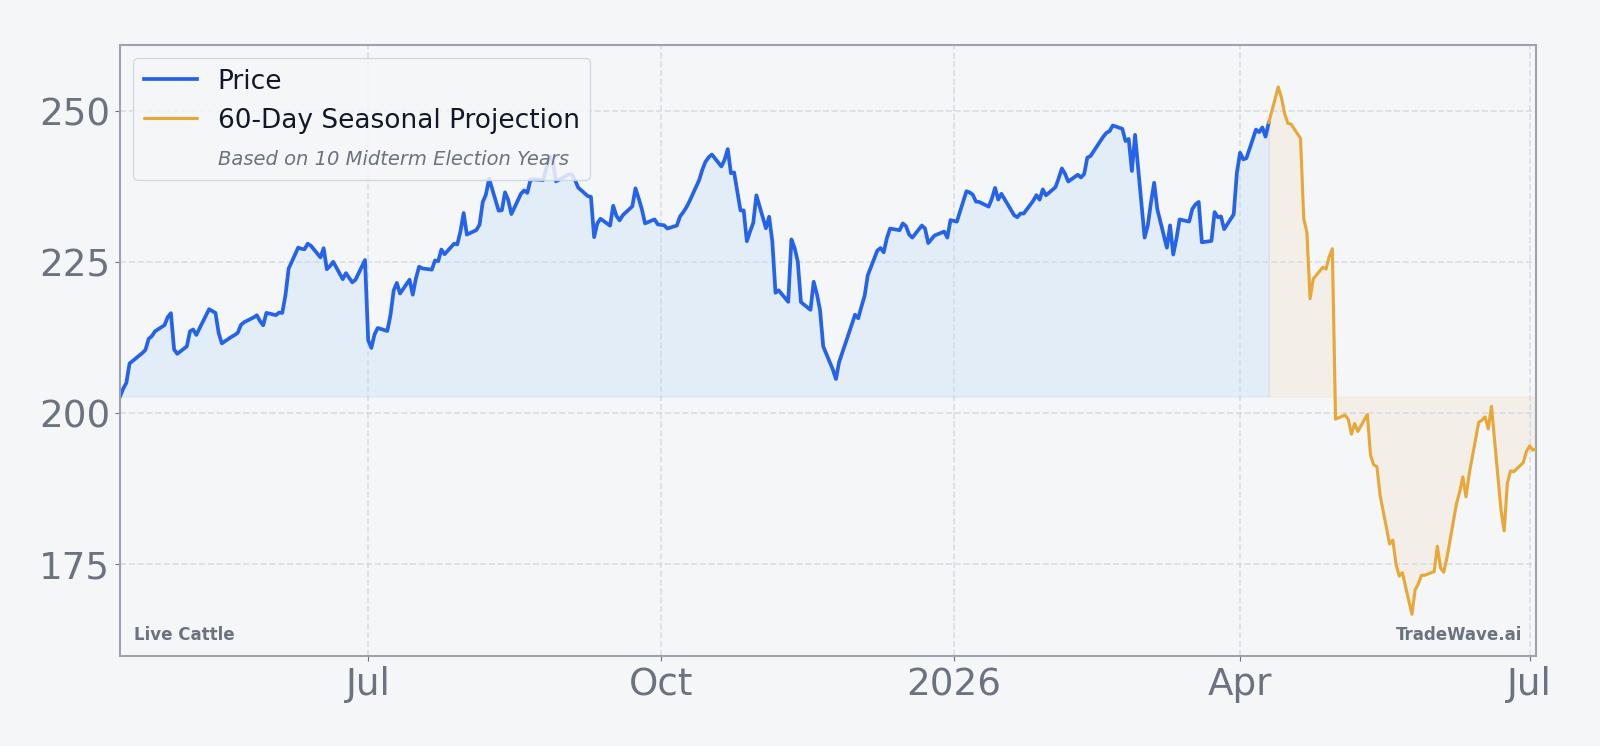
Live Cattle has dropped in every single midterm-election-year window starting around Apr 14 for the last 10 cycles, with short positions averaging 6.99% profit. The new 47-day window opens on Apr 14 with the front-month contract last trading at 249.075, just about 0.3% below its 52-week high of 249.95 and well above its 50-day moving average of 239.28. That combination of a stretched tape and a historically bearish seasonal window is why this particular stretch of the calendar matters for cattle traders.
Because this pattern is grouped by the presidential election cycle, it reflects how Live Cattle has behaved specifically in midterm election years rather than in a simple run of consecutive calendar years. That matters for a commodity tied to policy, trade and consumer prices, since midterm years often bring regulatory noise and positioning shifts that can ripple through the beef complex.

A second view layers yearly net results with peak favorable and adverse moves to show how far Live Cattle has tended to swing inside the window.
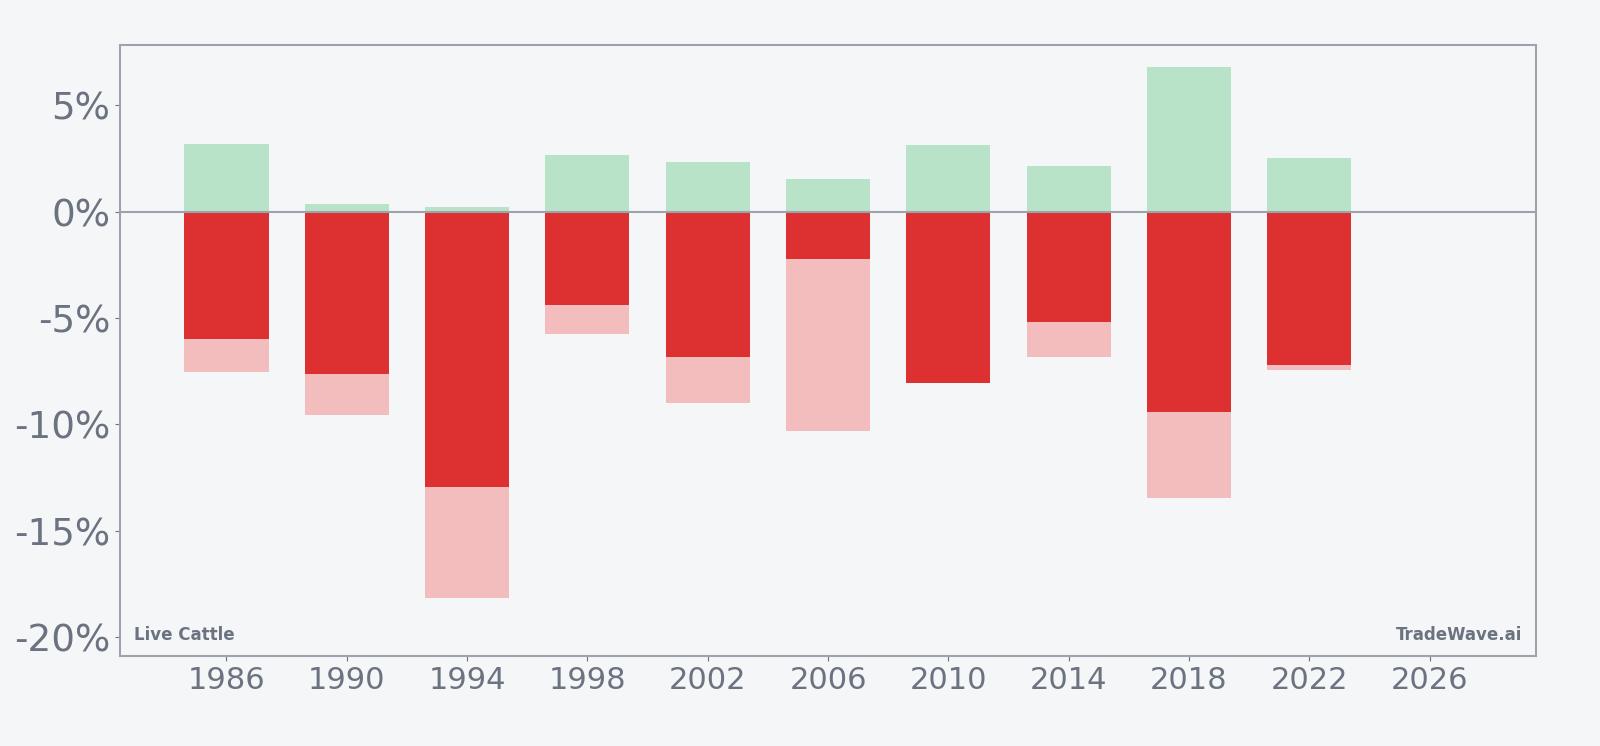
The trade direction for this pattern is short, and every one of the last 10 midterm-election-year windows has finished with Live Cattle lower over the 47-day span. Percent Profitable sits at 100%, with 10 winners and 0 losers, and the average profit across all years is 6.99%, which is also the average winner because there have been no losing years in this sample. That is an unusually clean record for any commodity seasonal pattern.
Individual years show a wide range of outcomes around that average. The strongest short-side year in this window was 1994, when Live Cattle fell 12.96% from entry to exit, while the softest was 2006, with a 2.23% decline. In several cycles, including 2018 and 1994, the contract experienced deep intraperiod drawdowns against the short, with maximum adverse moves of roughly 13% to 18% before ultimately rolling over.
The maximum favorable move, or best point-to-peak decline within the window, has often exceeded the final net result, which is typical for trending commodity moves. At the same time, the maximum adverse move, or worst drawdown from entry, has at times been large relative to the final profit, highlighting that even “perfect” historical windows have required traders to sit through meaningful squeezes. The TradeWave Ratio of 2.46 captures that Live Cattle typically travels a substantial distance in the trade direction during the window, independent of where it finally settles.
The cumulative return profile across the last 10 midterm election years shows a steady build of short-side gains rather than a pattern dominated by one or two outlier years. The seasonal trend chart suggests that, on average, Live Cattle has tended to weaken progressively through the middle of the window, with some choppiness early on and a tendency for the bulk of the decline to accrue before the final week.
Put together, the message is blunt: in the last 10 midterm election years, this 47-day spring window has been a clean sweep for short positions in Live Cattle, with consistent though sometimes volatile downside follow-through.
Why does Live Cattle (LE) follow this seasonal pattern?
This midterm-year spring pattern for Live Cattle may reflect a mix of commodity supply and demand seasonality and the policy calendar. One likely driver is the transition from winter feeding to pasture, when weight gains and slaughter schedules can shift, affecting near-term beef supply and pricing. Analysts also point to midyear policy debates around food prices and trade that often cluster in midterm election years, which can influence hedging behavior across packers, feedlots and end users.
History does not guarantee future results, and even in a window with a perfect track record, adverse excursions within the period can be large relative to the final outcome.
What is driving Live Cattle (LE) today?
Live Cattle futures settled at 249.075 on Apr 13, down 0.28% on the day, after trading between 247.15 and 249.95 on volume of 24,494 contracts. The contract sits just under its 52-week high of 249.95 and roughly 4.1% above its 50-day moving average of 239.28, with one-month returns of 7.87% and 20-day average volume near 21,101 contracts, a backdrop that underscores how extended the tape is heading into the seasonal window.
The chart below shows that run-up alongside a 60-day seasonal projection for context.
In Nov 2025, Live Cattle prices were reported to be about 15% off record highs as beef market pressures built, even though the broader cattle cycle had not fully turned.[1] That episode showed how quickly sentiment can swing when wholesale beef prices, restaurant margins and consumer demand collide, and it remains a useful reference point as the contract again trades near the top of its range.
Policy remains a wild card. In Nov 2025, proposals from President Trump aimed at lowering beef prices raised the prospect of regulatory or trade actions that could indirectly affect cattle futures, even if the timing and implementation were uncertain.[1] For a market already sensitive to feed costs, export flows and packer capacity, any renewed push on food inflation in a midterm election year could intersect with the historical seasonality in unexpected ways.
What should traders watch in this Live Cattle seasonal window?
The first marker is price behavior as the window opens on Apr 14. In prior midterm election years, Live Cattle has often chopped early before leaning lower, so traders will be watching whether the contract can hold above the recent 249.95 high or instead starts to slip back toward the 240 area that roughly aligns with the 50-day moving average.
Second, watch how intraday swings compare with the historical pattern of large maximum adverse moves. Years like 1994 and 2018 saw sharp squeezes against the short before the decline resumed, so a spike higher inside the window would not automatically invalidate the seasonal tendency. What would contradict the pattern is a sustained breakout to new highs that holds through late May, something that has not occurred in the last 10 midterm election years.
Third, keep an eye on the policy and macro backdrop around beef prices. Any renewed push from Washington to address food inflation, or headlines around restaurant and grocery margins tied to beef costs, could influence hedging flows and volatility in Live Cattle, much as they did when prices retreated from records in late 2025.[1] If those catalysts line up with the historical seasonal window, the resulting moves could be larger and faster than a typical spring pullback.
Finally, for traders who track seasonality closely, the key tell will be whether Live Cattle respects the historical pattern of rolling over from near highs in this midterm-year window or instead breaks the 10-for-10 streak. A clean downside move that develops in the first half of the window would fit the long-run LE seasonal trend, while a grind higher with shallow pullbacks would signal that the election-cycle dynamics around this particular stretch of the calendar may be changing.
Sources
About this seasonal analysis
Seasonal pattern data is sourced from TradeWave.ai, which analyzes historical price behavior across annual calendar windows going back up to 30 years. Read the full data methodology or the book The 100-Year Pattern by Afshin Moshrefi (2026 edition). Past performance of seasonal patterns does not guarantee future results. This article is for informational purposes only and does not constitute investment advice.