Lean Hogs (HE) Has Rallied in 9 of 10 Midterm April Windows, Averaging 16% Gains
Lean Hogs is stepping into a short midterm-election-year seasonal window that has been strongly bullish in past cycles, just as prices trade in the upper half of the recent range.
What is the seasonal pattern for Lean Hogs (HE)?
Lean Hogs has risen in 9 of 10 midterm-election-year windows starting Apr 8, with an average gain of 16.19% in winning years.
- 9 for 10 in this 15-day window, with winning years averaging 16.19% gains and only one losing year in the sample.
- Percent Profitable sits at 90%, with 9 winners and 1 loser across the last 10 midterm election years.
- Including down years, Avg Profit - All is still a hefty 14%, pointing to a strong bullish seasonal bias.
- The single losing year saw a modest -1.84% decline, far smaller than the best up years that topped 20% and even 28.54%.
- A TradeWave Ratio of 1.69 and a Sharpe ratio of 1.56 signal historically strong upside moves relative to volatility in this Lean Hogs trading window.
- Intraperiod swings have been meaningful, with some years showing several percentage points of adverse movement before finishing higher.
According to historical data from TradeWave.ai, this early-April stretch in midterm election years has behaved very differently from an average month on the Lean Hogs calendar, and the next 15 days will test whether that pattern still holds.
How has Lean Hogs (HE) traded in this midterm-year April window?
Lean Hogs has rallied in 9 of the last 10 midterm-election-year windows that begin on Apr 8 and run for 15 trading days, with winning years averaging 16.19% gains. The new window opens today with futures recently closing at 90.78 cents per pound, leaving the contract well below the 52-week high of 113.70 but comfortably above the 77.35 low.[1] For a contract that can swing hard on supply shocks and demand headlines, that combination of a bullish historical seasonality and mid-range price location gives this slice of April outsized tactical importance.
Because this pattern is grouped by the presidential election cycle, it only looks at midterm election years, not every calendar year. That matters for commodities like Lean Hogs, where policy, trade rules and biosecurity funding can shift meaningfully in the middle of a presidential term as Congress revisits farm bills and budget priorities.
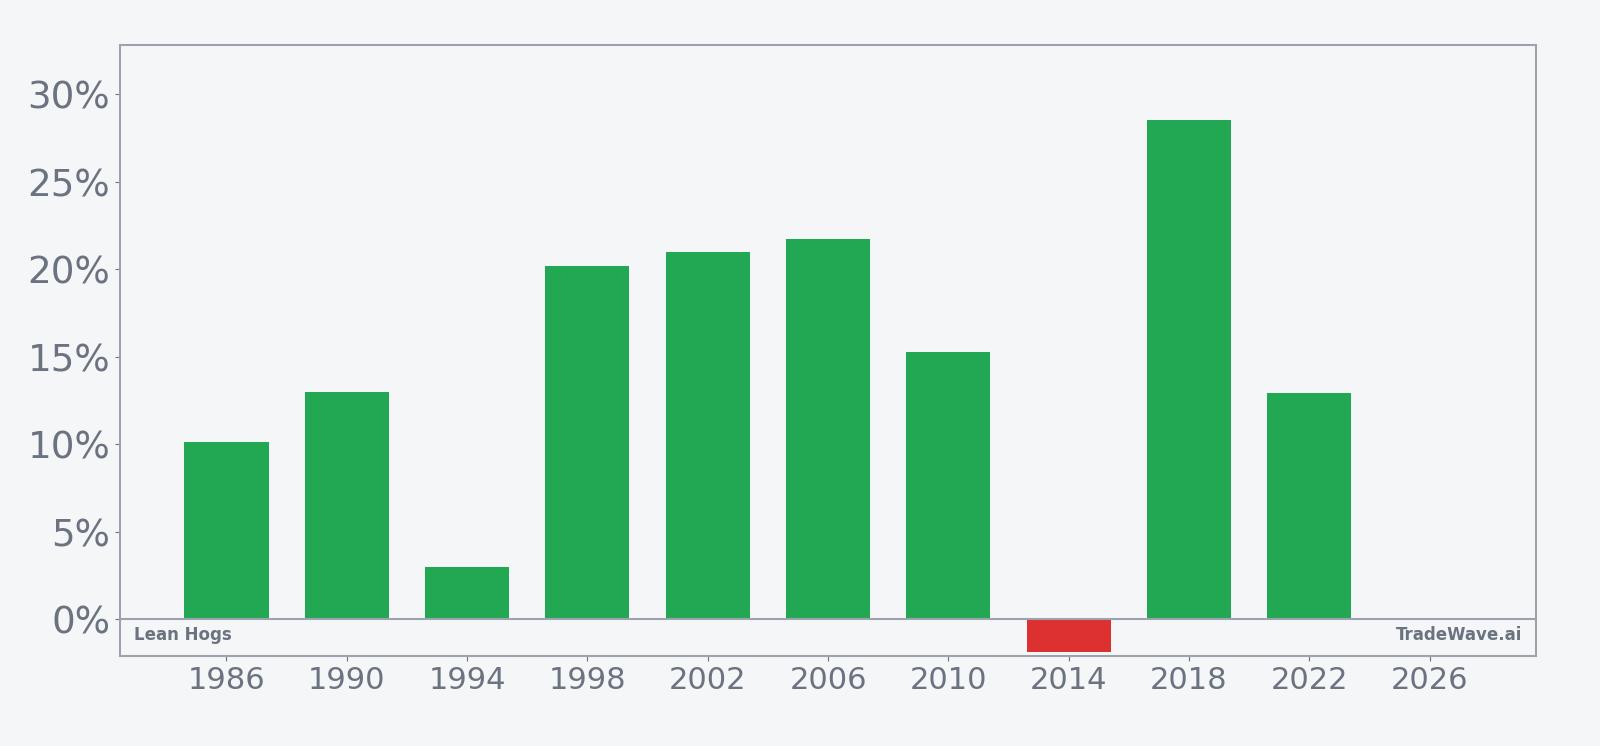
The trade direction for this window is long, and the historical record backs that up. Across the last 10 midterm election years, Lean Hogs posted gains in 1986, 1990, 1994, 1998, 2002, 2006, 2010, 2018 and 2022, with only 2014 finishing slightly lower. The strongest year in the sample was 2018, when the contract surged 28.54% over the 15 trading days, while the weakest was 2014 with a -1.84% decline.
Average winner performance of 16.19% is far larger than the average loss, which helps keep the all-years average at 14% even after including the down year. That skew is visible in the per-year table: several cycles delivered 20% plus moves, including 1998 at 20.19%, 2002 at 20.96% and 2006 at 21.74%. For a 15-day Lean Hogs trading window, those are big moves in a short span.
Intraperiod behavior has also been favorable for longs. Maximum favorable excursions, the best point-to-peak rallies within the window, reached 33.74% in 2018 and stayed above 20% in 1998, 2002 and 2006. Even in more modest years like 2010, the best run-up still hit 16.19%, roughly matching the final net gain.
On the downside, maximum adverse excursions, the worst drawdowns from entry during the window, have generally been contained but not trivial. The deepest intraperiod dip came in 2002 at -7.16%, while several other years saw only shallow pullbacks of around -1% or less before recovering. The lone losing year, 2014, recorded a -3.08% worst drawdown and never fully bounced back.
The historical seasonal trend chart for this window slopes higher in a fairly consistent way, with much of the average gain accruing after the first few sessions. That suggests prior midterm years often saw Lean Hogs firm up early in the window and then accelerate higher into the back half.
A combined view of net returns, best rallies and worst drawdowns by year shows how often upside has outweighed downside in this pattern.
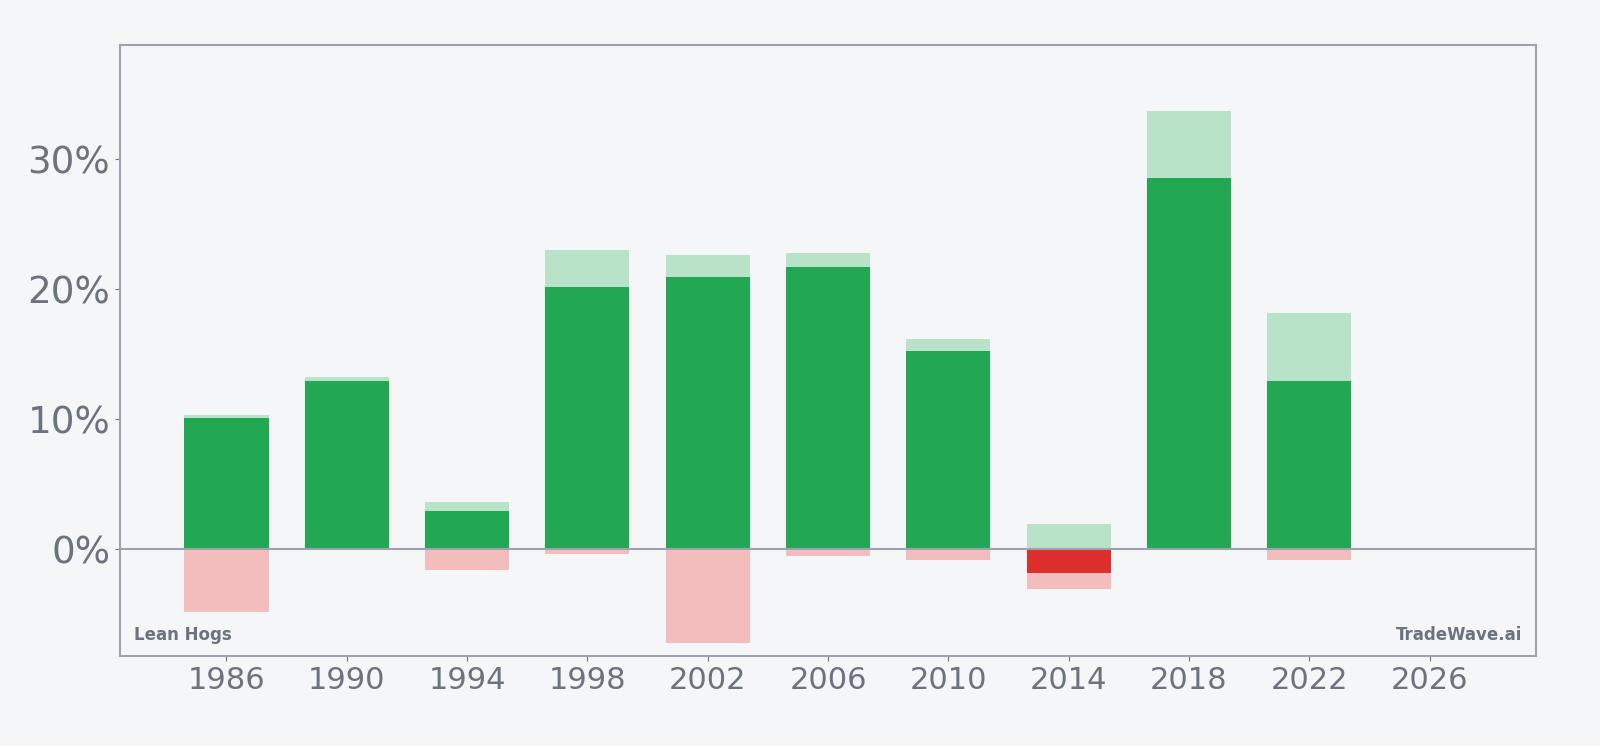
The stacked net, maximum favorable and maximum adverse bars underline the point: in most years, the best intraperiod rally has been several times larger than the worst drawdown, and only one cycle finished in the red. Add it up: 272% cumulative return across the 10 midterm-year windows, with a Sharpe ratio of 1.56 that is high for a short-dated commodity pattern.
History does not guarantee future results; adverse excursions can still be sizable in this window, and even strong seasonal patterns can fail in any given year.
Why does Lean Hogs (HE) follow this seasonal pattern?
This midterm-year April pattern for Lean Hogs likely reflects commodity supply and demand seasonality more than politics. One likely driver is the transition from winter hog weights and disease risk into the spring grilling season, when packers and retailers start positioning for higher summer demand. Analysts also point to how midterm-year policy debates around farm support, trade and biosecurity can cluster in the spring, nudging hedging flows and speculative positioning in ways that repeat across cycles.
What is driving Lean Hogs (HE) today?
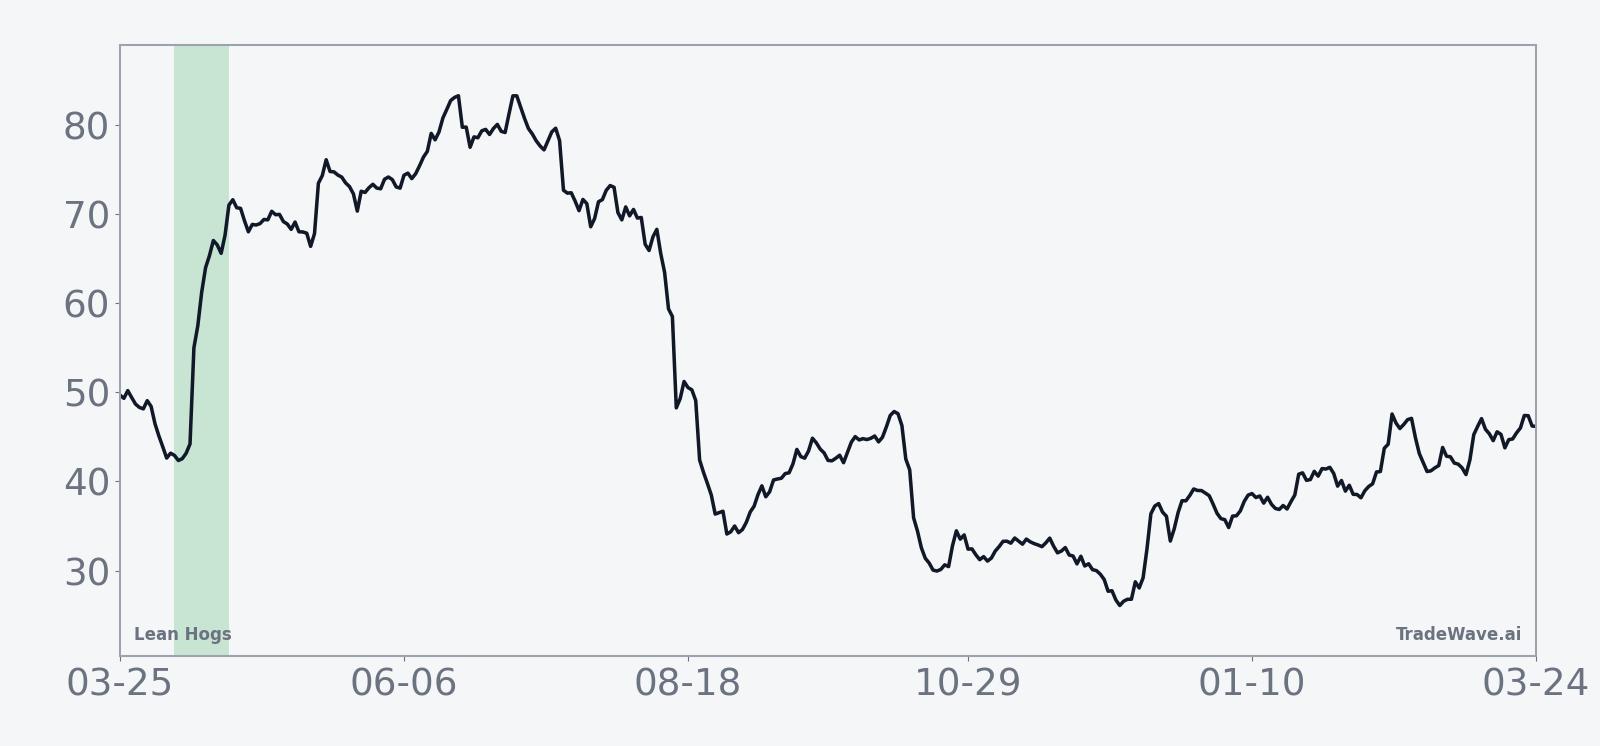
Lean Hogs futures settled most recently at 90.78 cents per pound, up 12.92% over the past month and trading between a 52-week low of 77.35 and a high of 113.70 as the new seasonal window opens.[1] That puts the contract in the upper half of its 12-month range but still well below last year’s peak, a setup that leaves room for a seasonal push without feeling stretched on the chart.
The chart below situates the latest move in its recent multi-month context alongside a 60-day seasonal projection.
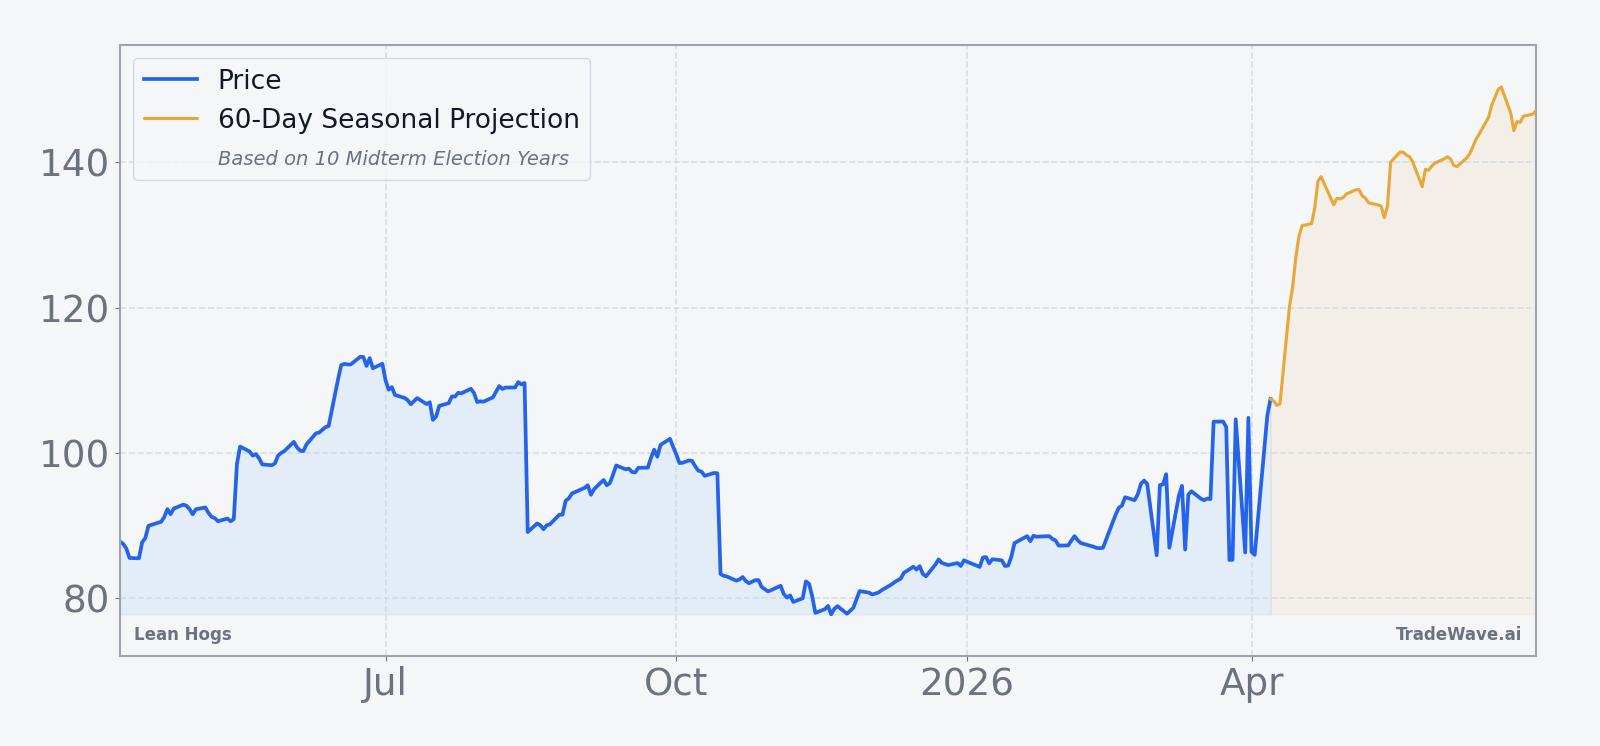
Fundamental drivers for Lean Hogs in early April typically include packer margins, export demand and any fresh headlines on herd health or feed costs. With no single dominant macro or policy catalyst flagged in the latest research set, the focus for many traders will be whether this historically strong seasonal window can extend the recent upswing or whether supply surprises and demand softness interrupt the pattern.
What should traders watch in this Lean Hogs seasonal window?
For the next 15 trading days, the key test is whether Lean Hogs behaves anything like its midterm-year playbook. Historically, the contract has tended to firm in the first few sessions of this window and then build momentum, so traders will be watching for early follow-through above recent closes rather than a quick fade.
On the chart, the 52-week high at 113.70 is the obvious upside reference, while the 77.35 low and the prior month’s breakout zone mark the downside band.[1] A push toward the upper end of that range would be consistent with the historical seasonality, especially if intraday dips stay shallower than the worst drawdowns seen in past cycles.
Fundamentally, watch weekly slaughter and carcass weight data, export sales and any fresh headlines on disease or trade restrictions that could jolt demand. A string of strong demand prints during this window would rhyme with prior midterm years that saw double-digit percentage gains, while weak packer margins or softer exports could be the kind of shock that produced the lone losing year in 2014.
Finally, volatility itself is a tell. In prior cycles, maximum favorable excursions have often been much larger than maximum adverse moves, but the worst drawdowns still reached several percentage points in some years. If this window starts with deep intraday or multi-day selloffs that fail to reverse, that would be an early sign that 2026 may diverge from the usual HE seasonal trend. If instead pullbacks stay contained and rallies build, the historical pattern argues that this short midterm-year stretch can matter more than most for Lean Hogs bulls.
Sources
About this seasonal analysis
Seasonal pattern data is sourced from TradeWave.ai, which analyzes historical price behavior across annual calendar windows going back up to 30 years. Read the full data methodology or the book The 100-Year Pattern by Afshin Moshrefi (2026 edition). Past performance of seasonal patterns does not guarantee future results. This article is for informational purposes only and does not constitute investment advice.