Strait of Hormuz Risk Meets Historically Weak Midterm Stretch for Crude Oil (CL)
Crude Oil is backing off recent highs just as a historically bearish midterm-election seasonal window, lasting more than six months, comes back into view for futures traders.

What is the seasonal pattern for Crude Oil (CL)?
Crude Oil has fallen in 7 of 8 midterm-year windows starting around late April, with an average 14.75% gain in winning short trades.
- 7 wins and 1 loss for short trades in this window, with winning years averaging 14.75% moves in the trade direction.
- The upcoming Crude Oil trading window starts on Apr 30, 2026 and runs for 198 trading days across the last 8 midterm election years.
- Percent Profitable sits at 88%, with 7 winners and 1 loser across the historical sample.
- Avg Profit in winning years is 14.75%, while Avg Profit - All, including the lone losing year, is still a strong 13%.
- Maximum favorable moves have often exceeded 20%, but adverse excursions have reached roughly 26% in some years, underscoring sizable intraperiod swings.
- Sharpe ratio of 1.09 and a TradeWave Ratio of 2.23 point to a historically efficient short-side seasonal trend, albeit with meaningful drawdown risk.
According to historical data from TradeWave.ai, this midterm-year stretch in Crude Oil has behaved very differently from an average calendar period, with a clear short-side bias that traders rarely discuss.
How has Crude Oil (CL) traded in past midterm-year seasonal windows?
Crude Oil has delivered profitable short trades in 7 of the last 8 midterm-election windows that begin around Apr 30 and run for 198 trading days, with average gains of 14.75% in winning years. Futures are trading at $88.82 on Apr 22, down 3.6% on the day and about 25.7% below the 52-week high of $119.48.[2] That puts the market on the back foot just as a historically weak seasonal stretch for prices comes into view.
Because this pattern is grouped by the presidential election cycle, it captures how midterm-year policy uncertainty, shifting supply expectations and demand worries have tended to cluster in the same part of the calendar. Pattern phase equals the midterm election year, and the calendar is also in the early part of that midterm year, so the upcoming window reflects how Crude Oil has behaved in similar macro and policy backdrops rather than in consecutive calendar years.
The trade direction for this pattern is short, which means negative returns for Crude Oil prices have historically been the “good” outcomes for the strategy. Across the last eight midterm election years, 88% of these windows ended with lower prices, producing 7 winners and just 1 losing short. Average profit in those winning years is 14.75%, while the all-years average, which includes the single losing outcome, still comes in at 13%.
Avg Profit reflects winners only, while Avg Profit - All includes every year in the sample. That gap between 14.75% and 13% is relatively small, which tells you the lone losing year did not fully erase the gains from the stronger cycles. The median profit of 14.74% is almost identical to the average, suggesting the distribution of outcomes has been fairly tight around that mid-teens move in the trade direction.
Intraperiod swings have been large. In the strongest year in this sample, 2014, a short entry around $99.74 ultimately captured a 25.6% decline by the end of the window, with the best point-to-trough move, or maximum favorable excursion, reaching 8.01% before the final close.[6] On the other side, the weakest outcome for shorts came in 1998, when Crude Oil rallied enough to leave a 11.83% loss for the pattern, and the worst drawdown from entry, or maximum adverse excursion, stretched to 25.93%.
Those maximum favorable and maximum adverse excursions, often abbreviated as MFE and MAE, describe the best and worst intraperiod moves from the entry price. Several years in this window show MAE readings near or above 20%, including 2010 at -25.43% and 2022 at -26.8%, which means even ultimately successful shorts had to sit through deep rallies before the trend turned back down.[7] That is consistent with a commodity that can squeeze higher on supply scares before demand and macro forces reassert themselves.
The TradeWave Ratio (TWR) for this pattern is 2.23, which measures how far price typically travels in the trade direction within the window, independent of the final close. Combined with a Sharpe ratio of 1.09 based on end-of-window outcomes, the statistics point to a window that has historically rewarded short exposure with relatively strong risk-adjusted returns, even after accounting for volatility.
Trend metrics inside the window show that short-side pressure has not been a straight line. The “Trend Short” count of 22 versus “Trend Long” at 38 suggests that while the final outcomes favored shorts, there were many stretches where prices pushed higher before rolling over. The one losing year for shorts, 1998, featured a modest maximum favorable move of 6.3% before the market turned and squeezed higher into the close.
On a cumulative basis, stacking these midterm-year windows together produces a 153% total return for the short strategy across the sample. Annualized, that works out to 12.32%, which is notable for a single, recurring slice of the calendar rather than a full-year exposure. Add it up: eight midterm cycles, seven profitable short windows, and triple-digit cumulative gains for traders who were positioned for seasonal weakness.
A second view shows how each year’s best and worst intraperiod swings stack up against the final net result.
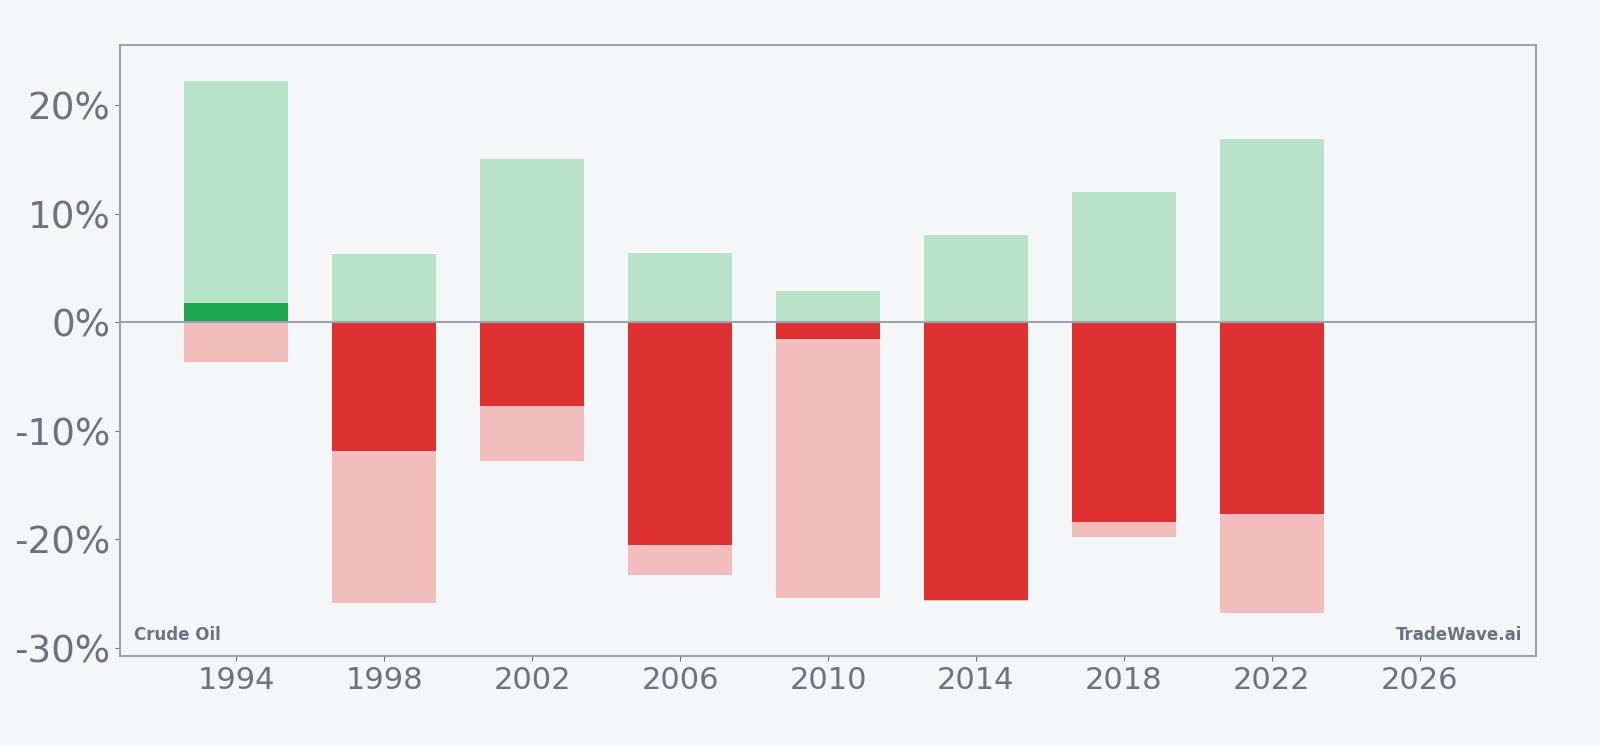
History does not guarantee future results; adverse excursions can be large even in winning windows, and Crude Oil’s intraperiod rallies have repeatedly tested short sellers’ risk limits.
Why does Crude Oil (CL) follow this seasonal pattern?
One likely driver is the way midterm election years concentrate policy uncertainty around sanctions, defense spending and strategic reserves, which can weigh on demand expectations even as supply headlines stay noisy.[2] Analysts have also pointed to refinery maintenance schedules and shoulder-season demand lulls that often fall inside this window, leaving prices vulnerable when growth jitters flare.[6] The pattern may also reflect institutional hedging and risk reduction as energy producers and consumers lock in margins ahead of year-end, amplifying downside pressure when macro news turns negative.
What is driving Crude Oil (CL) today?
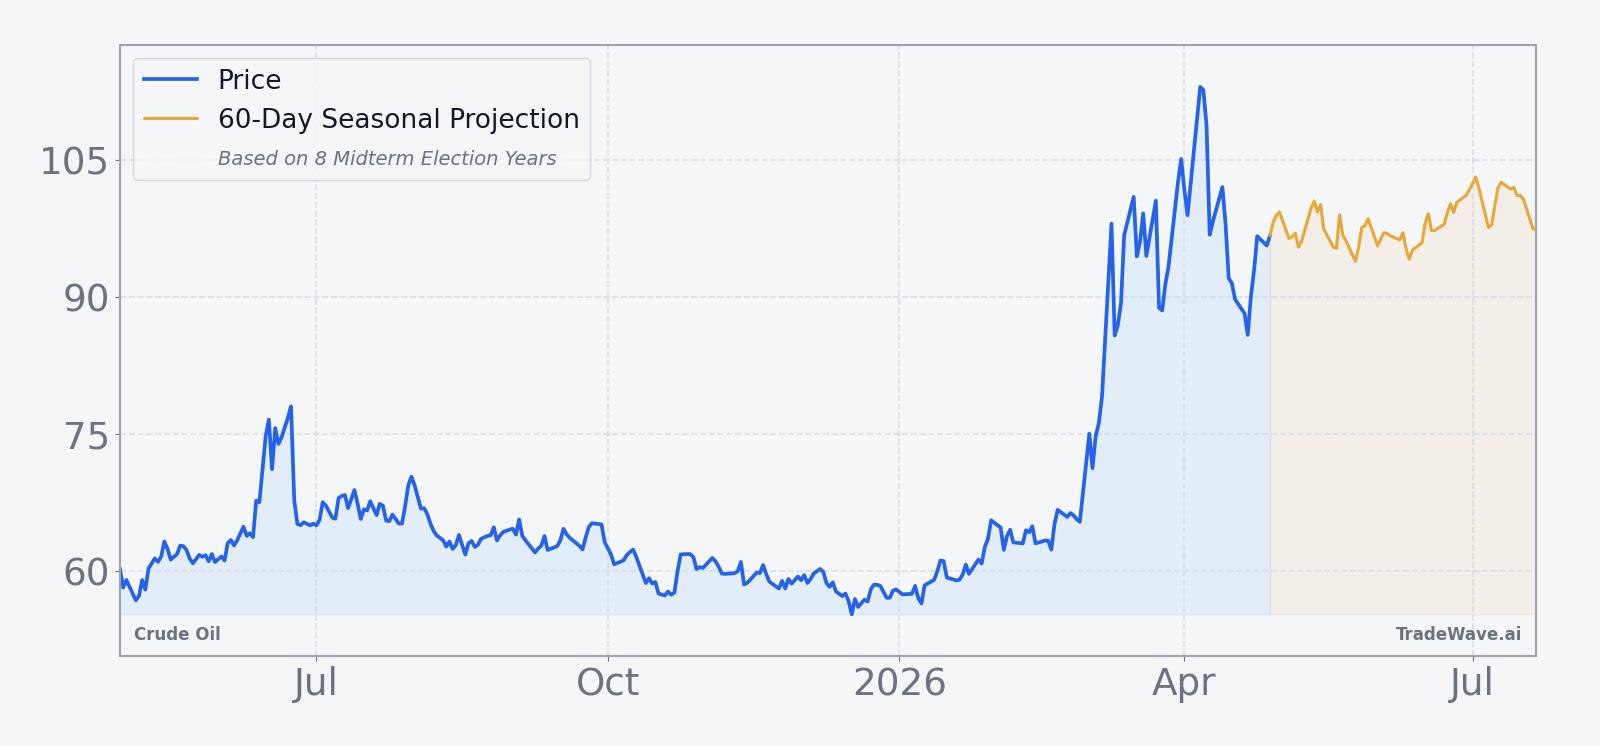
Crude Oil futures settled at $88.82, down 3.6% on the session, as traders weighed fresh Middle East headlines against signs of ample supply and a market that has looked range-bound for months.[2] The contract is about 25.7% below its 52-week high of $119.48 and still comfortably above the 52-week low of $54.98, with prices oscillating in a broad band as geopolitical risk and supply-demand imbalances pull in opposite directions.[2] Recent commentary has highlighted how U.S. troop deployments and tensions around key shipping lanes have supported Brent and WTI at times, even as concerns about oversupply and capped demand keep rallies in check.[1]
In Mar 2026, Brent crude logged a fifth straight weekly gain as additional U.S. forces moved into the Middle East, underscoring how quickly risk premia can rebuild when traders fear disruptions to flows.[2] Earlier coverage in 2025 described Crude Oil as stuck in a range while markets waited for clearer signals on growth, OPEC policy and the trajectory of peace efforts in Eastern Europe.[9] Those older pieces framed a market where every geopolitical flare-up met a wall of supply and cautious demand, a backdrop that still resonates with today’s push-pull between conflict risk and talk of oversupply.[4]
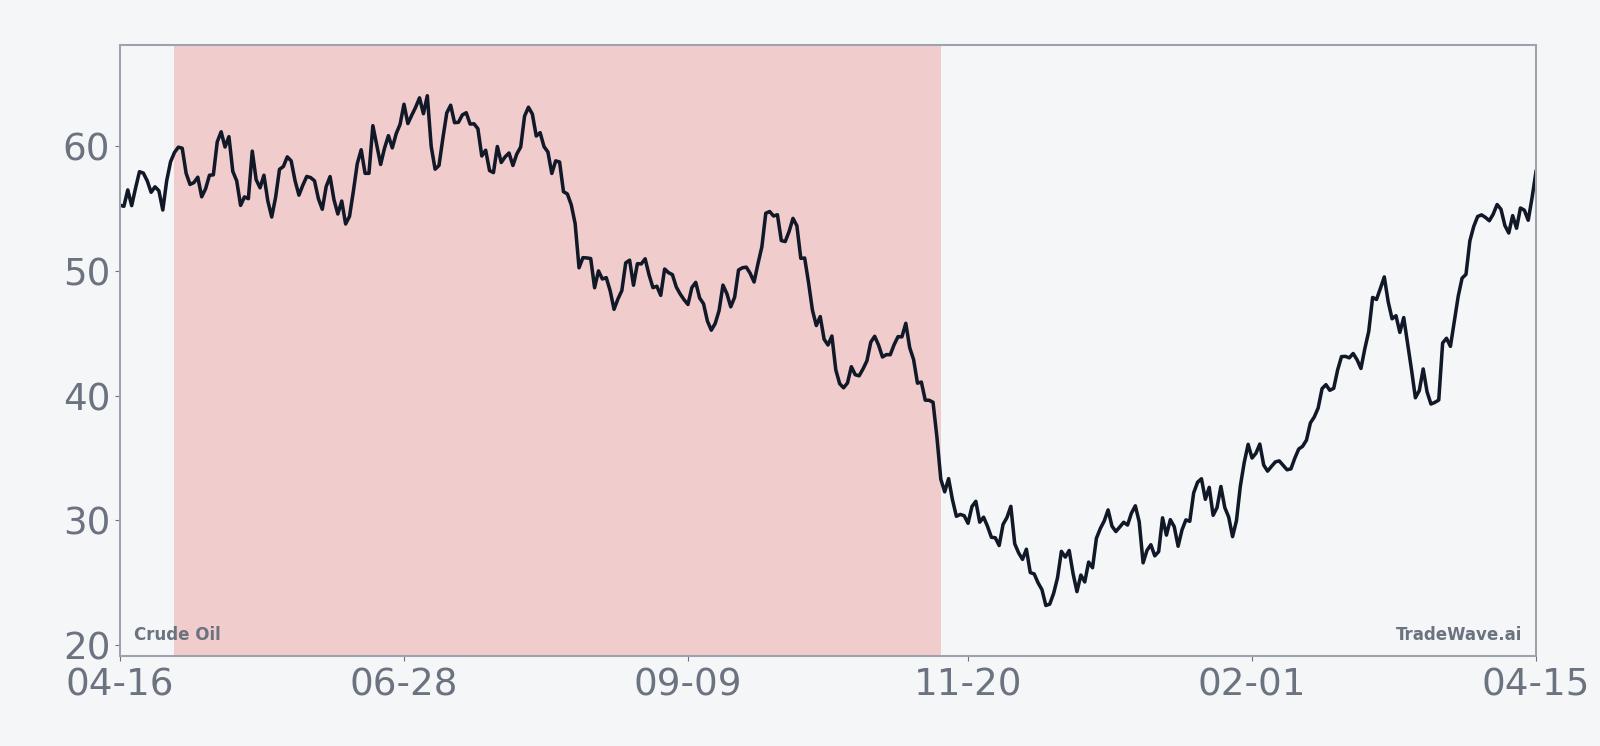
The chart below situates the latest pullback against the past year’s trading range and a short-term seasonal projection.
What should traders watch as this seasonal window approaches?
First, the calendar. The midterm-year seasonal window for Crude Oil begins on Apr 30 and runs deep into the year, so price action in the final days of April will shape how stretched or compressed the setup looks going in. A market that is already rolling over into the window would rhyme with prior midterm cycles where short trades worked best after failed rallies.
Second, the policy and geopolitical calendar. Any escalation that threatens the Strait of Hormuz or other key chokepoints could overwhelm the historical pattern in the short term, especially if traders start to price scenarios where crude spikes toward triple digits again.[1] Conversely, credible progress on peace efforts or signs of a durable supply glut would align more closely with the historical tendency for prices to soften over this stretch.[7]
Third, the behavior inside the window itself. If Crude Oil rallies sharply early in the period and then stalls, that would echo several past years where shorts endured painful squeezes before the broader downtrend reasserted itself. A clean break lower without major countertrend spikes would still fit the bearish seasonal script, but with less of the whipsaw that has characterized some of the biggest historical winners.
Finally, traders should monitor whether the market remains range-bound or starts to trend more decisively as the window matures. A sustained move below recent support levels during the midterm-year stretch would be consistent with the 7-for-8 record for short trades, while a decisive breakout above the upper end of the range would look more like the rare losing year in this pattern.[9] Either way, the combination of a statistically strong seasonal bias and a geopolitically charged macro backdrop means this is a window where Crude Oil’s moves can develop quickly and spill over into broader risk sentiment.
Sources
- Seeking Alpha, "Brent crude climbs for fifth straight week as U.S. sends more troops to Middle East," Mar 20, 2026.
- The Wall Street Journal, "Oil Steady as Supply Glut Offsets Gulf Tensions," Jan 2, 2026.
- Forbes, "Crude Oil’s Seasonal And Technical Outlook," Jul 24, 2025.
- The Wall Street Journal, "Russia-Ukraine Peace Efforts Keep Crude in the Red," Nov 24, 2025.
- The Wall Street Journal, "Crude Oil Appears Range-Bound Until Clearer Signals Emerge," Aug 14, 2025.
About this seasonal analysis
Seasonal pattern data is sourced from TradeWave.ai, which analyzes historical price behavior across annual calendar windows going back up to 30 years. Read the full data methodology or the book The 100-Year Pattern by Afshin Moshrefi (2026 edition). Past performance of seasonal patterns does not guarantee future results. This article is for informational purposes only and does not constitute investment advice.