Storage Surplus Weighs on Natural Gas (CME) (NG) Ahead of Historically Bearish May-Summer Stretch
Natural Gas (CME) is heading toward a mid-May seasonal window that has rewarded shorts in every midterm election year on record, even as prices sit near the bottom of the recent range.

What is the seasonal pattern for Natural Gas (CME) (NG)?
Natural Gas (CME) has fallen in 8 of 8 midterm election-year windows starting around May 17, with an average 9.11% gain for short positions in winning years.
- 8 for 8 in this window, with short trades averaging 9.11% profit in winning years across the last eight midterm election cycles.
- The upcoming Natural Gas (CME) trading window starts on May 17 and runs for 113 trading days, covering much of the late spring and summer shoulder season.
- Percent Profitable is 100%, with 8 winners and 0 losers for the short-side pattern in this midterm-year slice.
- The TradeWave Ratio (TWR) of 2.12 signals that price has typically traveled meaningfully in the trade direction within the window, even beyond the final close.
- A Sharpe ratio of 1.32 for this pattern points to historically strong risk-adjusted returns for shorts, though individual years have seen sharp rallies along the way.
- Maximum adverse excursions in some years have topped 25%, showing that even a historically reliable bearish seasonal window can involve painful squeezes before resolving lower.
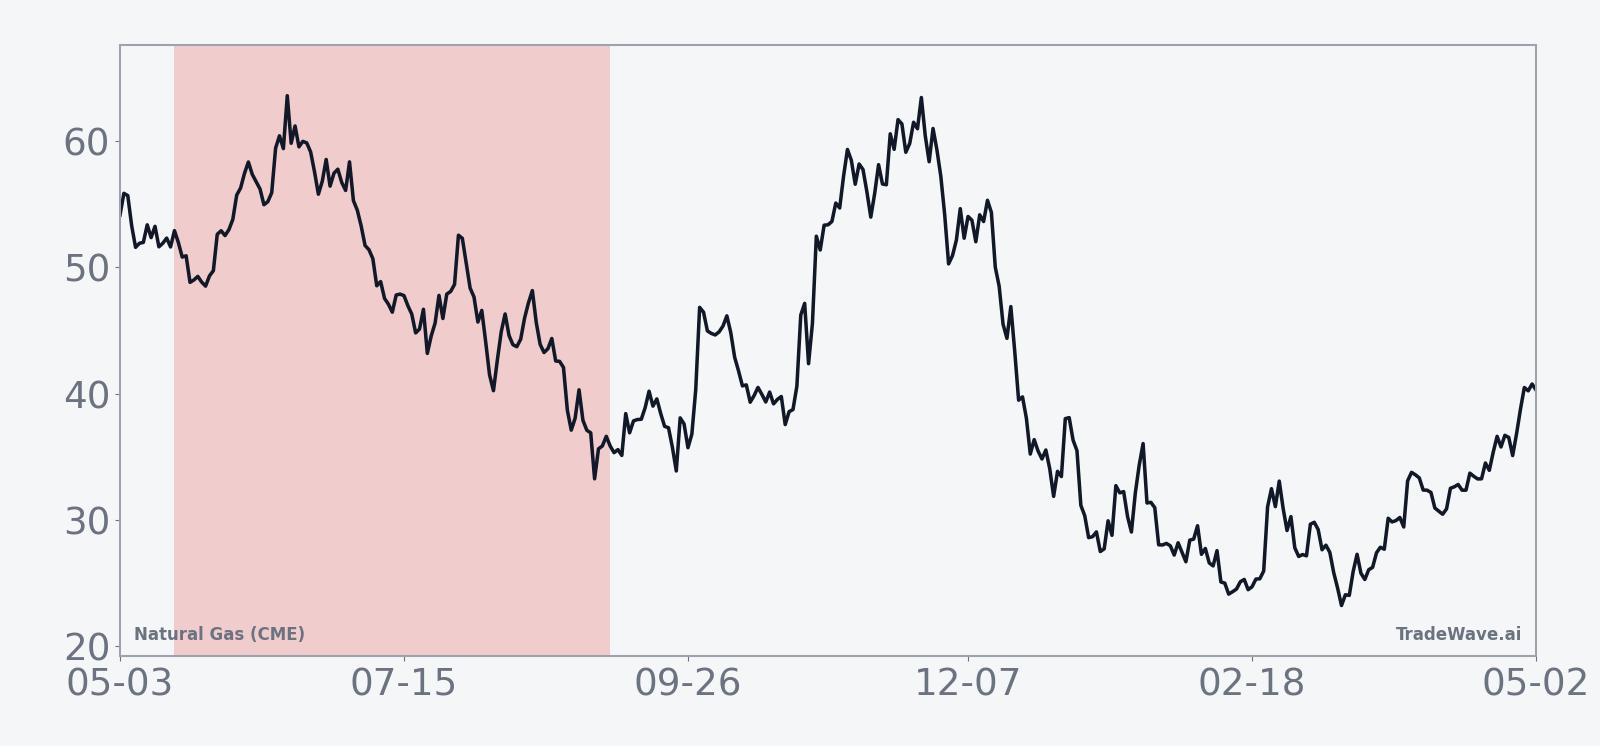
According to historical data from TradeWave.ai, this mid-May through early-autumn stretch has behaved very differently from an average month on the natural gas calendar, especially in midterm election years.
How has Natural Gas (CME) (NG) traded in past midterm-year summer windows?
Natural Gas (CME) has declined in every one of the last eight midterm election-year windows starting around May 17, with short positions averaging 9.11% profit and a cumulative 98% gain across cycles. Today the front-month NG contract trades at 2.649, down 1.5% on the session and sitting about 66.1% below its 52-week high of 7.827 while hovering just above the 52-week low of 2.561. That combination of a historically bearish NG seasonal trend and a contract already pinned near the bottom of its one-year range sets up a very different backdrop from the winter spike that accompanied January’s cold snap.[3]
This pattern is grouped by the presidential election cycle, focusing on the last eight midterm election years rather than consecutive calendar years. That matters because midterm years often bring shifting policy expectations, budget debates and regulatory noise that can ripple through energy demand assumptions and risk appetite, creating a distinct backdrop for Natural Gas (CME) compared with the year after the presidential election or the pre-election year.
For this NG seasonal trend, the trade direction is explicitly short. In other words, years where natural gas futures drifted or broke lower through the window were favorable for the pattern, while sharp rallies represented losing behavior for a hypothetical short. Across the last eight midterm election years, every instance delivered a negative net return for the contract over the 113-day span, from a relatively modest 2.17% drop in 2022 to an 18.11% slide in 1994.
The average 9.11% profit figure reflects the mean outcome across those eight winning short trades. Median profit is even higher at 10.72%, which tells you that more than half of the windows produced double-digit percentage declines for longs. Add it up and the cumulative return for the pattern is 98%, meaning a systematic short approach in this specific Natural Gas (CME) trading window would have nearly doubled capital across the eight midterm-year iterations, before costs and slippage.
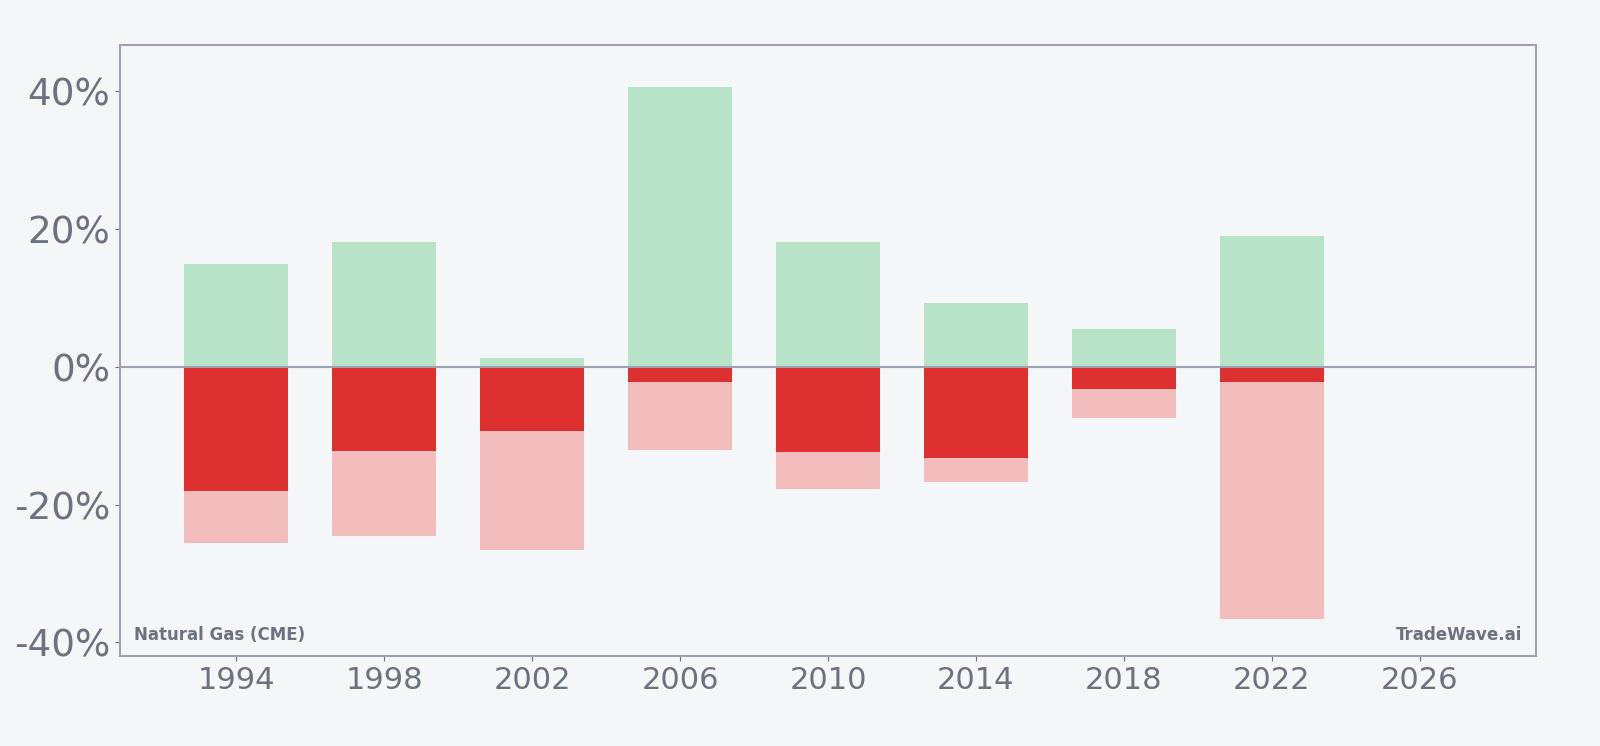
Intraperiod swings have been anything but gentle. Maximum favorable moves for shorts, measured by the best point-to-trough excursion from entry, have ranged from 1.25% in 2002 to more than 40% in 2006, when prices briefly spiked higher before rolling over. On the flip side, maximum adverse excursions have been large, with several years seeing 20% to 30% squeezes against the short before the contract ultimately finished lower for the window. In 2022, for example, the worst drawdown from entry reached 36.57% even though the final net move was only a 2.17% decline.
The historical seasonal average path for this window shows a tendency for NG to chop early, with rallies that can pressure shorts, then gradually bleed lower into the back half of the 113 days. That fits the per-year table, where some of the strongest net declines, such as 1994 and 2010, came after periods of early volatility rather than a straight-line slide from day one.
Year-by-year bars with both peak rallies and peak selloffs show how often shorts have been tested before finishing ahead.
History does not guarantee future results; even in a window that has never produced a losing year for shorts, adverse excursions have been large enough to challenge risk limits before the pattern resolved lower.
Why does Natural Gas (CME) (NG) follow this seasonal pattern?
This midterm-year seasonal pattern for Natural Gas (CME) may reflect a mix of commodity supply and demand seasonality and the policy calendar. One likely driver is the shoulder-season transition from late spring into summer, when heating demand fades before peak power burn fully ramps, often leaving storage builds elevated and prices under pressure.[1] Analysts have also pointed to midterm-year policy debates and budget wrangling that can dampen growth expectations and risk appetite, reinforcing a tendency for energy contracts like NG to soften during this stretch.[2]
What is driving Natural Gas (CME) (NG) today?
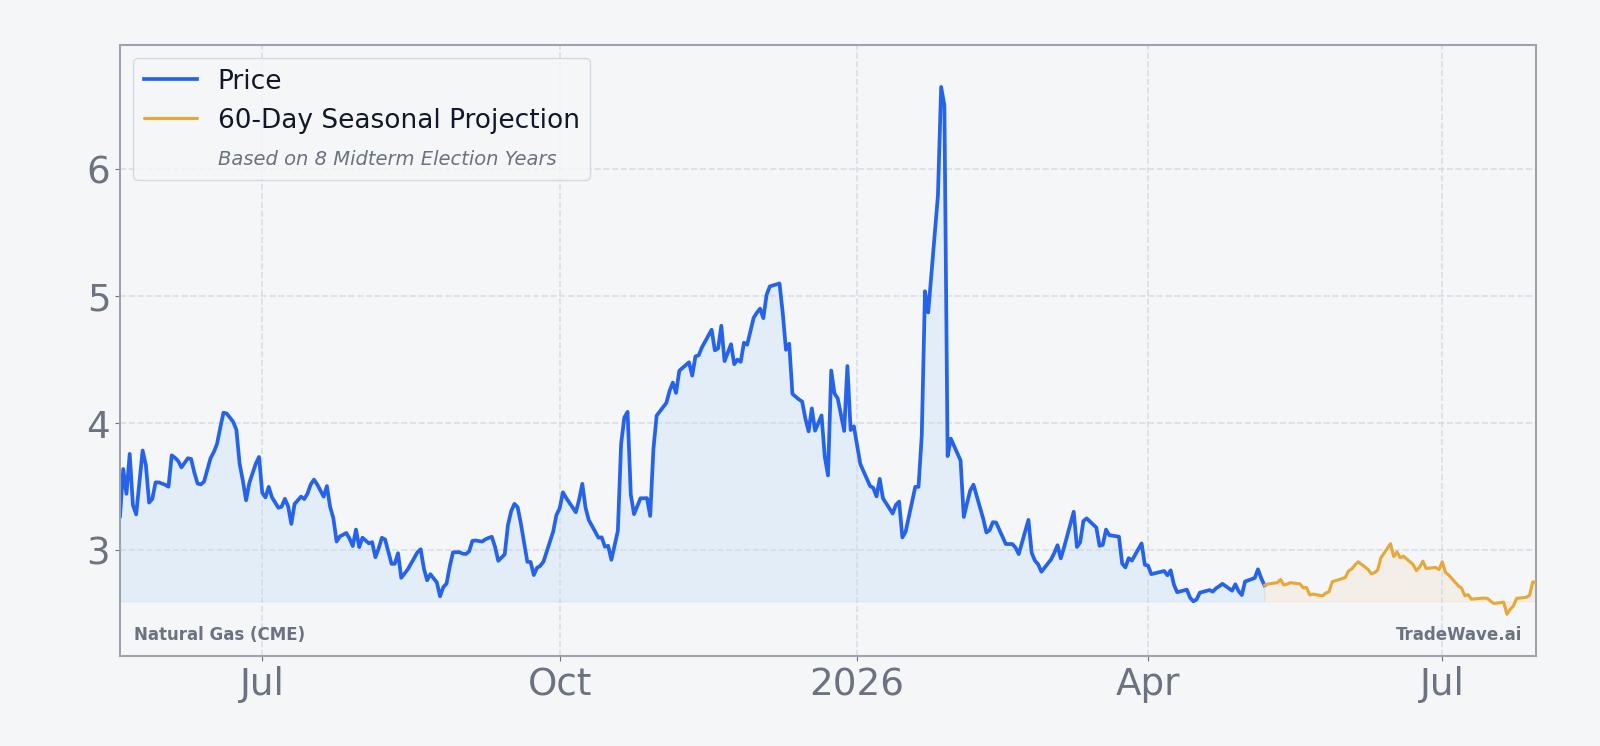
Front-month Natural Gas (CME) futures last traded at 2.649, down 1.4875% on the day, with intraday trade confined between 2.643 and 2.675 on relatively light volume of 3,681 contracts versus a 20-day average of 116,505.3. That leaves NG trading well below its 50-day moving average of 2.94848 and about 66.1% under its 52-week high of 7.827, a reminder of how far prices have retreated since last year’s spikes.[3] In January 2026, a burst of bitter cold in the U.S. Northeast sent natural gas prices soaring and likely drove volume spikes as traders scrambled to reprice weather risk, but those conditions have since faded.[3]
Weather remains the dominant macro driver for this contract. In October 2025, elevated supply and mild demand weighed on prices as storage builds came in lower than expected but still pointed to surpluses, keeping a lid on rallies.[1] By December 2025, cold forecasts and expectations of inventory withdrawals helped NG recover from earlier weakness, underscoring how quickly sentiment can flip when heating demand picks up.[2] Across these episodes, the common thread has been ample storage and a market that reacts sharply to any hint that balances might tighten, a backdrop that will matter again as the market approaches the upcoming seasonal window.
The chart below situates the latest move against the past year of trading and a short-term seasonal projection.
What should traders watch as this NG seasonal window approaches?
With Natural Gas (CME) already trading near its 52-week low, the historical pattern of midterm-year weakness collides with a market that has arguably front-loaded a lot of downside. The key question for traders is whether the upcoming 113-day window starting May 17 behaves like prior cycles, where rallies were sold and shorts ultimately prevailed, or whether tightness in storage or an unexpected heat wave breaks the streak.
First, watch weekly U.S. storage data and weather-driven demand expectations. In past episodes, elevated storage surpluses and mild temperatures have capped upside and encouraged selling into strength, while cold forecasts or heat-driven power demand have sparked sharp squeezes even within a broader downtrend.[1][2] If inventories remain comfortable and forecasts lean mild into early summer, that would rhyme with the historical NG seasonal pattern of pressure on prices during this window.
Second, monitor how price behaves around the 50-day moving average and the 2.56 to 2.95 band. Sustained trade below the 50-day average has often signaled that rallies are being faded rather than chased, which would align with a short-favorable seasonal backdrop. A decisive break back above that moving average on strong volume, especially if tied to weather or supply shocks, would be a sign that this cycle may diverge from the last eight midterm years.
Third, keep an eye on volume and intraday ranges as the window opens. January’s cold-driven spike showed how quickly NG can move when positioning is offside, with prices “soaring” as temperatures dropped and likely triggering volume surges and short covering.[3] If similar bursts of activity appear early in the window but fail to hold at higher prices, that would echo prior years where big intraperiod rallies ultimately gave way to lower closes by the end of the 113 days.
Finally, track the broader policy and macro backdrop into the heart of the midterm election year. Budget negotiations, regulatory headlines and any shifts in LNG export policy can all influence demand expectations and risk appetite for energy. If those factors stay relatively calm while storage remains comfortable, the historical pattern of NG weakness in this specific midterm-year window will be hard for traders to ignore, even if the path involves sharp squeezes along the way.
Sources
About this seasonal analysis
Seasonal pattern data is sourced from TradeWave.ai, which analyzes historical price behavior across annual calendar windows going back up to 30 years. Read the full data methodology or the book The 100-Year Pattern by Afshin Moshrefi (2026 edition). Past performance of seasonal patterns does not guarantee future results. This article is for informational purposes only and does not constitute investment advice.