Trust VIX Short-Term Futures ETF (VIXY) Has Dropped 10 of 10 Springs in This 60-Day Window
Trust VIX Short-Term Futures ETF is about to enter a 60-day volatility window that has historically rewarded short sellers every year for a decade, even as spot markets and macro headlines shifted around it.
What is the seasonal pattern for Trust VIX Short-Term Futures ETF (VIXY)?
Trust VIX Short-Term Futures ETF has fallen in 10 of 10 years during this April–June window for short trades, with an average gain of 21.97% in winning years.
- 10 for 10 in this window for short positions, with an average profit of 21.97% per year over the last decade.
- Seasonal window starts Apr 9 and runs for 60 trading days, covering much of the spring volatility lull.
- Percent Profitable is 100%, with 10 winners and 0 losers across the 10-year VIXY seasonal trend sample.
- Annualized return for the pattern is 21.49%, supported by a Sharpe ratio of 1.92 on end-of-window outcomes.
- TradeWave Ratio of 3.02 indicates that price has typically traveled meaningfully in the short direction within the window.
- Intraperiod swings have been large, with some years showing double-digit peak rallies before VIXY ultimately rolled over.
According to historical data from TradeWave.ai, this upcoming stretch has behaved very differently from an average month on the volatility calendar. TradeWave.ai’s historical database shows a repeatable pattern in VIXY around early April that most volatility traders never see quantified.
How has Trust VIX Short-Term Futures ETF (VIXY) traded in this April–June window?
Trust VIX Short-Term Futures ETF has delivered a clean sweep for short sellers in this 60-day April–June window, falling in 10 of 10 years with an average profit of 21.97% for the short side. The next iteration of that seasonal window begins on Apr 9 and runs deep into early summer, overlapping a period when volatility products have often bled lower even as headline risk felt elevated. For traders who use VIXY as a hedge or a tactical volatility bet, that track record turns a routine calendar date into a defined regime on the volatility curve.
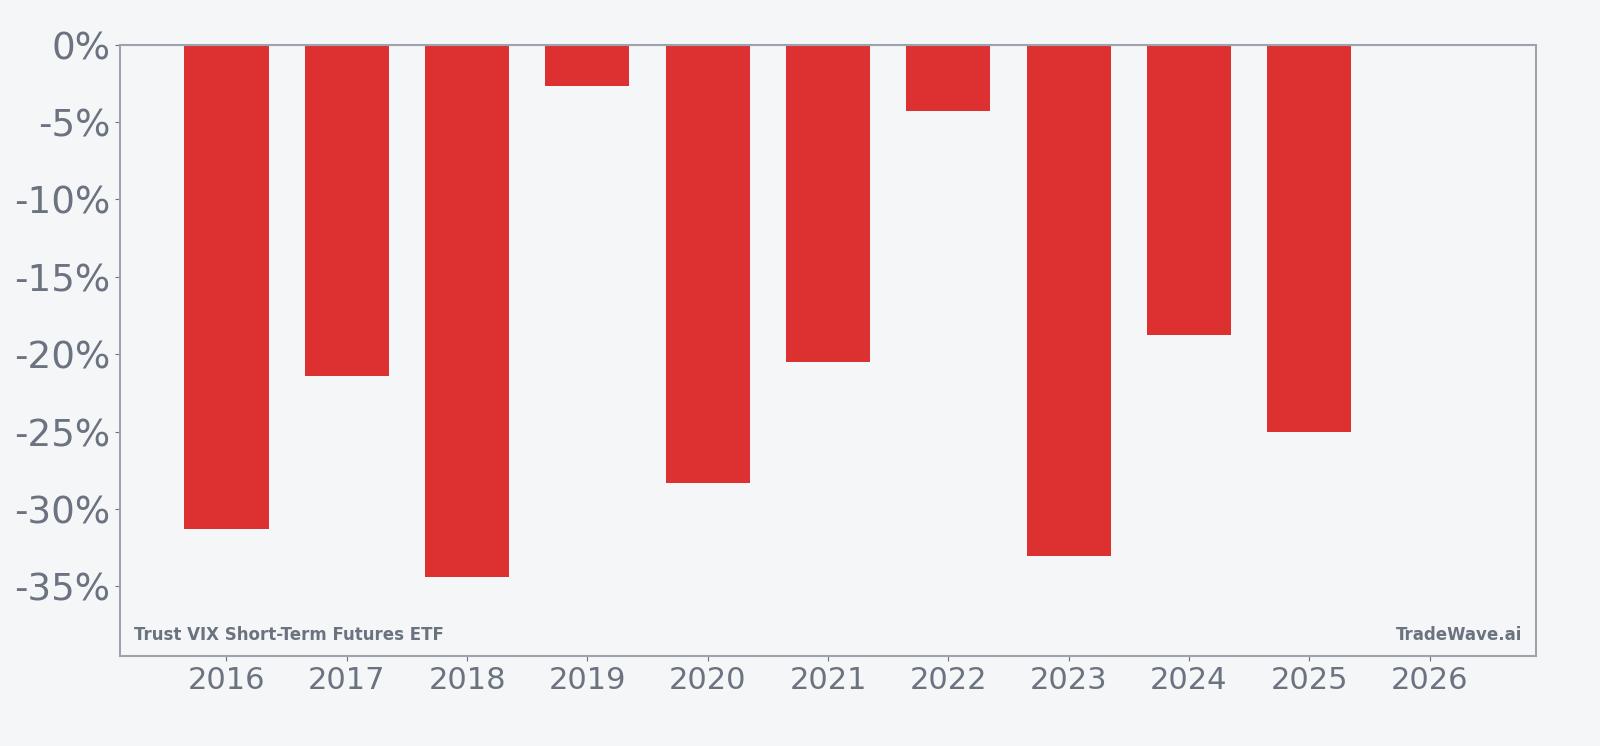
Across the 10-year sample, every single April–June window produced a negative net return for VIXY, which is a positive outcome for a short trade. The weakest year for the ETF in this window was 2018, when VIXY dropped 34.38% from entry to exit, while 2016 and 2023 also saw declines of more than 30% as volatility mean-reverted after earlier spikes. Even the softest outcome, in 2019, still delivered a 2.66% decline in VIXY, keeping the win streak intact for traders positioned short.
The average winner at 21.97% masks a wide range of paths inside the window. In 2020, for example, VIXY’s net move was a 28.34% decline, but the ETF first rallied as much as 15.89% from the entry point before rolling over. That 15.89% figure is the maximum favorable move for a long holder, which in this context is the maximum adverse move for a short, and it shows how painful the path could be even in a year that ultimately rewarded the seasonal short setup.
On the flip side, the maximum favorable excursion for shorts has often been larger than the final net result. In 2025, VIXY’s net decline in the window was 25.02%, but the ETF traded as much as 29.94% lower than the entry price at the best point for shorts. That gap between the peak move and the final close is a reminder that volatility products can snap back quickly, even when the broader seasonal bias is lower.
A combined view of yearly net returns and intraperiod swings shows how far VIXY has tended to move in both directions before settling lower.
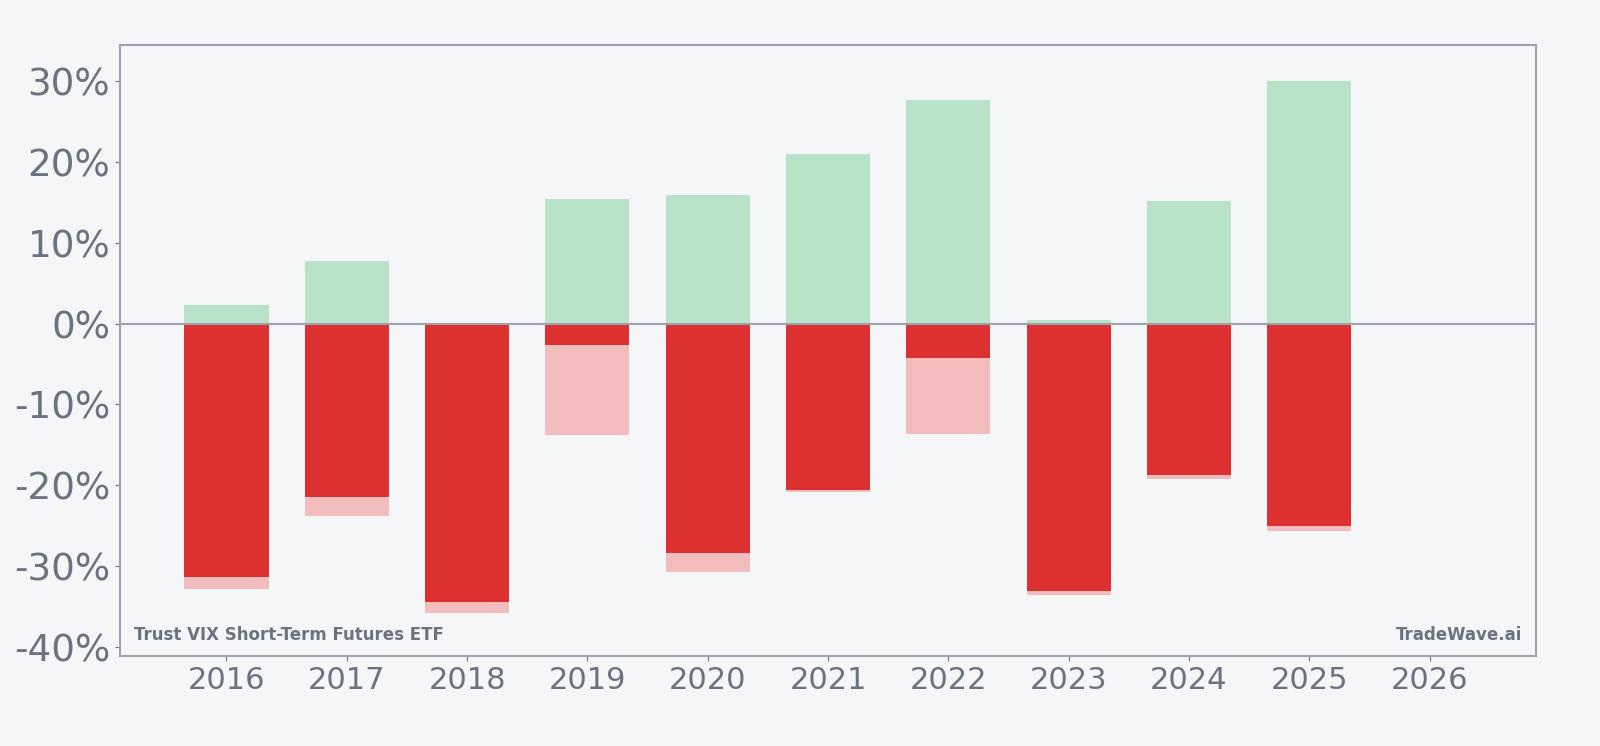
Put together, the pattern is unusually clean for a volatility product: 10 winners, 0 losers, and a double-digit average profit for shorts, but with large swings inside the window that can test conviction. History does not guarantee a repeat, yet the consistency across a decade of data is hard to ignore.
Why does Trust VIX Short-Term Futures ETF (VIXY) follow this seasonal pattern?
One likely driver is the way equity markets and volatility futures behave around the spring earnings season, when realized volatility often fades after event risk passes and VIX futures curves tend to steepen. Analysts have also pointed to institutional portfolio rebalancing and systematic volatility selling strategies that rebuild exposure after first-quarter stress, putting steady pressure on short-term VIX futures. For an ETF like VIXY that holds a rolling basket of front-month VIX futures, that combination of volatility decay and roll costs can translate into a persistent springtime drag on the share price.
History does not guarantee future results, and even in this historically favorable window for shorts, adverse excursions have reached more than 20% in several years before VIXY ultimately moved lower.
What is driving Trust VIX Short-Term Futures ETF (VIXY) today?
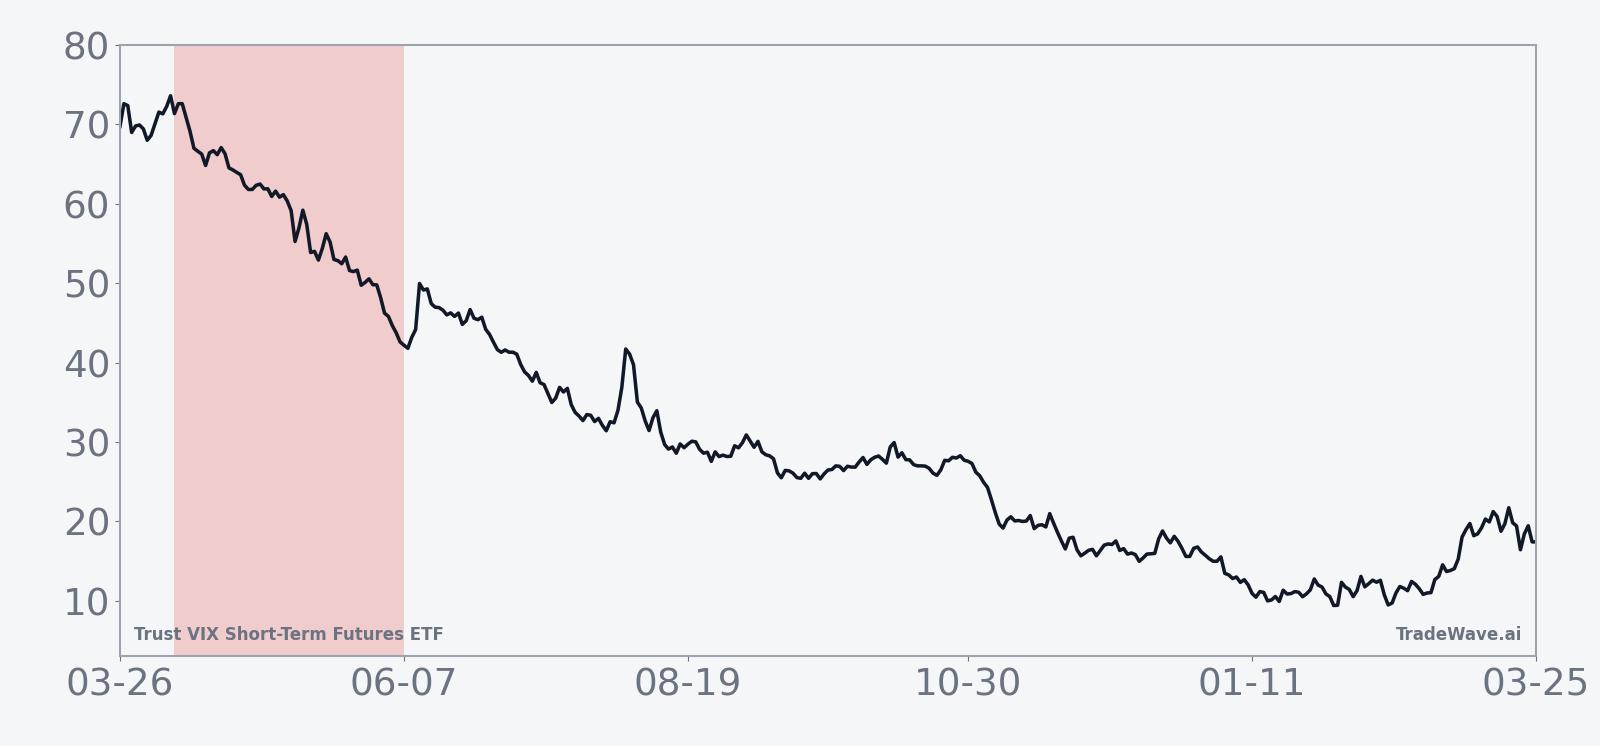
VIXY is a pure volatility vehicle, designed to track short-term VIX futures rather than a traditional equity or bond benchmark, so its day-to-day moves are tied to swings in implied volatility and the shape of the VIX futures curve rather than company earnings or sector news. Over the past month, the ETF has slipped about 5.05%, reflecting a grind lower in volatility as equity indices have stayed relatively calm and the term structure has favored contango. That backdrop means VIXY is heading into its historically weak April–June seasonal window already on the back foot, with recent price action echoing the longer-run pattern of springtime decay.
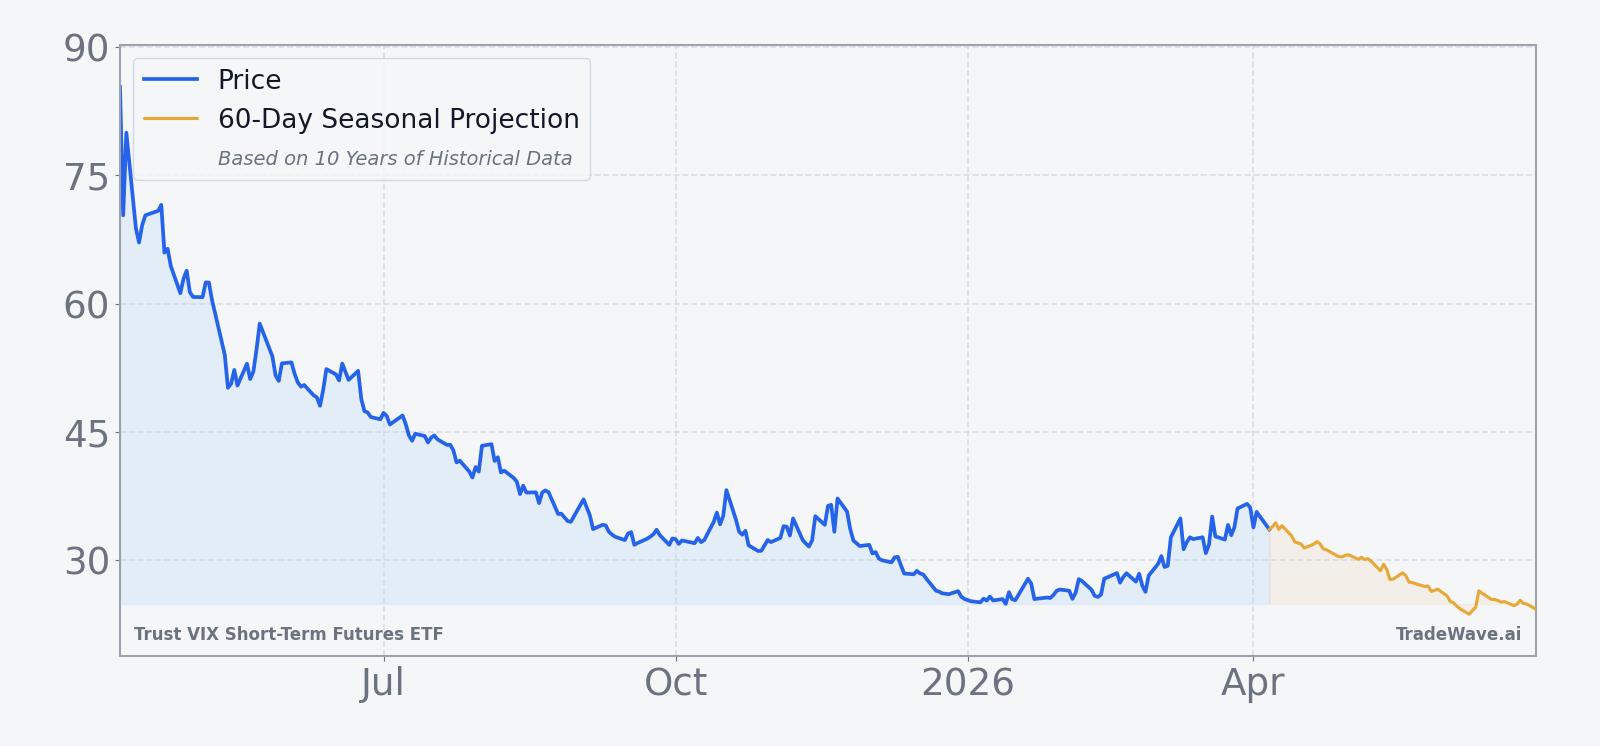
The chart below situates the latest pullback in VIXY within its recent 12‑month trading range and overlays the upcoming 60‑day seasonal projection.
How does VIXY’s structure shape this seasonal behavior?
Trust VIX Short-Term Futures ETF holds a rolling position in short-term VIX futures, which means investors are effectively buying exposure to implied volatility rather than the VIX index itself. In quiet markets, those futures tend to trade above spot VIX and then slide lower as they converge toward the index, a process that creates a structural headwind for long VIXY holders. The April–June seasonal pattern lines up with periods when that roll-down effect has been especially persistent, turning the ETF’s design into a tailwind for traders who are short volatility exposure.
Because VIXY is often used as a hedge against equity drawdowns, flows into the ETF can spike when investors fear a sell-off and then reverse as those fears fade. The 10-year seasonal record suggests that, on balance, those hedges have decayed in value during this specific spring window more often than they have paid off. For portfolio managers, that makes the upcoming VIXY seasonal window less about predicting a crash and more about understanding how quickly volatility insurance can lose value when markets stay orderly.
What should traders watch as this VIXY seasonal window opens?
As the Apr 9 start date approaches, the first thing to watch is whether VIXY continues to drift lower into the window or whether a late spike in equity volatility lifts the ETF before the seasonal clock starts. A sharp pre-window rally would not break the historical pattern, but it would raise the stakes for anyone leaning on the 10-for-10 record of declines over the subsequent 60 trading days. The second key item is the shape of the VIX futures curve: a steep contango has historically amplified VIXY’s downside in this window, while a flatter curve has tended to mute the effect.
Traders should also track how VIXY behaves relative to its own recent range, particularly around the prior 52-week low of 24.81 and the 50-day moving average near 29.89. Sustained trading below that moving average during the window would be consistent with the historical VIXY seasonal trend, while a decisive break above it on rising volume would signal that this year’s path may diverge from the past decade. Finally, because VIXY is often a proxy for broader risk sentiment, any unusual build-up in hedging demand or a sudden flattening of the VIX curve could quickly overwhelm the seasonal tendency, reminding traders that even a 10-for-10 pattern is a backdrop, not a guarantee.
Sources
About this seasonal analysis
Seasonal pattern data is sourced from TradeWave.ai, which analyzes historical price behavior across annual calendar windows going back up to 30 years. Read the full data methodology or the book The 100-Year Pattern by Afshin Moshrefi (2026 edition). Past performance of seasonal patterns does not guarantee future results. This article is for informational purposes only and does not constitute investment advice.