CBOE Volatility Index (VIX) Has Fallen in 9 of 10 Years in This 69-Day Summer Slide
CBOE Volatility Index is sitting near the middle of its 52-week range just weeks before a 69-day seasonal window that has historically favored short volatility trades.
What is the seasonal pattern for CBOE Volatility Index (VIX)?
CBOE Volatility Index has fallen in 9 of 10 years during this May 6 to early-August window, with an average 13.73% gain for short volatility trades in winning years.
- 9 for 10 in this window, with short volatility trades averaging 13.73% gains in winning years.
- Seasonal window runs 69 trading days from May 6, covering much of the late-spring and early-summer equity calm.
- Percent Profitable is 90%, with 9 winning years and just 1 losing year across the past decade.
- Including all years, the average outcome is a 12% gain for the short side, reflecting only one modest losing season.
- TradeWave Ratio of 2.27 signals that VIX typically travels meaningfully in the trade direction inside the window before settling.
- Intraperiod swings have been large, with both sharp volatility spikes and deep drawdowns appearing before VIX usually finishes lower.
According to historical data from TradeWave.ai, this upcoming stretch has behaved very differently from an average month on the volatility calendar, and the next iteration is now less than a month away.
How has CBOE Volatility Index (VIX) behaved in this May–summer window?
CBOE Volatility Index has declined in 9 of the past 10 years during the 69 trading days starting May 6, making this one of the most consistent short volatility windows on the calendar. Today VIX closed at 23.87, down 2.7% on the session, leaving it about 33.2% below its 52-week high of 35.75 and 78.4% above its 52-week low of 13.38. That combination of a mid-range level and a historically bearish VIX seasonal trend into early summer is the backdrop traders are weighing as they look ahead to the next volatility regime.
Trade direction for this pattern is short, which means the historical edge has come from VIX drifting lower over the window rather than spiking higher. Across the past decade, short volatility exposure in this slice of the calendar has produced a 90% win rate, with 9 winning years and just 1 losing year. Average profit in the winning years is 13.73%, while the average outcome across all years, including the lone loss, is still a solid 12% gain.
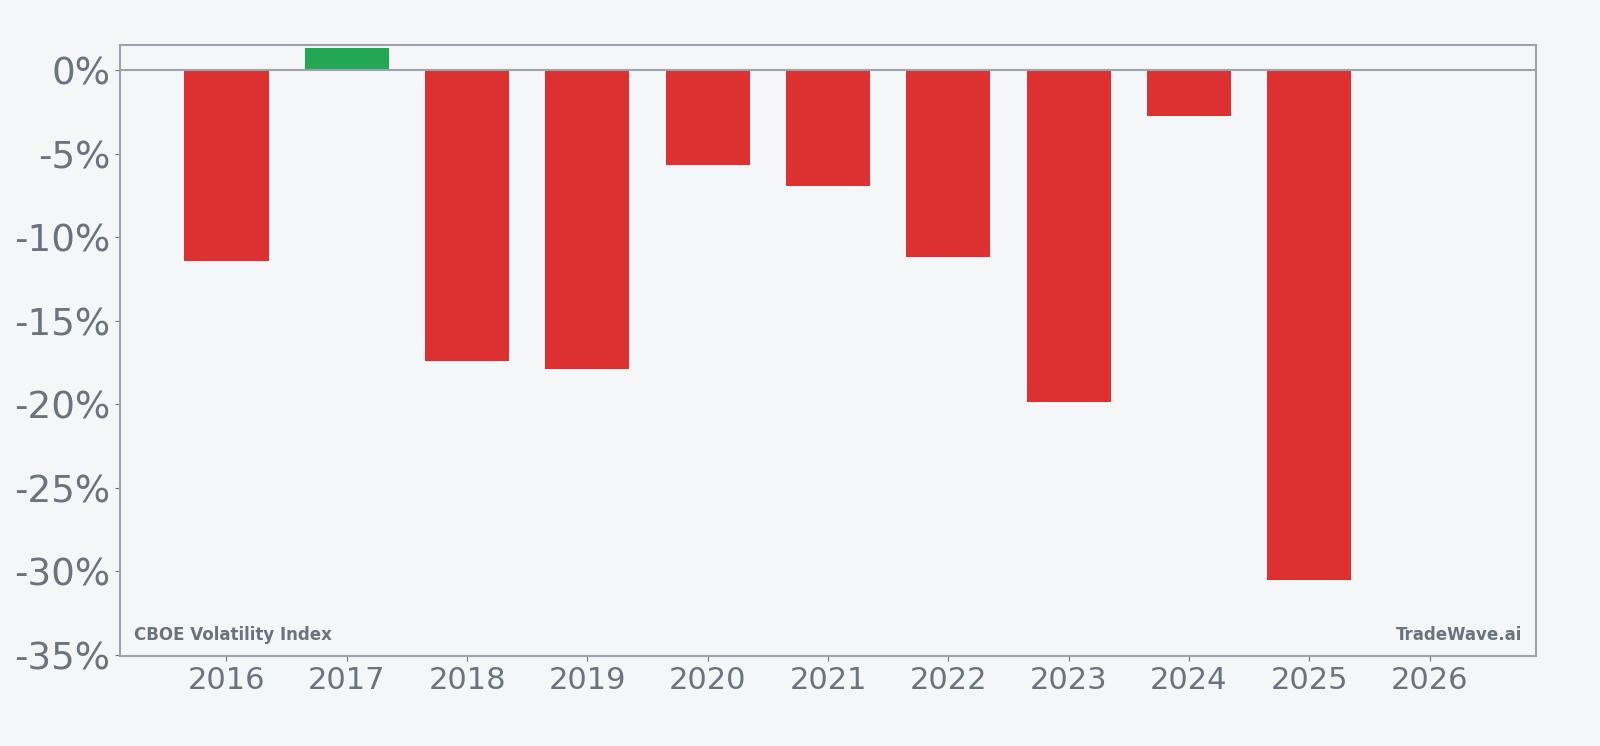
The per-year table shows that the strongest season for this pattern came in 2025, when short VIX exposure returned 30.53% as the index slid from an entry level of 24.76 to 17.20 by the end of the window. The weakest outcome was 2017, which still eked out a 1.33% loss for shorts as VIX finished slightly higher, moving from 9.77 to 9.90. That mix of one small losing year and several double-digit winners is what drives the high Sharpe ratio of 1.22 for this seasonal setup.
Intraperiod swings have been anything but quiet. Maximum favorable excursions, which capture the best point-to-peak move in the trade direction, have ranged from 10.30% in 2024 to 81.52% in 2016, showing that VIX often offers deep downside runs for shorts before the window closes. Maximum adverse excursions, the worst drawdowns from entry, have also been large, reaching as much as 36.59% in 2025 and 31.01% in 2020, a reminder that even winning years for the short side have featured sharp volatility spikes along the way.
The 10-year seasonal trend chart shows VIX typically holding up in the early part of the window before grinding lower into the back half, which is when most of the short-side gains have accrued. The average path is not a straight line, but the bias is clear: volatility spikes have tended to fade rather than build during this late-spring and early-summer stretch.
A combined view of net results and intraperiod swings highlights how far VIX has tended to move before settling lower.
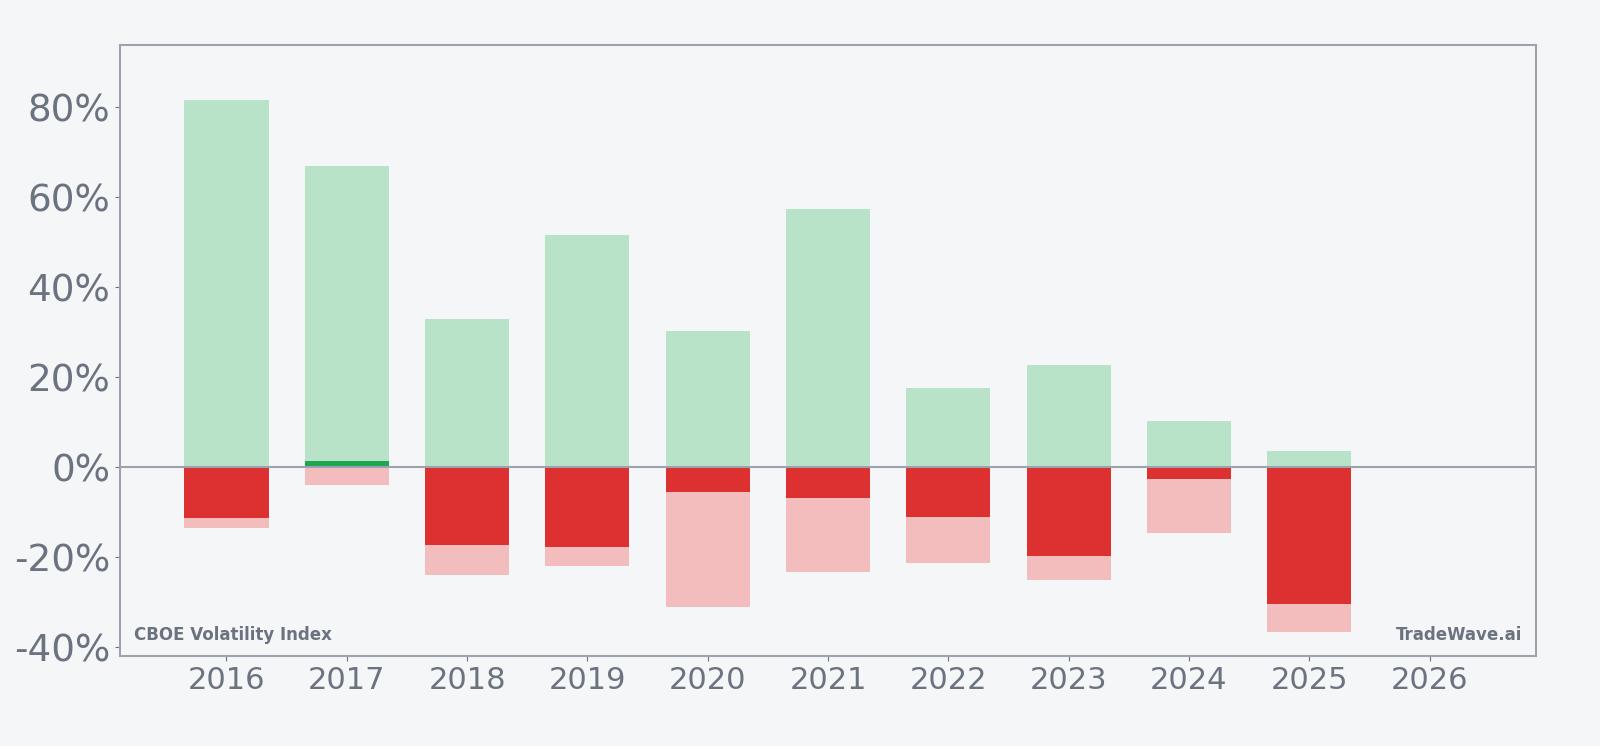
The stacked net, maximum favorable, and maximum adverse bars make the pattern plain: most years finish with VIX lower, but almost every season includes at least one sharp volatility burst against the short side before the fade sets in. Add it up and the cumulative return across the decade is 207% for this window, with a TradeWave Ratio of 2.27 that signals meaningful travel in the trade direction even when the final net move is smaller.
History does not guarantee future results; adverse excursions can be large even in winning windows, so short volatility exposure in this pattern has carried meaningful drawdown risk.
Why does CBOE Volatility Index (VIX) follow this seasonal pattern?
This VIX seasonal trend likely reflects a mix of earnings calendar clustering, options expiration patterns, and institutional portfolio rebalancing as the market moves from first-half macro shocks into a quieter summer tape. Analysts often point to calmer equity markets and reduced headline risk in late spring and early summer, which can compress implied volatility even when occasional shocks hit. The pattern may also capture systematic volatility selling strategies that tend to reload after early-year stress, leaning into this historically favorable window for short exposure.
What is driving CBOE Volatility Index (VIX) today?
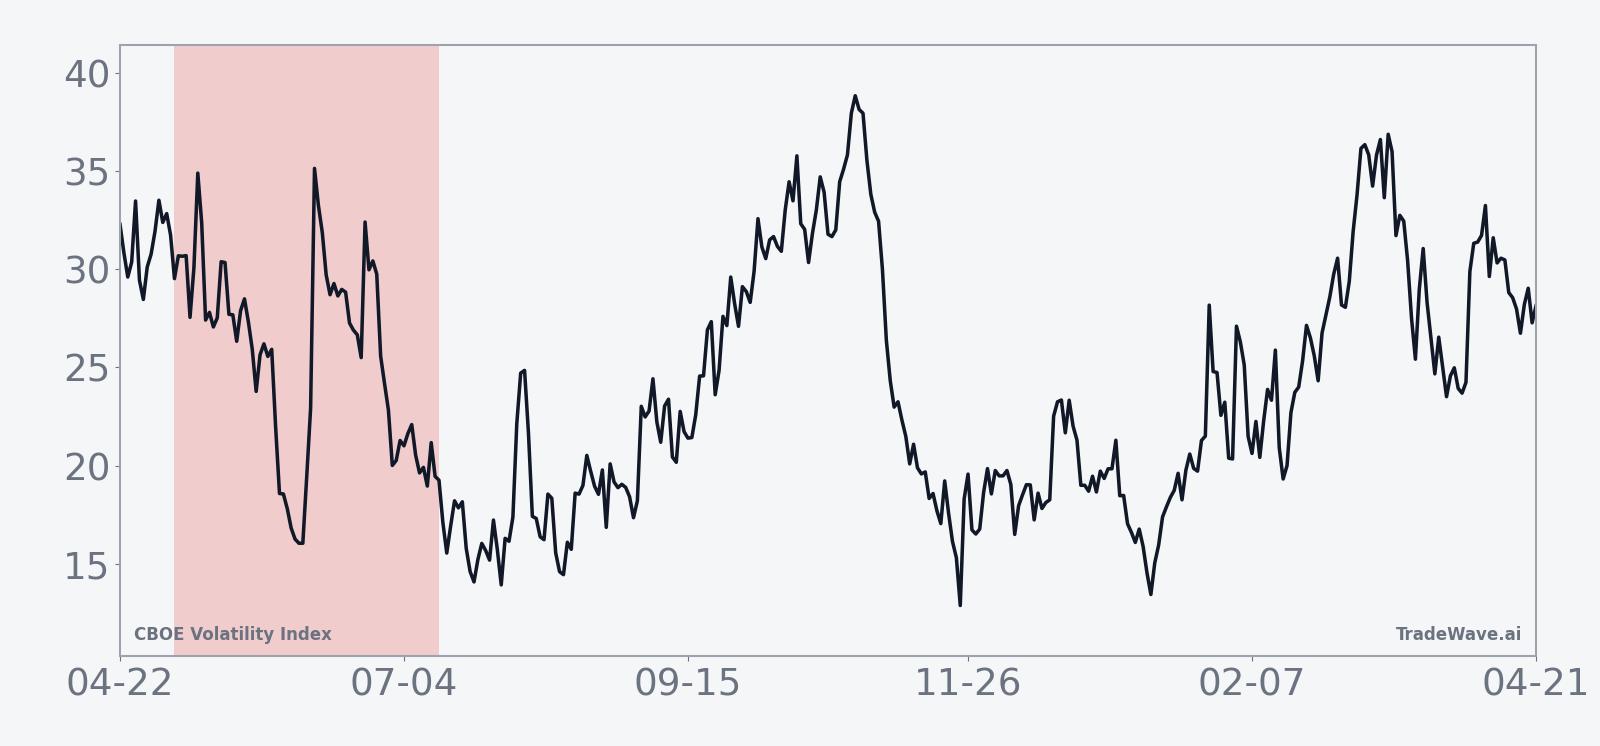
CBOE Volatility Index slipped 2.7% on Monday to 23.87, extending a modest pullback from recent highs but leaving it well above the 13.38 floor set over the past year. That keeps VIX roughly in the middle of its 52-week band between 13.38 and 35.75, a zone where traders often debate whether the next move is a renewed volatility spike or a grind back toward calmer levels.
Macro risk remains the main driver. Policy uncertainty has been a recurring theme since early 2026, with one January report flagging expectations for higher volatility as investors grappled with shifting policy signals and recommended VIX call options as protection against potential shocks.[1] At the same time, the VIX futures curve has been signaling that recent bursts of stress may be short-lived, with term structure pointing to lower implied volatility further out the curve rather than a sustained regime shift.
In the background, the relationship between VIX and equities is behaving as usual: periods of equity strength have tended to coincide with implied volatility compressing, while risk-off episodes have produced abrupt VIX spikes. That push and pull is what makes the upcoming seasonal window so interesting, because the historical pattern suggests that even when shocks hit, they have more often faded than persisted during this specific late-spring stretch.
The chart below situates the latest move in its recent multi-month context and overlays the short-term seasonal projection.
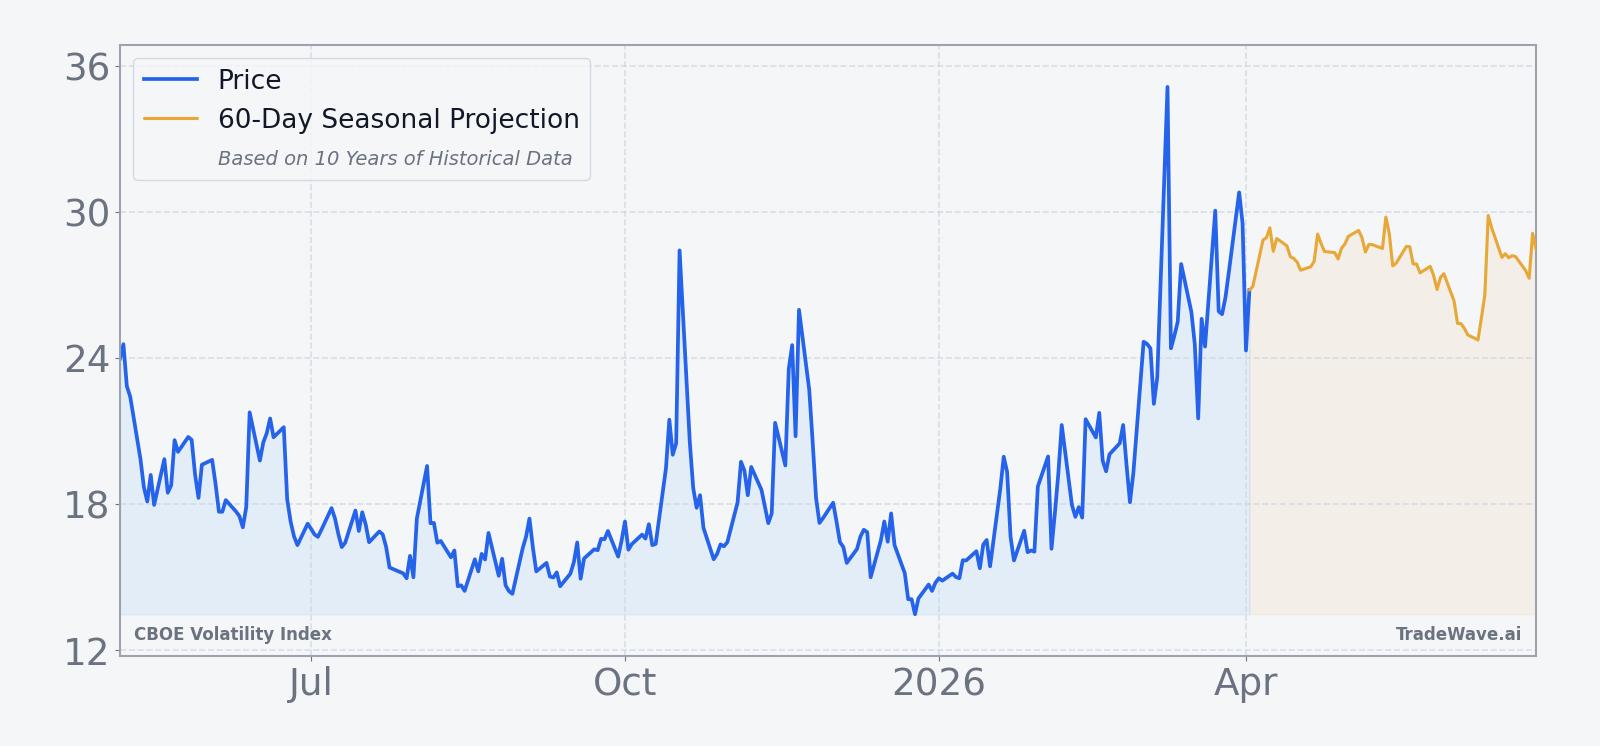
What should traders watch as this VIX seasonal window approaches?
First, the calendar. The 69-day window begins on May 6, so the next few weeks are about watching whether VIX drifts lower into the start date or stays elevated. A move back toward the low teens before the window opens would mean the seasonal pattern is starting from a calmer base, while a push toward the mid-30s would set up a very different risk profile for short volatility trades.
Second, the volatility term structure. If the VIX futures curve remains downward sloping, with near-term contracts richer than later months, that would align with the historical pattern of stress fading into summer rather than building. A flip into a steeply upward-sloping curve would signal that the market is pricing more persistent risk, which would run counter to the typical May–summer VIX seasonal trend.
Third, macro catalysts. Policy headlines and geopolitical developments have repeatedly jolted VIX in past years, even when the eventual outcome fit the seasonal script of volatility fading after the shock.[1] Traders will be watching whether any new flare-ups in trade tensions or policy uncertainty produce spikes that quickly reverse, which would be consistent with the historical window, or whether they mark the start of a more durable volatility regime.
Finally, behavior inside the window itself will be the real test. If VIX spends most of the May 6 to early-August stretch making lower highs and lower lows after any spikes, that would echo the 9-for-10 record for short volatility trades. A pattern of higher lows and sustained closes near the top of the range would be a clear break from the past decade’s seasonality and a sign that the volatility regime has shifted.
Sources
About this seasonal analysis
Seasonal pattern data is sourced from TradeWave.ai, which analyzes historical price behavior across annual calendar windows going back up to 30 years. Read the full data methodology or the book The 100-Year Pattern by Afshin Moshrefi (2026 edition). Past performance of seasonal patterns does not guarantee future results. This article is for informational purposes only and does not constitute investment advice.