Trust VIX Short-Term Futures ETF (VIXY) Has Dropped in 10 of 10 Early-Summer Windows
Trust VIX Short-Term Futures ETF is heading toward a 60-day early-summer stretch that has consistently punished long volatility exposure, even as spot pricing and flows remain in flux.

What is the seasonal pattern for Trust VIX Short-Term Futures ETF (VIXY)?
Trust VIX Short-Term Futures ETF has fallen in 10 of 10 years during this early-May 60-day window for short-position holders, with an average gain of 17.85% in winning years.
- 10 for 10 in this window, with short positions averaging 17.85% gains across winning years over the past decade.
- The upcoming 60-day trading window starts on May 5, 2026 and has historically been a bearish seasonal pattern for VIXY prices.
- Percent Profitable sits at 100%, with 10 winners and 0 losers for the short-direction strategy in this Trust VIX Short-Term Futures ETF trading window.
- Annualized return for the pattern is 17.58%, with a cumulative 404% gain for shorts across the 10-year lookback.
- The TradeWave Ratio of 3.19 indicates that price has typically traveled meaningfully in the short direction within the window, beyond just the final close.
- Intraperiod swings have been sizable, with individual years showing double-digit peak run-ups and deep drawdowns before the pattern ultimately resolved lower.
According to historical data from TradeWave.ai, this early-summer stretch in VIXY has behaved very differently from an average month on the calendar, and the next iteration is about to open again.
How has Trust VIX Short-Term Futures ETF (VIXY) traded in this early-summer window?
Trust VIX Short-Term Futures ETF has declined in every one of the past 10 early-summer windows for long holders, delivering a 100% win rate for traders positioned short during the 60 trading days starting May 5. The next window begins on May 5, 2026 and runs into early July, a period when VIXY has historically trended lower even as volatility headlines have come and gone. For volatility traders who typically think in terms of sudden spikes, this kind of slow, persistent bleed has been the dominant seasonal trend.
Across the 10-year sample, the average profit for the short strategy in this VIXY seasonal trend is 17.85%, with a median outcome of 16.55%. The weakest year for shorts was 2018, when the net return was still a 6.3% gain, while the strongest was 2023, when VIXY dropped 36.51% over the window. Add it up and the cumulative return for staying with the pattern each year has been 404%, a sizable payoff for a product that many traders treat as a short-term hedge rather than a repeatable seasonal trade.
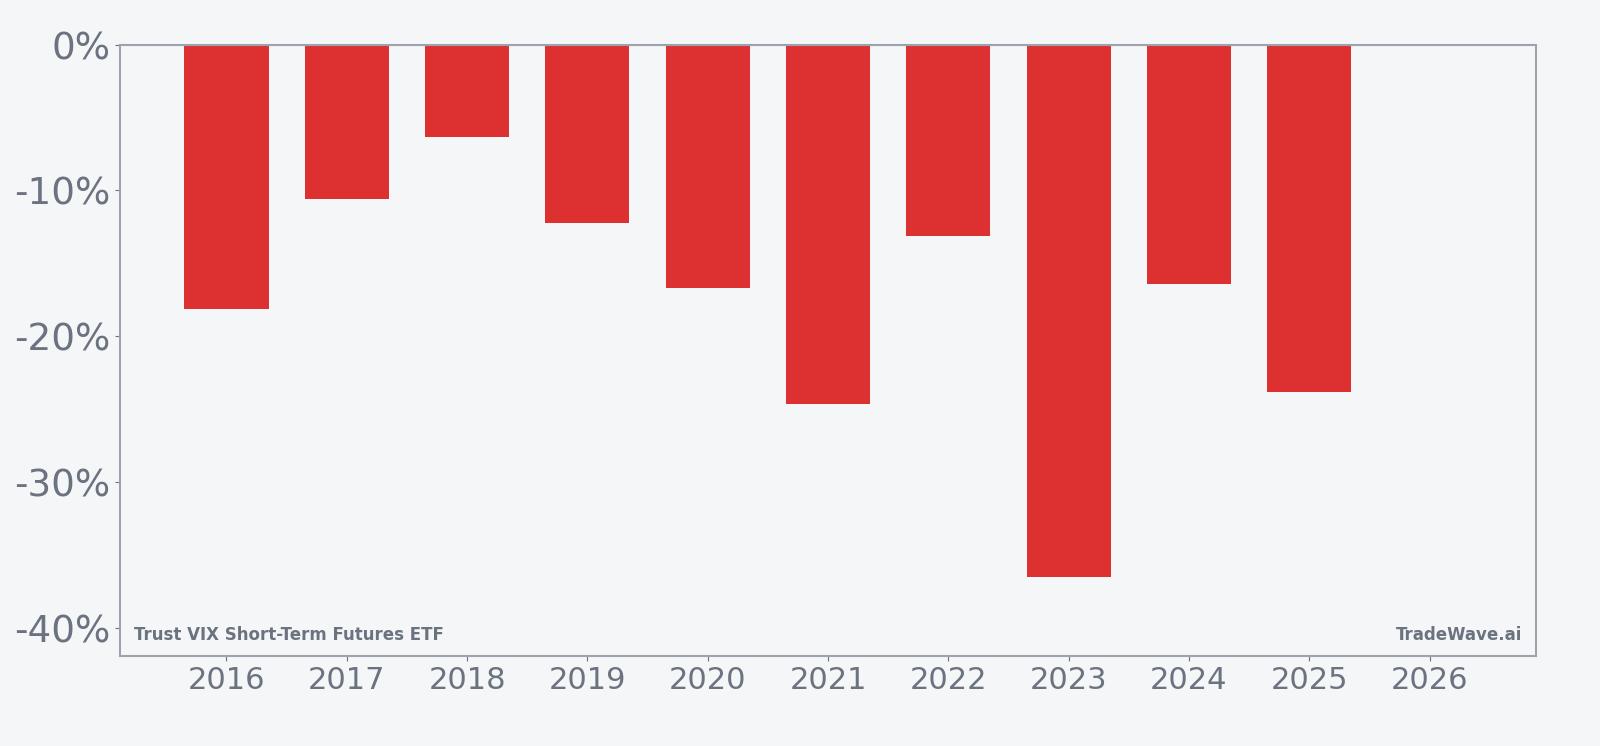
The per-year path data shows that this Trust VIX Short-Term Futures ETF trading window has not been a straight line. In 2021, for example, VIXY’s best point-to-peak move within the window was a 27.27% rally before the ETF ultimately finished the period down 24.66% from the entry level. In 2016, the maximum favorable move for longs was 7.05%, but the worst drawdown from entry was a 24.59% slide, and the window closed with an 18.17% loss for long holders. That mix of sharp intraperiod spikes and deeper fades is typical of volatility products, but here it has repeatedly resolved in favor of the short side.
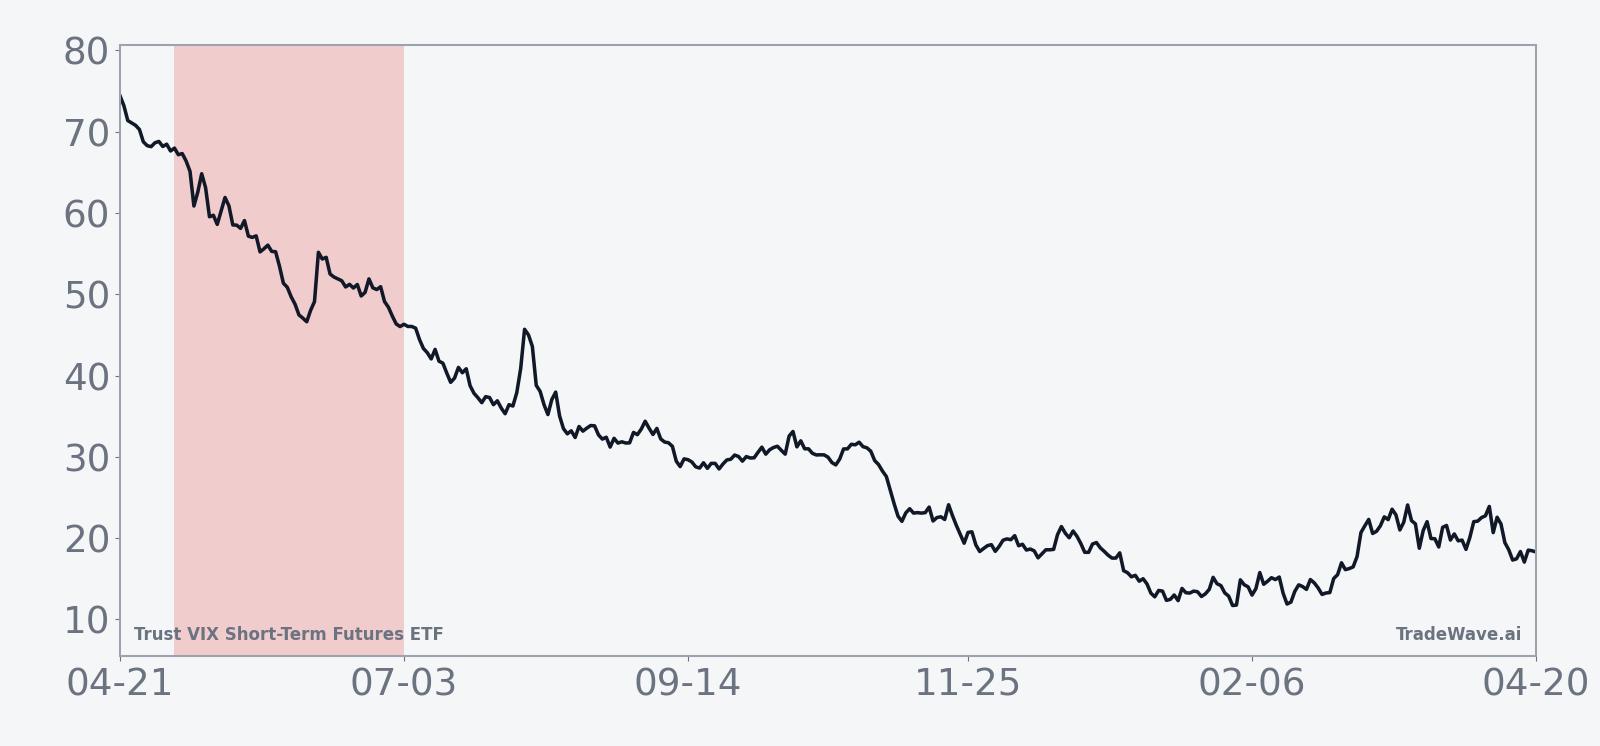
The 10-year average seasonal curve slopes steadily in favor of shorts, with much of the typical gain accruing in the middle third of the window. Early days often show choppy action as volatility reacts to late-spring macro headlines, but by the back half of the period the average path has VIXY grinding lower. For traders who watch historical seasonality, that profile suggests that patience inside the window has historically been rewarded more than trying to time every intraday spike.
Yearly net returns alongside peak favorable and adverse moves show how often VIXY has spiked before ultimately sliding lower in this stretch.
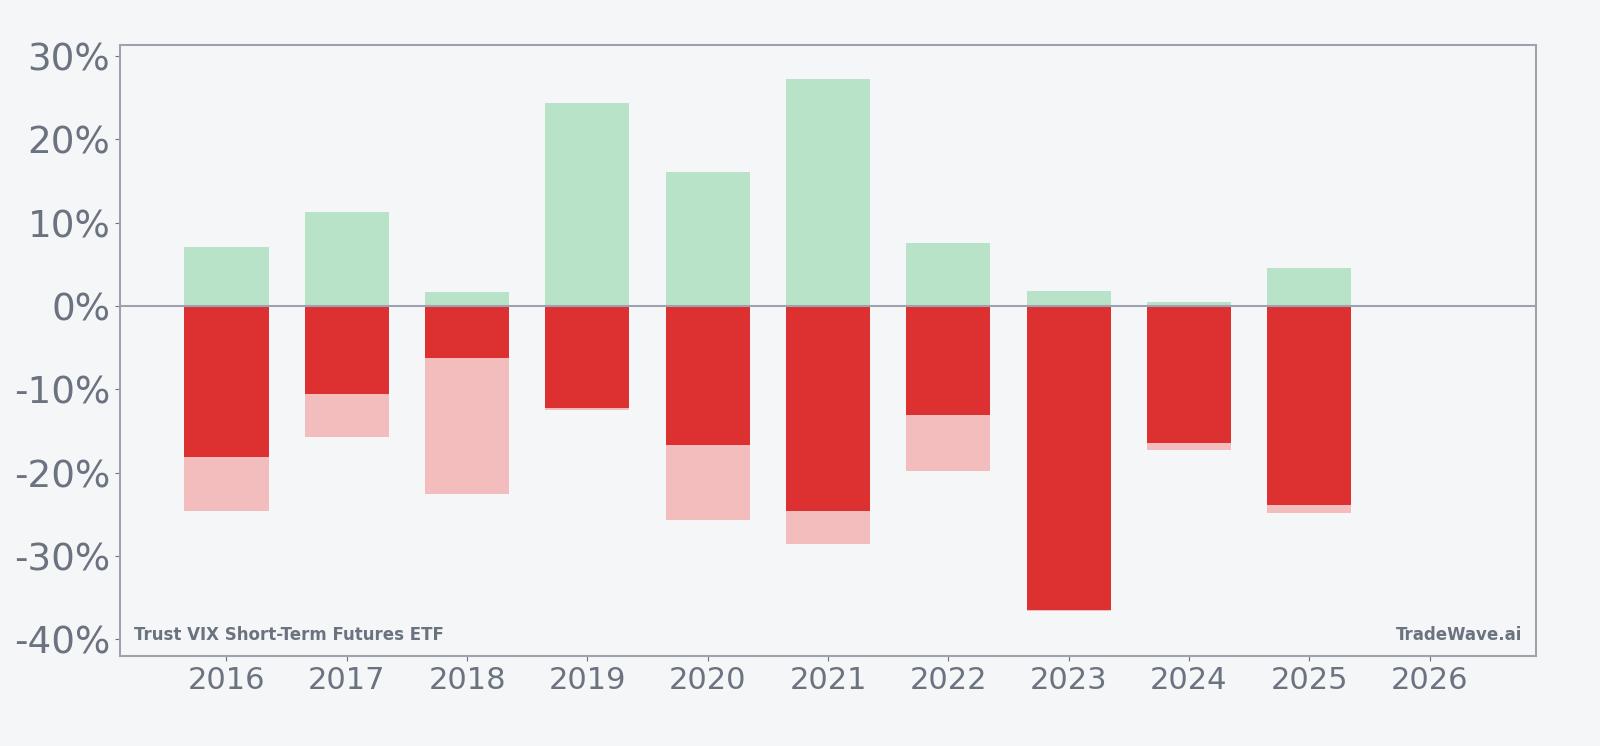
The combined net, peak favorable move and worst drawdown bars underline how volatile this early-summer VIXY seasonal pattern has been inside the window. In several years, including 2019 and 2021, VIXY staged double-digit rallies from the entry point before rolling over into even larger declines, while in 2023 the ETF barely bounced at all and simply trended lower. For traders, the message is that the historical edge has come from the direction of the final move, not from avoiding every short-term squeeze.
History does not guarantee future results, and the worst intraperiod drawdowns have been large even in years that ultimately finished as winners for the short strategy.
Why does Trust VIX Short-Term Futures ETF (VIXY) follow this seasonal pattern?
This early-summer VIXY seasonal window likely reflects how institutional investors manage volatility hedges around the calendar. One likely driver is that many funds add protection into late winter and early spring, then systematically reduce VIX futures exposure as earnings season winds down and summer liquidity thins. That steady unwinding of hedges can pressure short-term VIX futures and, by extension, VIXY, even when headline risk feels elevated.
What is driving Trust VIX Short-Term Futures ETF (VIXY) today?
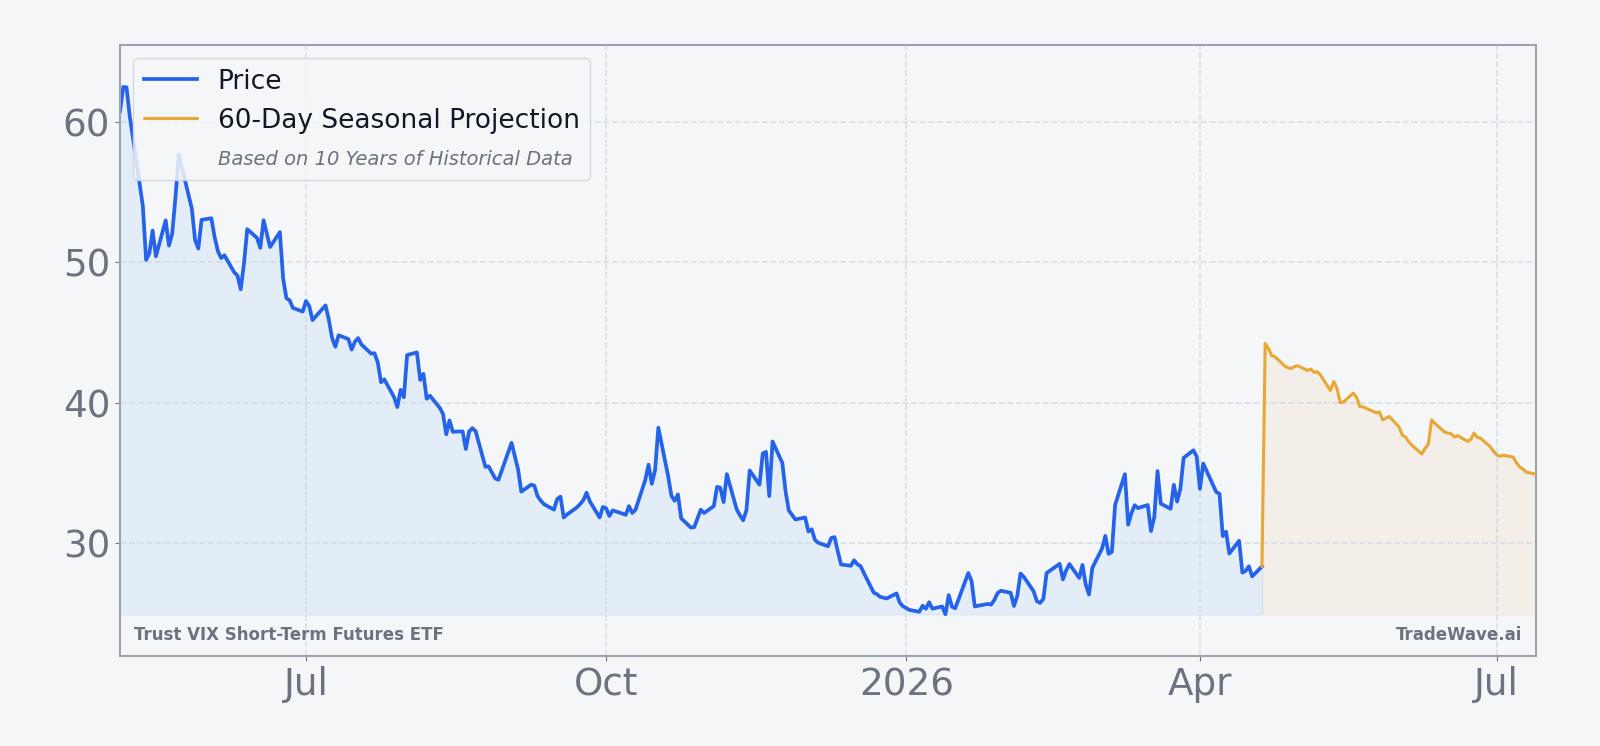
VIXY’s latest quote data are thin, but the backdrop is clear: the ETF has dropped 18.82% over the past month, sits well below its 50-day moving average of 30.49, and trades in a wide 52-week band between 24.81 and 76. That combination of a steep recent slide and a still-elevated long-term range tells you volatility longs have been under pressure while the product remains capable of large swings. For traders who use VIXY as a tactical hedge rather than a buy-and-hold position, the question is how that near-term weakness lines up with the historically bearish early-summer seasonal pattern.
The chart below shows VIXY’s past year of trading alongside a 60-day seasonal projection based on the upcoming window.
Structurally, Trust VIX Short-Term Futures ETF tracks a rolling basket of short-term VIX futures, so its behavior is driven by both spot volatility and the VIX futures term structure. When the curve is in contango, as it often is in calmer markets, the daily roll cost tends to erode VIXY’s value over time. That mechanical drag is one reason why the ETF has a history of grinding lower outside of major volatility spikes, and why a bearish seasonal window can coexist with occasional sharp upside bursts.
For equity investors, the VIXY seasonal outlook matters because it often lines up with how the broader market trades into the summer. A historically weak stretch for VIXY prices has usually meant a supportive backdrop for stocks, with realized volatility fading and hedging costs easing. If that pattern repeats, the early-May through early-July window could again be a period when long equity portfolios benefit from cheaper protection and a softer volatility regime, even if macro headlines remain noisy.
What should traders watch as this VIXY seasonal window approaches?
As May 5 approaches, the first thing to watch is whether VIXY continues to trade below its 50-day moving average or stages a pre-window squeeze. A continued grind lower into the start date would align with the historical pattern of weakness, while a sharp rally ahead of the window would set up a more crowded and potentially volatile backdrop. Either way, the 52-week range between 24.81 and 76 provides a clear frame for how much room VIXY has to move if volatility sentiment shifts.
Second, monitor how the VIX futures curve is shaped as the window opens. A steep contango would reinforce the historical tendency for VIXY to bleed lower over multi-week horizons, while a flatter or inverted curve would signal that markets are already pricing in stress, which has sometimes preceded choppier paths inside the window. Because the TradeWave Ratio for this pattern is 3.19, history suggests that when VIXY does move in this stretch, it often travels a meaningful distance in the short direction before the window closes.
Finally, traders should track whether realized equity volatility and macro event risk line up with the historical seasonality. If stocks stay firm and macro data remain orderly, a continued slide in VIXY would be consistent with the 10-for-10 record for shorts in this window. A sustained volatility shock that keeps VIXY elevated into late June or early July would be a clear break from the past decade’s behavior and a sign that this particular seasonal edge may be fading.
Sources
About this seasonal analysis
Seasonal pattern data is sourced from TradeWave.ai, which analyzes historical price behavior across annual calendar windows going back up to 30 years. Read the full data methodology or the book The 100-Year Pattern by Afshin Moshrefi (2026 edition). Past performance of seasonal patterns does not guarantee future results. This article is for informational purposes only and does not constitute investment advice.