Nasdaq QQQ Invesco ETF (QQQ) Eyes Triple-Digit Upside as 324-Day Bullish Window Nears
Nasdaq QQQ Invesco ETF is nearing a 324-day seasonal stretch that has never posted a loss in the past 17 years, a powerful backdrop for traders watching tech leadership and volatility into 2027.

What is the seasonal pattern for Nasdaq QQQ Invesco ETF (QQQ)?
Nasdaq QQQ Invesco ETF has risen in 17 of 17 years during this May-to-March window, with an average gain of 17.75% in winning years.
- 17 for 17 in this window, with average winning-year gains of 17.75% across a 324-day stretch.
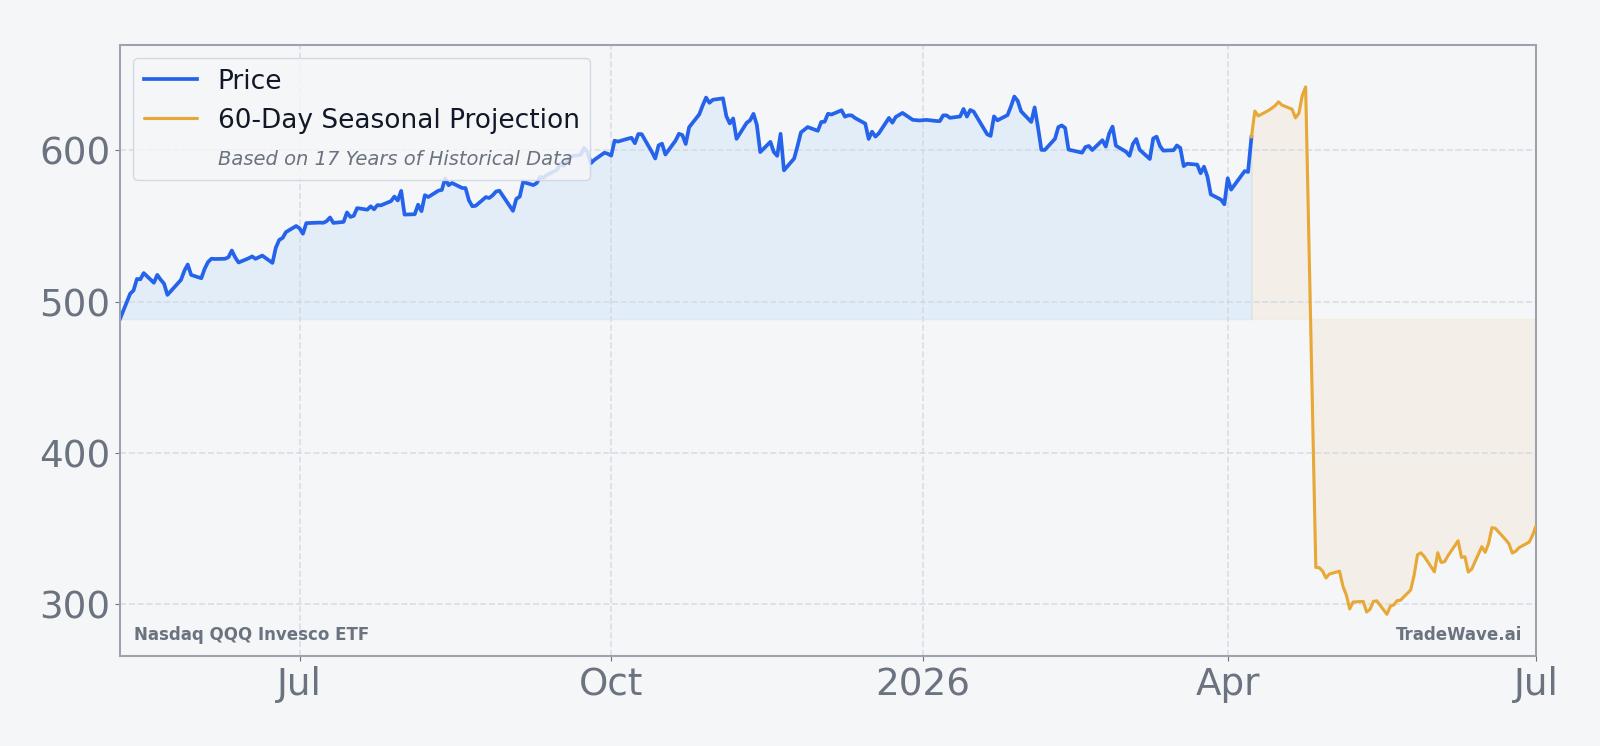
- Seasonal window starts May 9, 2026 and runs roughly through late March 2027, covering 17 years of historical data.
- Percent Profitable is 100%, with 17 winners and 0 losers over the full lookback period.
- Annualized return across the window is 17.11%, with a cumulative gain of 1,365% when stacking all years.
- Typical volatility is meaningful, with a standard deviation of 12.86% and a TradeWave Ratio of 1.91 indicating strong directional travel.
- The Sharpe ratio of 1.1 suggests historically favorable risk-adjusted returns for long exposure during this QQQ seasonal trend.
According to historical data from TradeWave.ai, this upcoming stretch for Nasdaq QQQ Invesco ETF has behaved very differently from an average calendar year. TradeWave.ai's seasonal database flags the May-to-March window as one of the most consistently positive regimes in QQQ's history.
How has Nasdaq QQQ Invesco ETF (QQQ) traded in this long seasonal window?
Nasdaq QQQ Invesco ETF has posted gains in every single iteration of this 324-day window across the past 17 years, averaging 17.75% per cycle for long positions. The next run of this pattern begins on May 9, 2026 and extends deep into the first quarter of 2027, giving tech-focused traders a long seasonal runway to consider alongside fundamentals and flows.
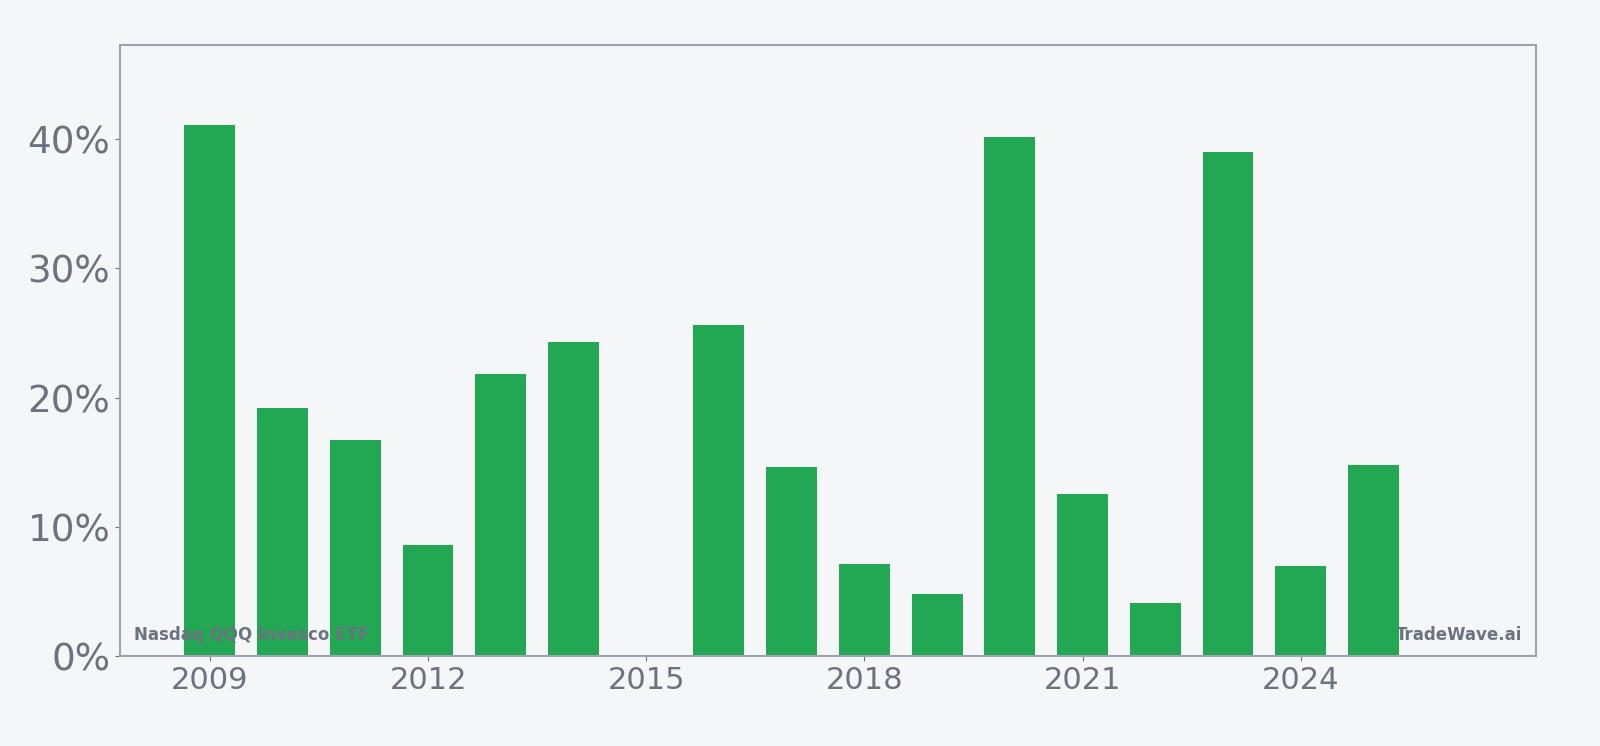
Trade direction for this setup is explicitly long, and the historical record backs that up. Across 17 years, Percent Profitable sits at 100%, with 17 winners and 0 losers, and an annualized return of 17.11% over the window. Average profit of 17.75% per cycle means that even the more modest years have added meaningful upside for investors who stayed in through the full period.
The distribution of outcomes is not just about the average. Median profit of 14.82% shows that half of the historical windows delivered at least mid-teens gains, while the standard deviation of 12.86% points to a wide but manageable spread of results. The Sharpe ratio of 1.1 indicates that, on a risk-adjusted basis, this QQQ seasonal trend has historically rewarded long exposure better than a random slice of the calendar.
Year-by-year net returns and intraperiod swings help clarify how much QQQ has typically moved in both directions inside this window.
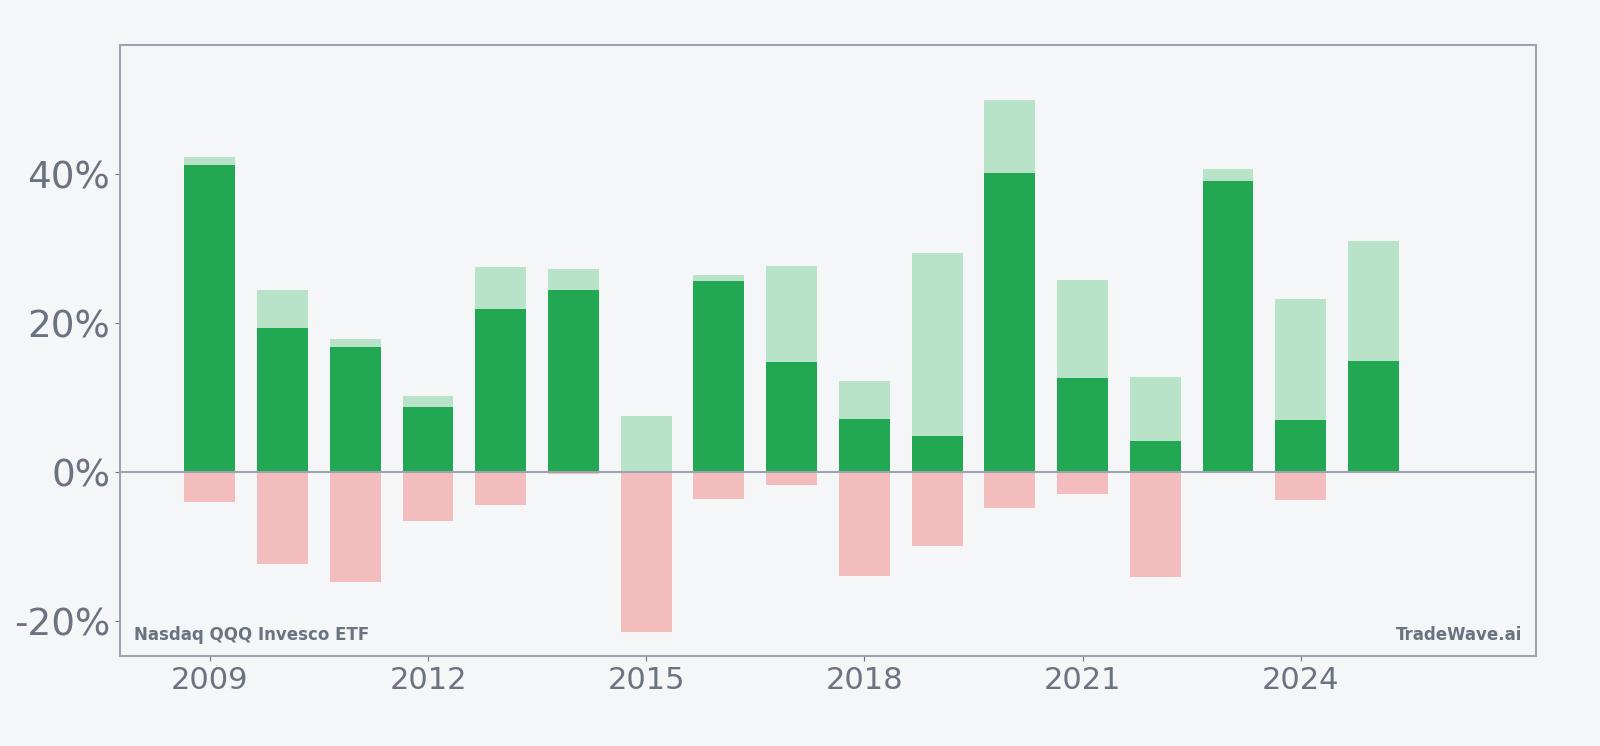
Looking at individual years, the strongest run in this pattern came in 2020, when QQQ gained 40.12% over the window, with a maximum favorable move of 49.82% and a worst drawdown of 4.8% from entry. At the other end of the spectrum, 2018 and 2022 still finished positive at 7.13% and 4.14% respectively, but both saw deeper adverse excursions, with worst intraperiod drawdowns of 13.96% and 14.12%. That mix of strong maximum favorable moves and occasional double-digit pullbacks is exactly what the TradeWave Ratio of 1.91 is capturing: QQQ has tended to travel far in the trade direction, but not in a straight line.
The seasonal trend chart shows that gains have typically accrued in waves rather than as a smooth climb. In several years, QQQ pushed higher early in the window, paused or pulled back mid-period, then accelerated again into the final third. The cumulative return profile across all 17 years stacks to 1,365%, which underscores how powerful this specific May-to-March Nasdaq QQQ Invesco ETF trading window has been for long exposure when viewed as a repeated pattern.
History does not guarantee future results; adverse excursions can be large even in winning windows, and traders should be prepared for volatility inside the pattern.
Why does Nasdaq QQQ Invesco ETF (QQQ) follow this seasonal pattern?
One likely driver is the way mega-cap tech earnings and guidance cluster from late spring through the following winter, which can keep growth expectations and momentum in focus for long stretches. Analysts have also pointed to institutional portfolio rebalancing and year-end benchmark chasing, which can funnel flows into Nasdaq-linked products as performance gaps open up. This QQQ seasonal pattern may also reflect recurring themes in the tech sector’s outlook, from holiday spending to new product cycles, that tend to support risk appetite across much of this window.
What is driving Nasdaq QQQ Invesco ETF (QQQ) today?
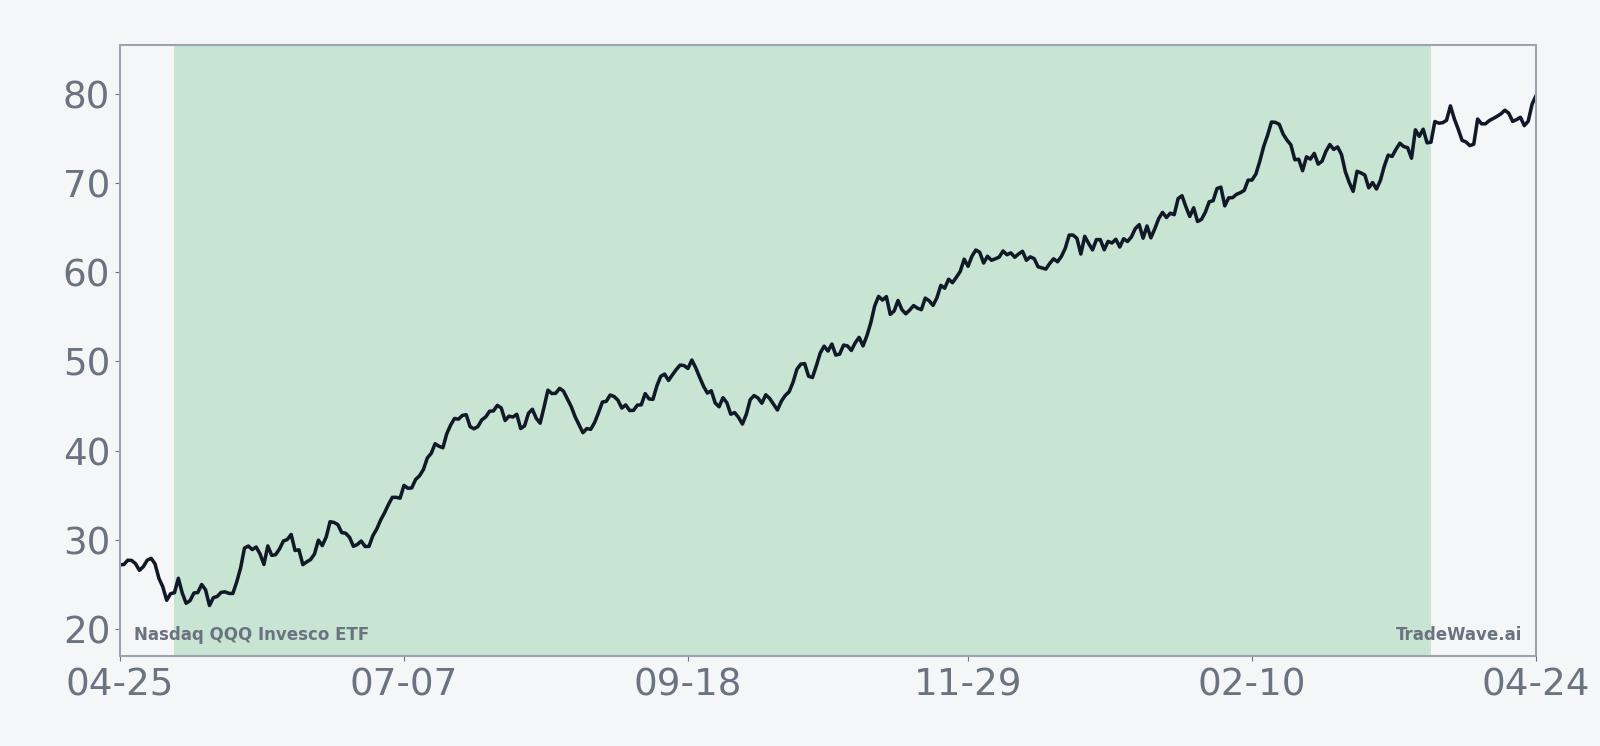
With QQQ trading near the upper end of its recent range and sitting between a 52-week low around 399.53 and a high of 636.60, investors are weighing how much of the tech-led rally is already priced in. Over the past month the ETF has slipped about 0.28%, a modest pause after a powerful multi-year run that has kept it at the center of growth and AI narratives.[2] A recent MarketBeat piece on Apr 7 highlighted “5 reasons” QQQ could still be headed for a triple-digit rally, citing factors such as the dominance of mega-cap tech, resilient earnings and the ETF’s role as a liquid vehicle for broad innovation exposure.[2] On Apr 8, Barchart framed QQQ’s position in the ETF landscape by comparing it with a new competitor product, underscoring how central the fund remains for retail and institutional traders looking for concentrated Nasdaq-100 exposure.[1]
The chart below situates the latest consolidation in QQQ within its past year of trading, alongside a 60-day seasonal projection.
How does QQQ’s exposure and macro backdrop line up with this seasonal trend?
Nasdaq QQQ Invesco ETF tracks the Nasdaq-100, giving investors a concentrated basket of large-cap growth names across technology, communication services and consumer discretionary. That tilt means the ETF is highly sensitive to macro themes such as the path of interest rates, AI investment cycles and corporate spending on cloud and software. The recent “market rally” narrative around QQQ has leaned heavily on expectations that earnings growth from these sectors can outrun any drag from tighter financial conditions, a view echoed in the bullish macro framing from MarketBeat’s April analysis.[2]
Because QQQ is one of the most heavily traded ETFs in the world, its flows often act as a barometer for risk appetite in growth stocks. When investors rotate toward cyclicals or value, QQQ can lag even if the broader market holds up, and the reverse is true when tech leadership reasserts itself. The historical seasonality for this May-to-March window has lined up with periods when mega-cap tech has tended to outperform, which helps explain why the pattern has been so consistently positive for long positions.
What should traders watch as this QQQ seasonal window approaches?
As May 9 approaches, the key watchpoints are whether QQQ can hold above its 50-day moving average, currently around 601.50, and how flows respond to any pullbacks toward the mid-500s.[1] A firm bid on dips would fit the historical pattern of strong maximum favorable moves with manageable drawdowns, while a deeper break toward the lower half of the 52-week range would mark a departure from the typical seasonal script. Traders should also track how upcoming earnings from the largest Nasdaq-100 constituents shape guidance for the back half of 2026, since those outlooks often set the tone for the entire window.
On the macro side, any shift in expectations for Federal Reserve policy or a surprise slowdown in tech spending could inject more volatility into this historically strong stretch. If QQQ continues to attract assets and remains the go-to vehicle for AI and growth exposure, that would reinforce the long-biased seasonal tendency. If flows fragment into rival products or rotate into other sectors, the pattern could still hold but with a different path, potentially featuring sharper mid-window swings before any year-end catch-up. Add it up: the May-to-March window has been 17 for 17 for QQQ, and how the ETF behaves around key support levels and macro catalysts will show whether this cycle can keep that streak alive.
Sources
- [1] Barchart, “QQQ Just Met Its Match With This New ETF. Here's Why It's a Win for Investors.” Apr 8, 2026.
- [2] MarketBeat, “5 Reasons the Invesco QQQ ETF Could Be Headed for a Triple-Digit Rally” Apr 7, 2026.
About this seasonal analysis
Seasonal pattern data is sourced from TradeWave.ai, which analyzes historical price behavior across annual calendar windows going back up to 30 years. Read the full data methodology or the book The 100-Year Pattern by Afshin Moshrefi (2026 edition). Past performance of seasonal patterns does not guarantee future results. This article is for informational purposes only and does not constitute investment advice.