S&P 500 (SPX) Has Rallied in 13 of 14 Years in This 81-Day May-July Window
S&P 500 is heading toward a historically strong 81-day seasonal window starting May 9, even as charts flag fatigue and macro risks keep volatility in play.

What is the seasonal pattern for S&P 500 (SPX)?
S&P 500 has risen in 13 of 14 years during this May 9–81-day window, with an average gain of 5.75% in winning years.
- 13-for-14 record in this window, with winning years averaging 5.75% gains and only one losing year across the sample.
- The upcoming seasonal window begins on May 9 and runs for 81 trading days, historically favoring long exposure in SPX.
- Percent Profitable stands at 93%, with 13 winners and 1 loser over the past 14 years in this specific S&P 500 trading window.
- Including the lone down year, the all-years average return is still a solid 5%, showing how strong the upside bias has been.
- Intraperiod swings have featured meaningful drawdowns in some years, so traders have had to sit through volatility even when the pattern finished higher.
- Across the full sample, cumulative gains from this recurring window add up to 104%, underscoring how powerful this slice of the calendar has been for longs.
According to historical data from TradeWave.ai, this stretch of the calendar has behaved very differently from an average summer for the index, and the next iteration is less than a month away.
How has S&P 500 (SPX) traded in the upcoming May–July window?
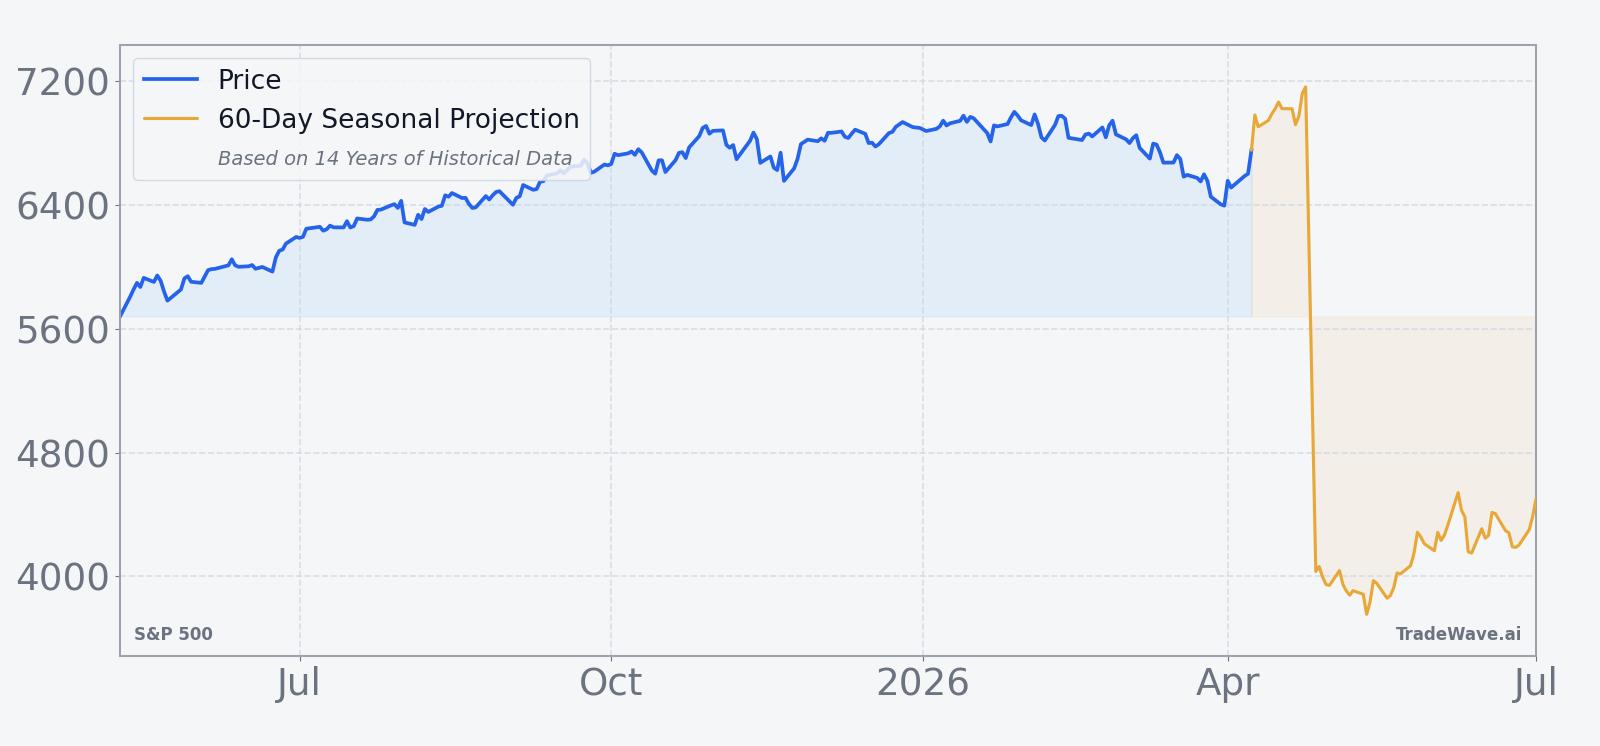
S&P 500 has climbed in 13 of the past 14 years during the 81 trading days starting May 9, averaging 5.75% gains in the winning years. Today the index is hovering near record territory and only about 0.3% below its 52-week high of 7,002.28, after a modest 0.02% advance over the past month that hints at slowing momentum.[4] That combination of stretched levels and a historically strong SPX seasonal trend turns this otherwise routine late-spring window into a key test of whether the bull market can keep grinding higher.
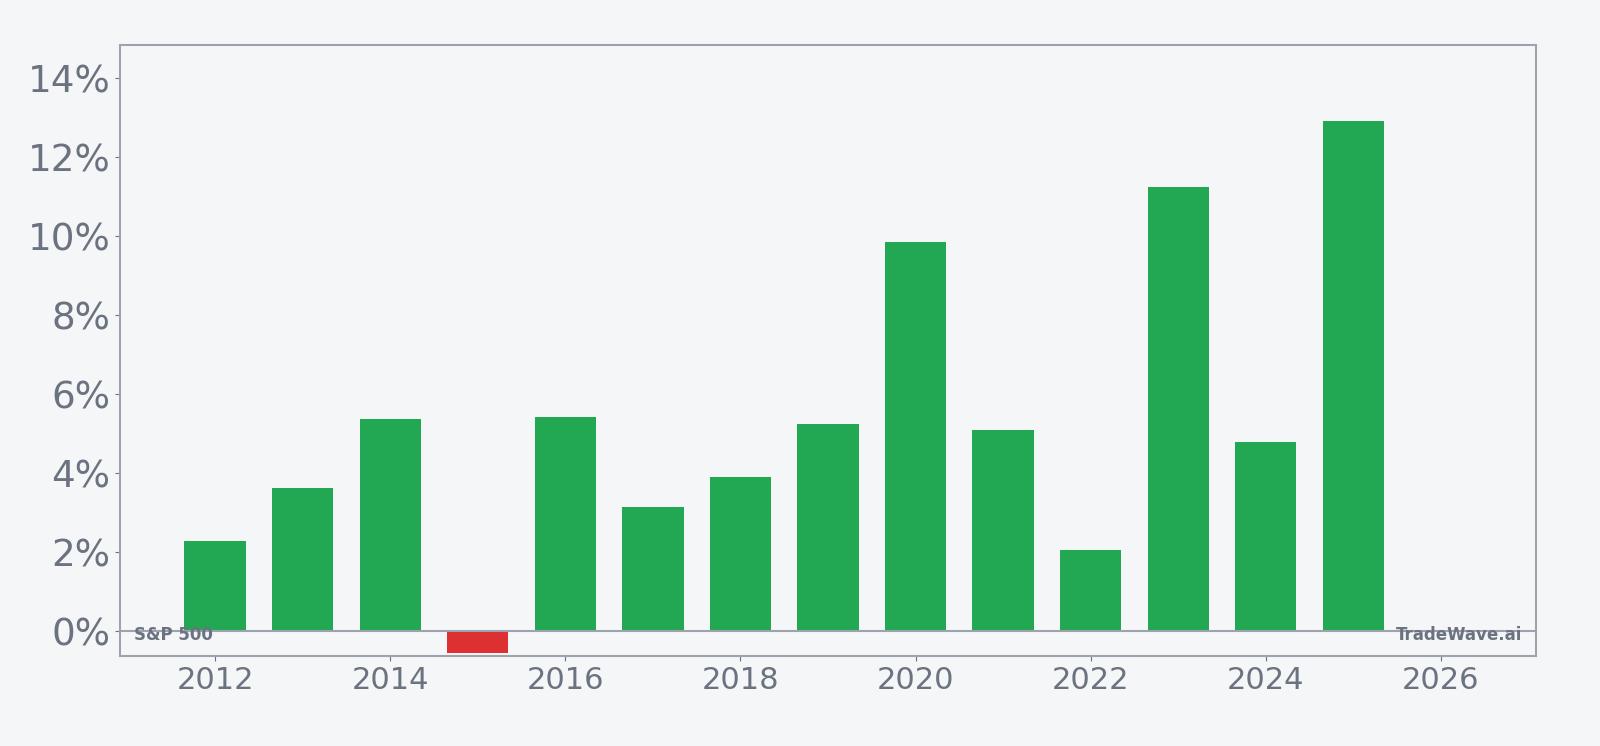
Trade direction for this pattern is explicitly long, and the track record is unusually clean for a major index. Across the 14-year lookback, S&P 500 finished this May–July stretch higher in 13 years and lower in just one, producing a 93% win rate for long exposure. The average gain in those up years was 5.75%, while including the lone down year trims the all-years average to 5%, which is still a strong outcome for an 81-day window.
The per-year breakdown shows how consistent that upside has been. In 2023 the index gained 11.24% during the window, with a maximum favorable move of 11.84% and only a shallow 0.49% intraperiod drawdown from entry. In 2020, during the post-pandemic rebound, SPX logged a 9.84% net return with a 11.94% best run-up but also had to absorb a 5.58% worst drawdown along the way. Even more routine years such as 2016, 2017 and 2019 still delivered mid-single-digit gains, reinforcing the idea that this is typically a grind-higher environment rather than a coin flip.
The one clear blemish is 2022, when the index finished the window up just 2.03% but experienced a maximum adverse move of 8.88% from the entry level. That year illustrates the main risk in this pattern: even when the final result is positive, the path can involve sharp pullbacks that test conviction. On the other side of the spectrum, 2025 stands out with a 12.9% net gain and a 13.09% peak run-up, showing how powerful the window can be when macro and positioning line up with the historical bias.
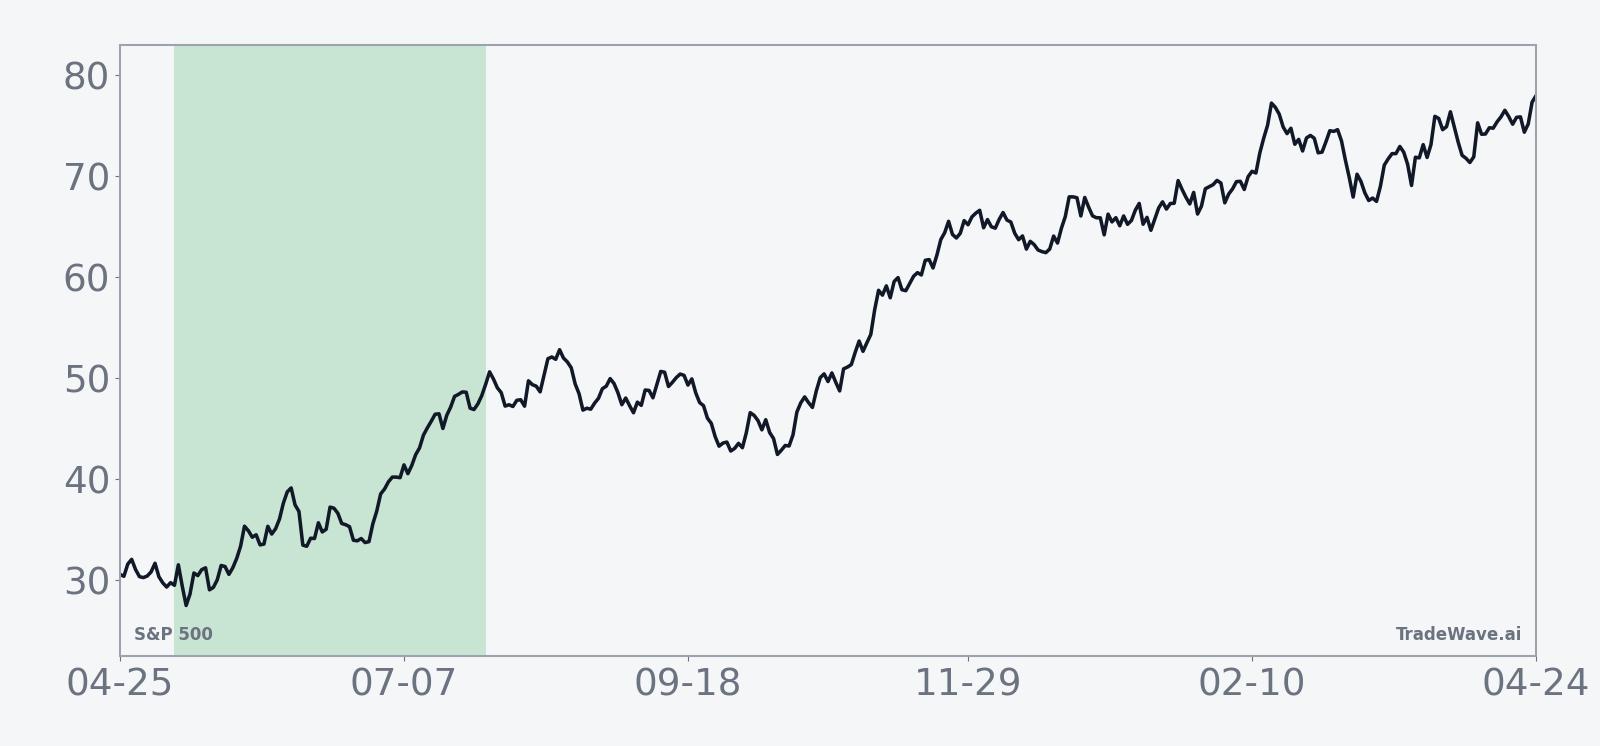
The historical seasonal average curve for this window slopes higher in a fairly steady fashion. Returns tend to build gradually rather than spiking in a single week, with modest early gains that compound into a stronger profile by the back half of the window. That shape suggests a backdrop where dips have historically been bought and rallies have not immediately reversed, consistent with a constructive risk-on tone for the broader market.
A second view that layers in best and worst intraperiod swings shows how much room the index has typically had to roam inside this bullish window.
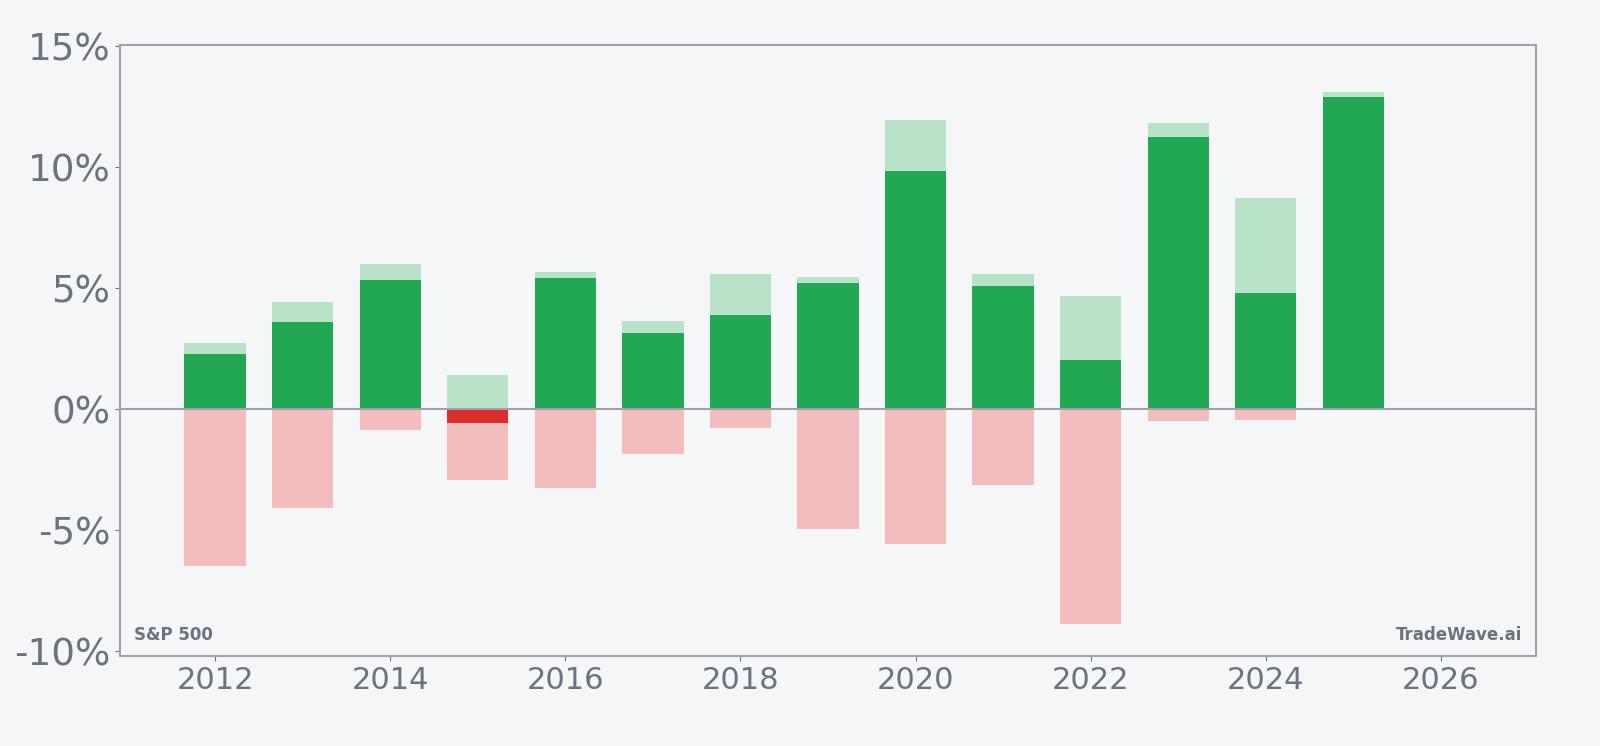
The combined net/MFE/MAE bars show a pattern of sizable upside potential with manageable but sometimes sharp downside swings. In strong years such as 2020, 2023 and 2025, the maximum favorable move pushed into double digits while the worst drawdowns stayed mid-single digits or better, which fits a bullish but volatile tape. In more challenging years like 2019 and 2022, the worst intraperiod declines approached or exceeded 5%, reminding traders that even a historically friendly SPX seasonal window has delivered meaningful shakeouts before finishing higher. Add it up: 13 winners, one modest loser and 104% cumulative gains across the sample make this one of the more reliable long-biased stretches on the S&P 500 calendar.
History does not guarantee future results, and even in winning years the worst intraperiod drawdowns (MAE) have been large enough to challenge risk limits.
Why does S&P 500 (SPX) follow this seasonal pattern?
This May–July strength likely reflects a mix of earnings and positioning dynamics. One likely driver is the clustering of second-quarter guidance updates and midyear portfolio rebalancing, which can support large-cap growth and index heavyweights after first-quarter results are digested. Analysts have also pointed to sector rotation into cyclicals and summer travel and spending themes during this period, which tends to favor the broad index when economic conditions are stable.
What is driving S&P 500 (SPX) today?
The near-term backdrop for S&P 500 is more complicated than the clean seasonal record suggests. In early April, technical analysts described the index as showing “technical improvement” after recent declines, but warned that bearish chart structures and macro risks such as war headlines and sticky inflation remain in play.[4] Earlier this year, strategists framed 2026 as a stock picker’s market with expected SPX gains in the high single digits, supported by easing tariff pressures and potential Federal Reserve rate cuts but constrained by high U.S. debt and geopolitical tensions.[1][2][3]
The chart below situates the latest consolidation against that backdrop and overlays the next 60 days of the historical seasonal projection.
Macro narratives around the index have swung over the past year. In June 2025, Barclays lifted its year-end SPX target to 6,050, citing normalized earnings growth and limited incremental tariff drag.[1] By late 2025, technical commentators were flagging “unusual” weekly patterns and “clear” signals that hinted at a more fragile tape, even as the index pushed to new highs.[5][6] In early 2026, concerns about a potential AI bubble and the concentration of gains in mega-cap tech added another layer of risk to the bullish consensus.[3]
Against that backdrop, the upcoming May 9 seasonal window matters because it has historically provided a tailwind just as investors debate whether to fade strength or lean into it. If the index can hold near its 50-day moving average around 6,768 and avoid deep breaks toward the 52-week low near 4,835, the historical pattern suggests that late-spring dips have often been opportunities rather than the start of lasting bear phases.[4] If instead macro shocks or an unwind in crowded AI trades trigger a deeper drawdown, this would mark a rare year where the SPX seasonal trend failed to bail out early sellers.
Sources
- [1] Reuters, "Barclays lifts S&P 500 year-end target to 6,050," Jun 4, 2025.
- [2] Reuters, macro commentary on tariffs, earnings growth and Fed policy for S&P 500, 2025–2026.
- [3] Seeking Alpha, "S&P 500: Prepare For Change," Apr 5, 2026.
- [4] Seeking Alpha, technical outlook noting recent declines, recovery and macro risks for S&P 500, Apr 5, 2026.
- [5] Seeking Alpha, "S&P 500: This Is Unusual," Jul 6, 2025.
- [6] Seeking Alpha, "S&P 500: The Signals Are Clear," Oct 26, 2025.
About this seasonal analysis
Seasonal pattern data is sourced from TradeWave.ai, which analyzes historical price behavior across annual calendar windows going back up to 30 years. Read the full data methodology or the book The 100-Year Pattern by Afshin Moshrefi (2026 edition). Past performance of seasonal patterns does not guarantee future results. This article is for informational purposes only and does not constitute investment advice.