7-for-7: S&P 500 SPDR (SPY) Has Rallied Every 344-Day Midterm-to-Pre-Election Window
S&P 500 SPDR is trading off recent highs as Wall Street heads toward a 344-day midterm-to-pre-election seasonal window that has never posted a loss in this dataset.

What is the seasonal pattern for S&P 500 SPDR (SPY)?
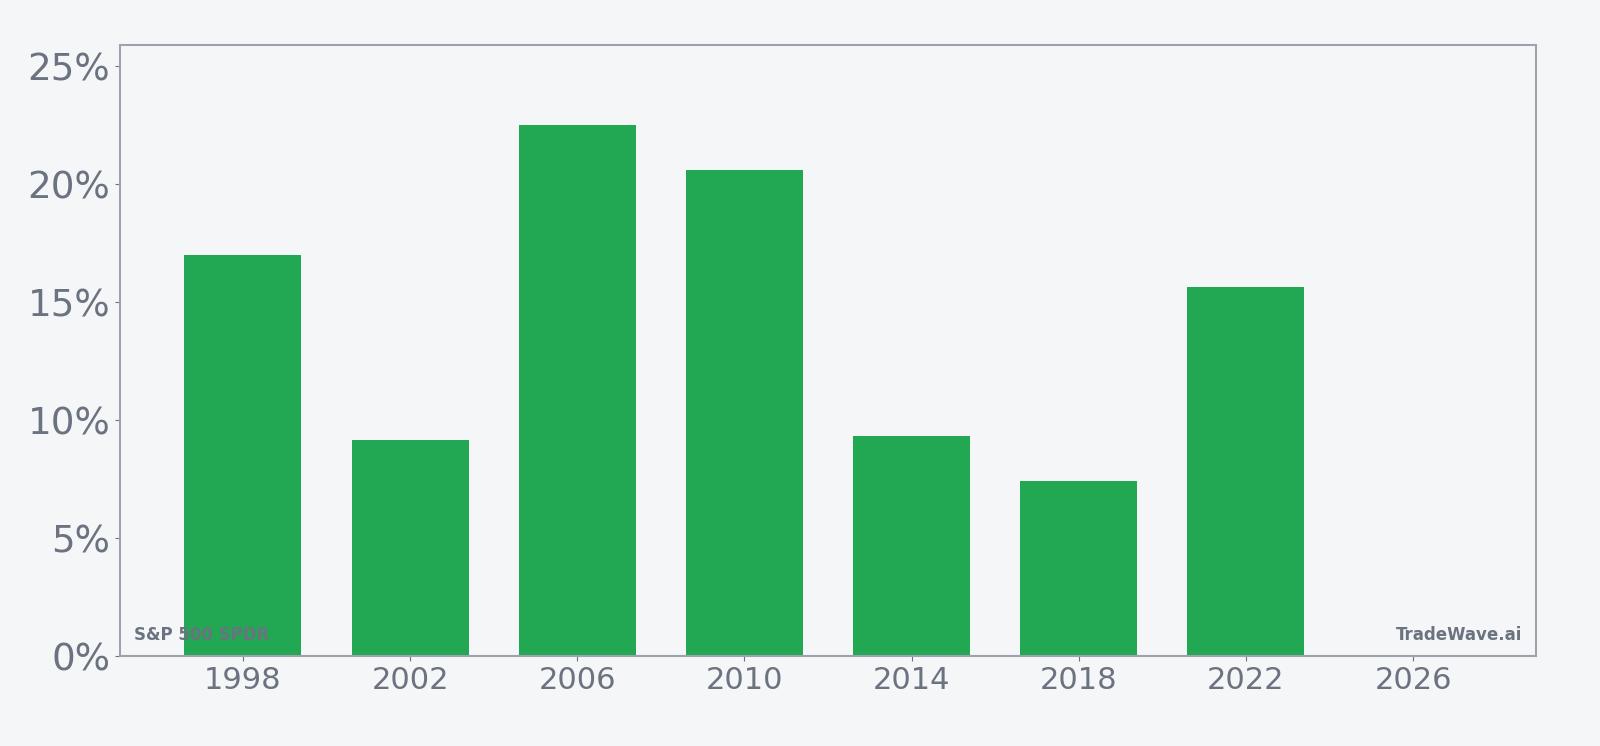
S&P 500 SPDR has risen in 7 of 7 midterm-to-pre-election year windows starting around Jul 11, with an average gain of 14.52% in winning years.
- 7 for 7 in this window, with S&P 500 SPDR averaging 14.52% gains in winning years across the last seven midterm election cycles.
- The upcoming window begins Jul 11, 2026 and runs 344 trading days, spanning the heart of the midterm election year into the following pre-election year.
- Percent Profitable is 100%, with 7 winners and 0 losers in this midterm-to-pre-election S&P 500 SPDR trading window.
- Avg Profit of 14.52% reflects strong upside in each cycle, while a Sharpe ratio of 1.8 points to favorable risk-adjusted returns.
- The TradeWave Ratio of 1.76 suggests price has typically traveled meaningfully in the long direction within the window, even before final outcomes.
- Individual years have still seen sizable drawdowns inside the window, with adverse moves exceeding 10% in several cycles before finishing higher.
According to historical data from TradeWave.ai, this midterm-to-pre-election stretch has behaved very differently from an average year for the S&P 500 SPDR. The next section looks at how that pattern has played out across the last seven cycles and what it could mean for the coming year.
How has S&P 500 SPDR (SPY) traded in past midterm-to-pre-election windows?
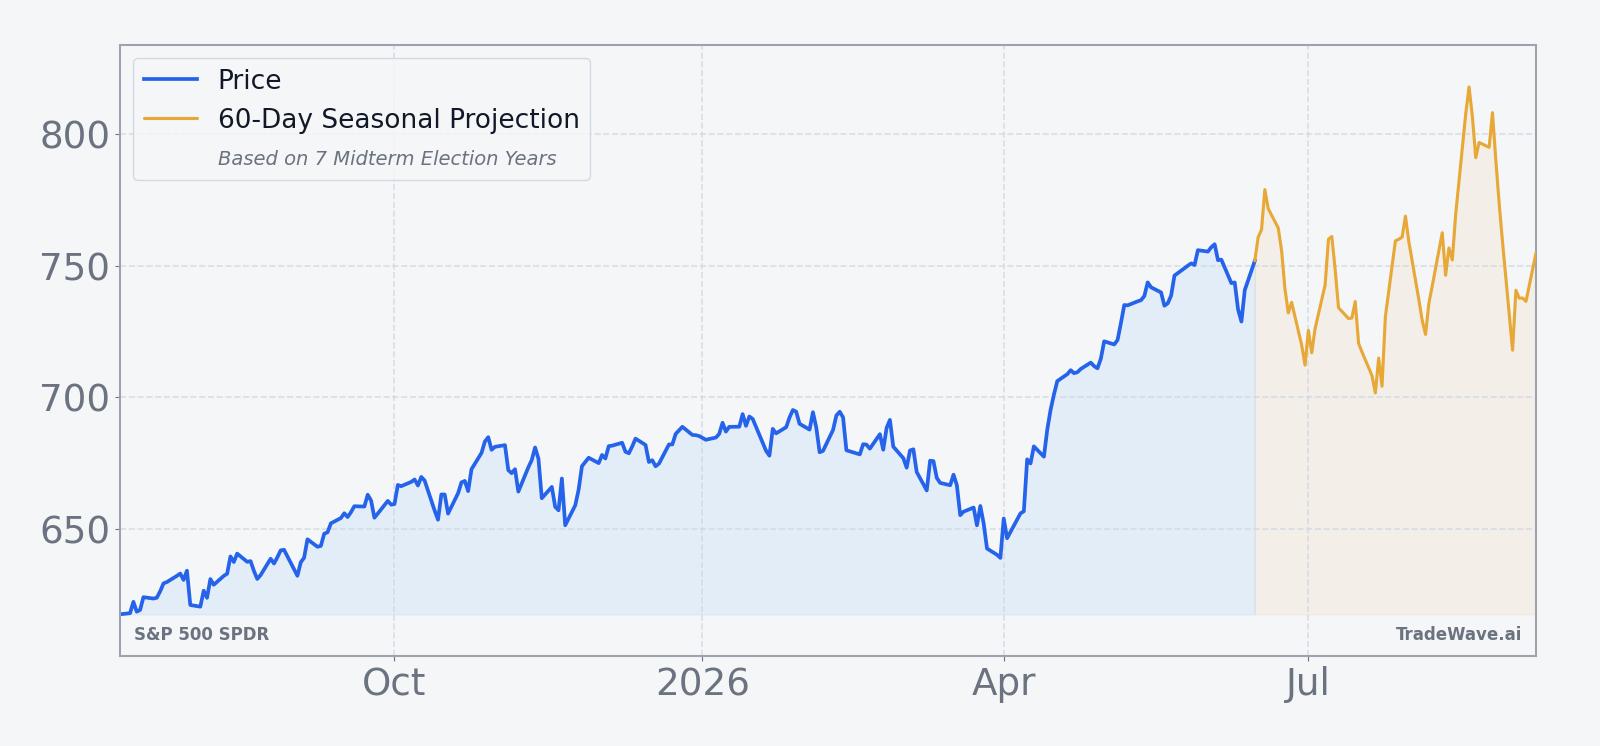
S&P 500 SPDR has finished higher in every one of the last seven midterm-to-pre-election windows starting around Jul 11, posting a cumulative 156% gain across those cycles. Today the ETF closed at 727.41, down 1.3% on the session and sitting about 4.3% below its 52-week high of 760.40.[1]
Because this pattern is grouped by the presidential election cycle, it captures how policy uncertainty, fiscal stance and Fed reaction functions tend to evolve from the midterm election year into the year before the presidential election. Historically that transition has lined up with a friendlier risk backdrop for equities, and SPY’s midterm-to-pre-election seasonal trend reflects that bias.
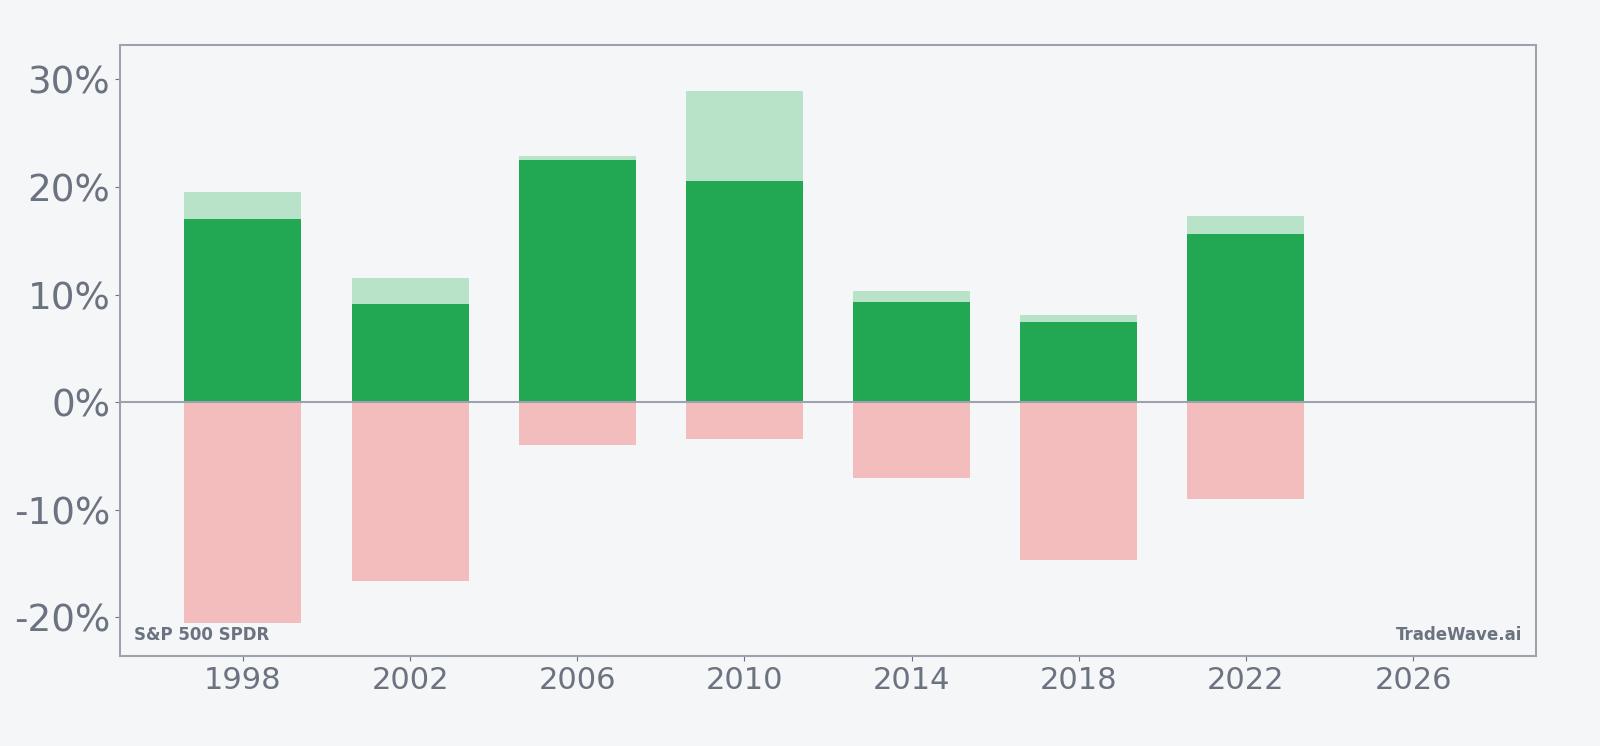
A second view shows how each year’s net return lines up with its best and worst intraperiod swings.
Across the seven midterm election years in this sample, the trade direction is long and the record is clean: 7 winners, 0 losers, with an average profit of 14.52% and a median outcome of 15.64%. The strongest year in the set was 2006, when SPY gained 22.51% in the window, while the softest was 2018, which still finished up 7.42% despite a volatile backdrop. Add it up and the cumulative gain across all seven windows is 156%, which is unusually consistent for such a long regime.
The intraperiod path has not been smooth. In 1998, SPY’s best point-to-peak move inside the window reached 19.56%, but the worst drawdown from entry was a deep 20.56% before the ETF recovered to finish higher. In 2002, the maximum favorable move was 11.51% against a 16.64% adverse swing, while 2018 saw an 8.12% run-up paired with a 14.69% drawdown. Those maximum favorable and adverse excursions show that even in winning years, investors have had to sit through double-digit swings in both directions.
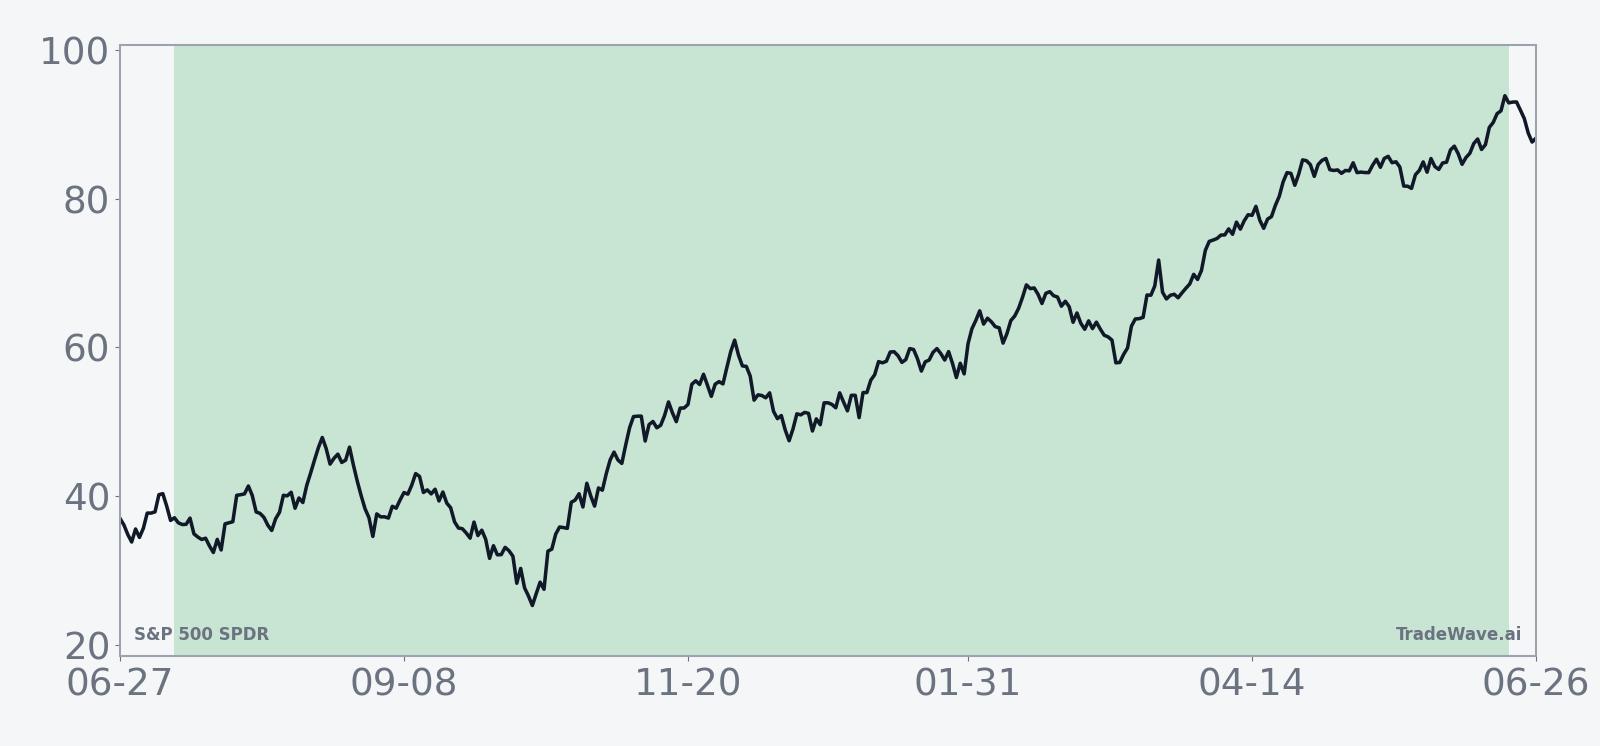
The typical seasonal trend line slopes higher through most of the 344 days, with gains tending to build as the window progresses rather than arriving in a single burst. That fits the broader narrative of the midterm-to-pre-election “two-playbook” structure: choppier trading earlier in the midterm year, followed by a more persistent climb once policy and Fed paths are clearer. The cumulative return chart for this pattern shows a steady staircase effect rather than a jagged sawtooth, which is rare for such a long S&P 500 SPDR trading window.
History does not guarantee future results; adverse excursions can be large even in winning windows, and investors in prior cycles have faced drawdowns of more than 10% inside this pattern before seeing it finish higher.
Why does S&P 500 SPDR (SPY) follow this seasonal pattern?
One likely driver is the way the policy calendar clusters around midterm elections, with fiscal decisions, regulatory shifts and Fed communication often clearing up as the cycle moves into the year before the presidential election. Analysts have also pointed to institutional portfolio repositioning, as asset managers lean back into risk once midterm uncertainty fades and earnings visibility improves. This pattern may reflect that combination of reduced policy risk and renewed risk appetite, which has historically favored broad equity exposure through SPY in this specific stretch of the cycle.
What is driving S&P 500 SPDR (SPY) today?
S&P 500 SPDR slipped 1.3% to 727.41, trading between an intraday low of 725.48 and a high of 738.38 on volume of about 43.3 million shares, versus a 20-day average near 51.4 million.[1] The ETF is about 4.3% below its 52-week high of 760.40 and well above its 52-week low near 581.97, with price still hovering above the 50-day moving average around 719.32, a sign that the broader uptrend remains intact despite the latest pullback.[1]
The chart below situates the latest move in its recent multi-month context alongside a short-term seasonal projection.
Macro expectations around inflation and the Federal Reserve remain the main narrative driver for SPY. Core PCE inflation readings and labor-market surprises have repeatedly reset rate-cut expectations, swinging both Treasury yields and equity risk appetite in the process.[1][2] Strategists at major banks have argued that eventual Fed easing could support U.S. equities while still capping forward returns, a backdrop that fits with SPY grinding higher but with more modest gains than in earlier bull-market phases.[3]
That macro backdrop matters for the upcoming seasonal window. The historical midterm-to-pre-election pattern has delivered strong long-side results even in years when growth or policy headlines looked shaky at the start. If the Fed does move toward rate cuts while inflation cools, the combination of a supportive policy shift and a historically favorable SPY seasonal trend could reinforce each other. If inflation or growth data surprise the other way, the same seasonal window has shown it can still deliver gains, but only after investors absorb sizable drawdowns along the way.
What should traders watch as this SPY seasonal window approaches?
First, the calendar. The next iteration of this 344-day window begins on Jul 11, 2026, and runs deep into the following pre-election year, overlapping the long midterm-to-pre-election regime that has historically been one of the strongest stretches for the S&P 500. Traders will be watching how SPY behaves into that start date, especially if the ETF remains near the upper end of its 12-month range.
Second, key macro catalysts. Upcoming inflation prints, jobs data and Fed communication will shape whether the policy backdrop into late 2026 looks more like the stronger years in this pattern, such as 2006 and 2010, or the more volatile but still positive years like 1998 and 2018.[1][2][3] A path of gradual disinflation with measured easing would rhyme with prior strong midterm-to-pre-election cycles, while renewed inflation pressure or growth scares could increase the odds of deeper intraperiod drawdowns even if the window ultimately finishes higher.
Third, levels and volatility. On the chart, traders will focus on the 50-day moving average near 719 and the 52-week high around 760 as reference points for how much room SPY has to run or retrace before the seasonal window opens.[1] A break below the 50-day with rising volume would signal that any eventual seasonal tailwind may have to work through a more serious correction first, while a sustained hold above that trend line into July would echo the stronger historical setups.
Finally, behavior inside the window will be the real test of the pattern. If SPY enters the period and quickly starts to build gains while intraperiod drawdowns stay relatively contained compared with past cycles, that would be consistent with the historical 100% win rate. If instead the ETF spends long stretches chopping sideways or suffering deeper-than-usual adverse moves without recovering, it would be an early sign that this iteration may diverge from the textbook midterm-to-pre-election script. Either way, the historical record gives traders a clear map of how this window has behaved before, even if the next cycle writes its own story.
Sources
About this seasonal analysis
Seasonal pattern data is sourced from TradeWave.ai, which analyzes historical price behavior across annual calendar windows going back up to 30 years. Read the full data methodology or the book The 100-Year Pattern by Afshin Moshrefi (2026 edition). Past performance of seasonal patterns does not guarantee future results. This article is for informational purposes only and does not constitute investment advice.