DB Agriculture Fund Invesco (DBA) Has Fallen in 8 of 10 Years in This 18-Day June Window
DB Agriculture Fund Invesco is trading just below its recent peak as it enters an 18-day June seasonal window that has historically favored short positions, a key backdrop for traders watching crop-year risk and inflation hedges.
What is the seasonal pattern for DB Agriculture Fund Invesco (DBA)?
DB Agriculture Fund Invesco has fallen in 8 of 10 years during this mid-June 18-day window, with an average gain of 4.46% in winning short years.
- 8 for 10 in this window, with winning short years averaging 4.46% gains and a 3% average across all years.
- Seasonal window runs 18 trading days from Jun 10, historically favoring short exposure in DBA.
- Percent Profitable is 80%, with 8 winners and 2 losers for the short-side pattern over the past decade.
- Avg Profit reflects only the profitable short years, while Avg Profit - All folds in the two losing years to show the full-cycle impact.
- TradeWave Ratio of 1.67 suggests price often travels meaningfully in the trade direction within the window before final settlement.
- Intraperiod swings have included sizable adverse moves in some years, underscoring that short setups here can be volatile.
According to historical data from TradeWave.ai, this specific June stretch has behaved differently from an average month for DBA, with a clear short-side bias that traders often overlook.
How has DB Agriculture Fund Invesco (DBA) traded in this June seasonal window?
DB Agriculture Fund Invesco has delivered profitable short trades in 8 of the past 10 years during the 18 trading days starting Jun 10, with winning years averaging 4.46% gains for bears. The ETF closed Tuesday at 26.33, up 0.17% on the day and about 8.7% below its 52-week high of 28.84, after sliding 7.24% over the past month as agriculture prices cooled.[1]
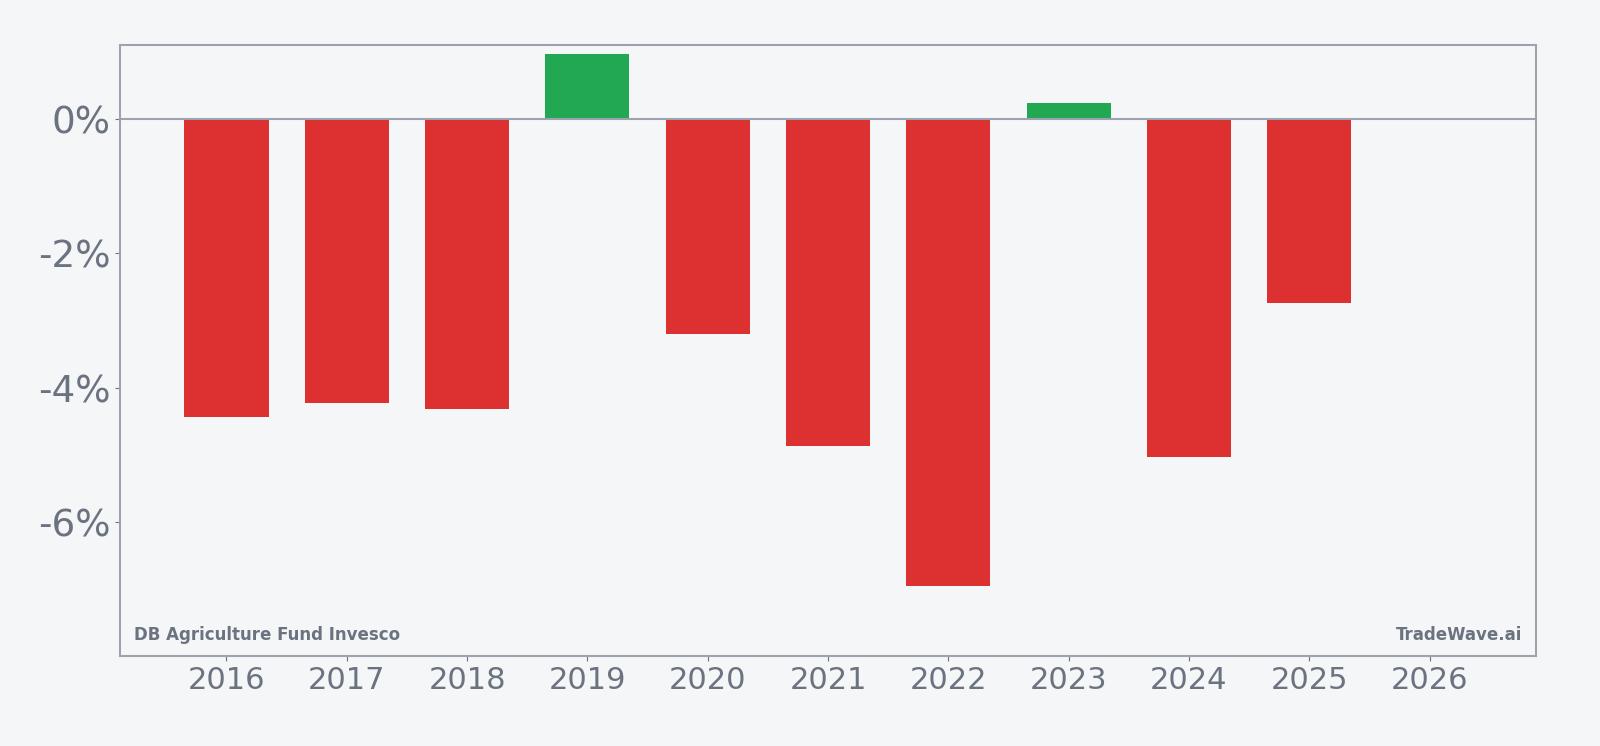
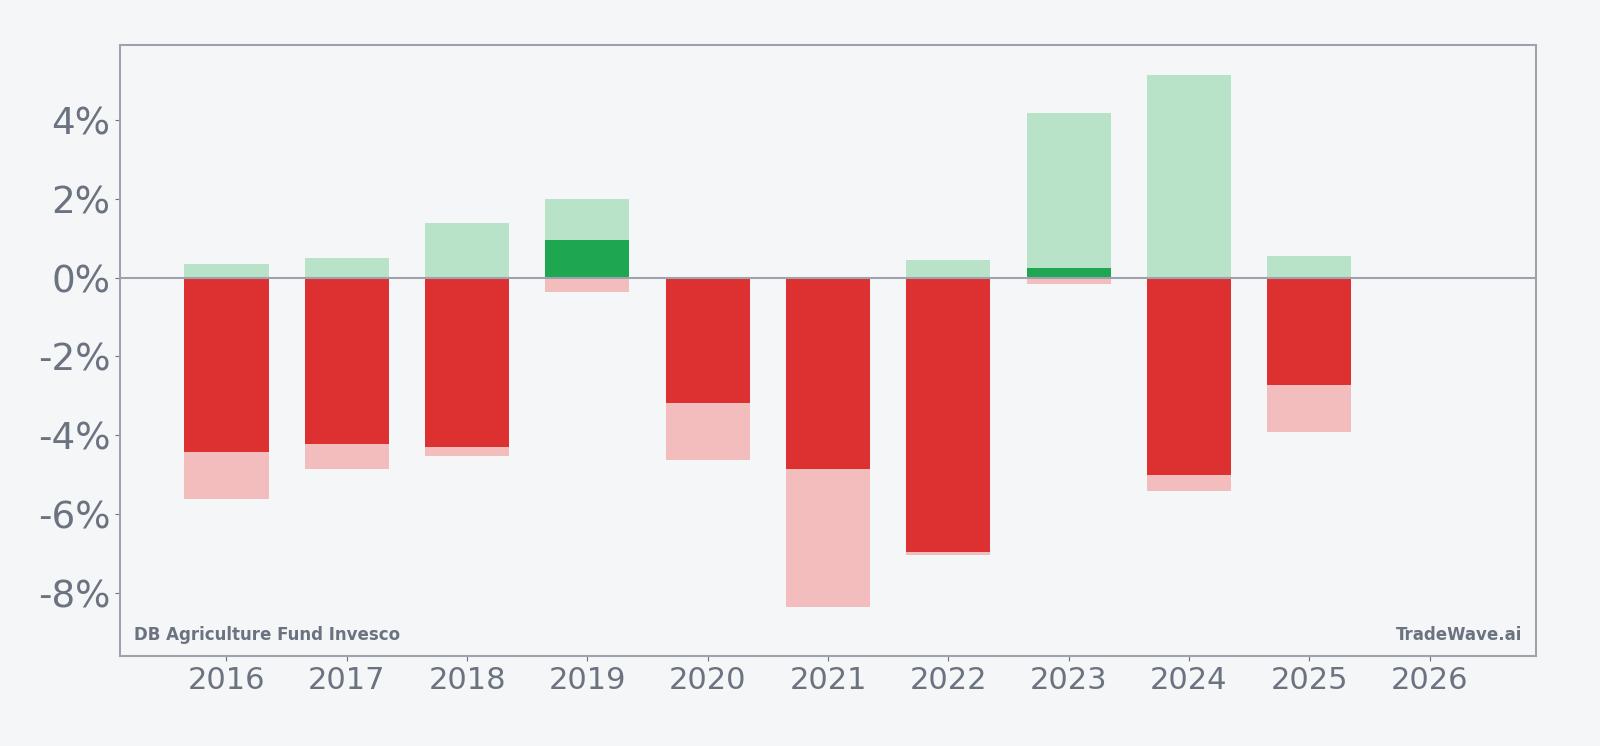
Year-by-year bars with maximum favorable and adverse moves show how far DBA has tended to swing inside this window.
Across the decade, the pattern has been consistently bearish for DBA in this slice of the calendar. Percent Profitable sits at 80%, with 8 winning short years and just 2 losing ones, and the all-years average outcome is a 3% gain for shorts despite those losing seasons. The strongest short-side years, such as 2022 with a 6.95% net return and 2024 with a 5.02% gain for bears, show that when the pattern works it can move quickly.
Avg Profit of 4.46% captures only the profitable short years, while Avg Profit - All at 3% blends in the two losing years to give a more conservative read on the window. The median outcome of 4.26% is close to the average winner, which suggests the distribution of short-side gains has not been dominated by a single outlier year. A Sharpe ratio of 1.35 for this window points to a favorable risk-adjusted profile based on end-of-window results.
The intraperiod picture is more volatile than the final numbers suggest. In 2021, for example, DBA delivered a 4.86% gain for shorts by the end of the window, but the worst adverse move from entry reached 8.36%, meaning the ETF rallied sharply against the trade before rolling over. By contrast, 2019 and 2023 were mild, with small net moves and limited adverse swings, showing that not every year brings a dramatic slide.
The TradeWave Ratio of 1.67 indicates that, on average, DBA tends to travel meaningfully in the short direction at some point during the window, even when the final close is more muted. Maximum favorable excursions in several years, including 2024 with a 5.14% peak move in the trade direction, highlight that intrawindow downside in DBA has often been larger than the final net change. For traders, that means timing and risk management inside the window can matter as much as the closing print.
Viewed through the cumulative seasonal trend, the typical path shows DBA softening early in the window and then grinding lower rather than collapsing in a single day. The 10-year average curve slopes steadily in favor of shorts, with only brief countertrend bumps. That profile lines up with the macro backdrop of early summer crop updates and positioning shifts in agriculture futures, where rallies can fade as supply expectations firm up.
History does not guarantee future results, and adverse excursions can be large even in winning windows, so traders using this pattern still face meaningful drawdown risk.
Why does DB Agriculture Fund Invesco (DBA) follow this seasonal pattern?
This June window likely reflects commodity supply and demand seasonality rather than anything unique to DBA itself. Analysts have pointed to the early crop-year period, when planting progress, weather updates and initial yield expectations start to firm, as a time when speculative long positions in grains and oilseeds can be pared back.[1] Because DBA holds a diversified basket of agriculture futures, including a heavy allocation to grains and oilseeds, those futures-market adjustments can translate into a recurring soft patch for the ETF.
What is driving DB Agriculture Fund Invesco (DBA) today?
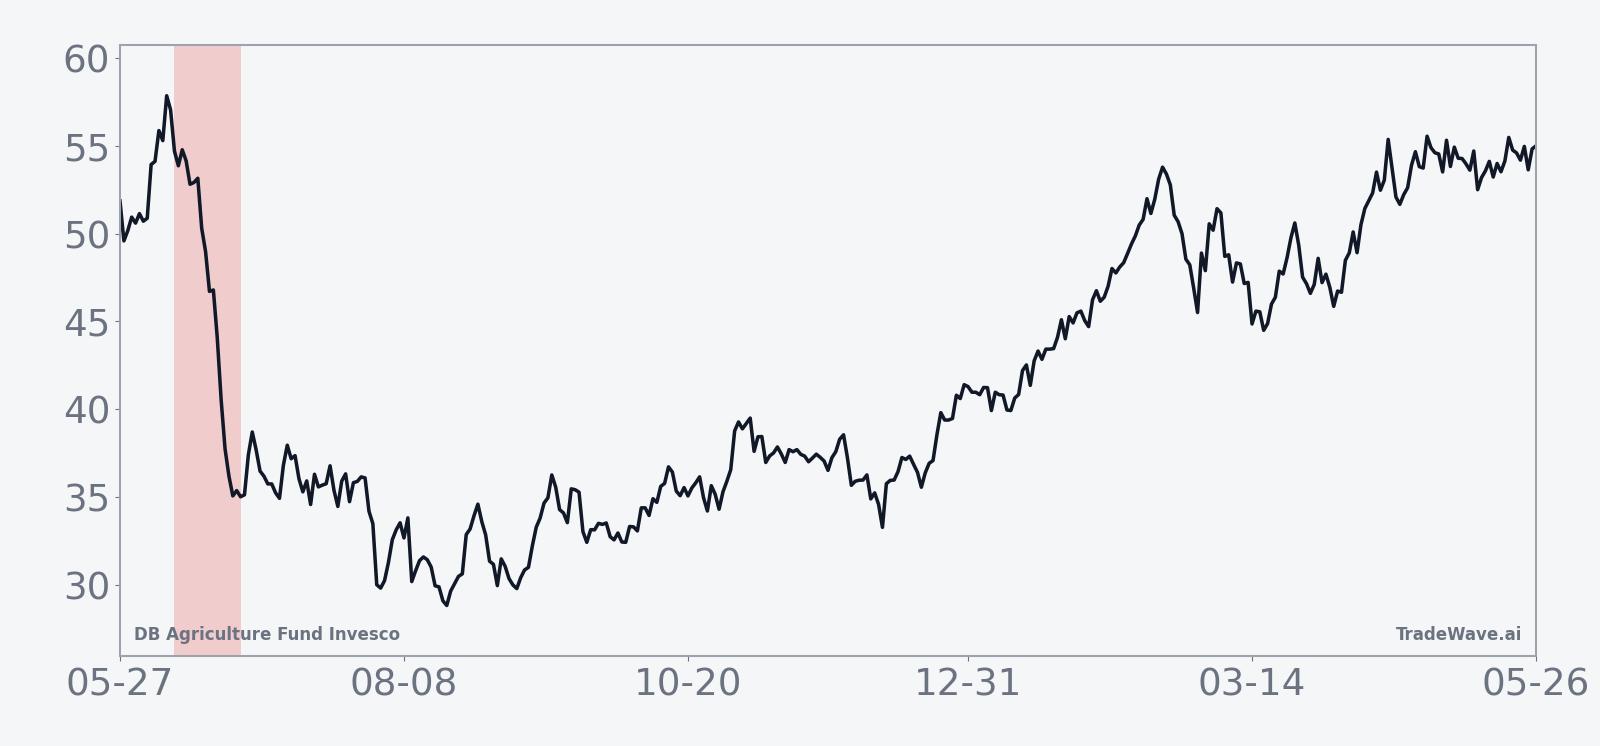
DB Agriculture Fund Invesco finished Tuesday at 26.33, up 0.17% on the session, with roughly 695,000 shares changing hands against a 20-day average volume of about 1.49 million.[1] The ETF is about 8.7% below its 52-week high of 28.84 and roughly 10.6% above its 52-week low near 23.80, leaving it in the middle of its one-year range after a 7.24% slide over the past month.[1] That pullback has unfolded even as macro commentary around the 2026 crop year has leaned constructive on agriculture prices, citing rising production costs, firm global demand and weather and geopolitical risks as potential upside drivers for the complex.[1]
The chart below situates the latest move in its recent multi-month context alongside a 60-day seasonal projection.
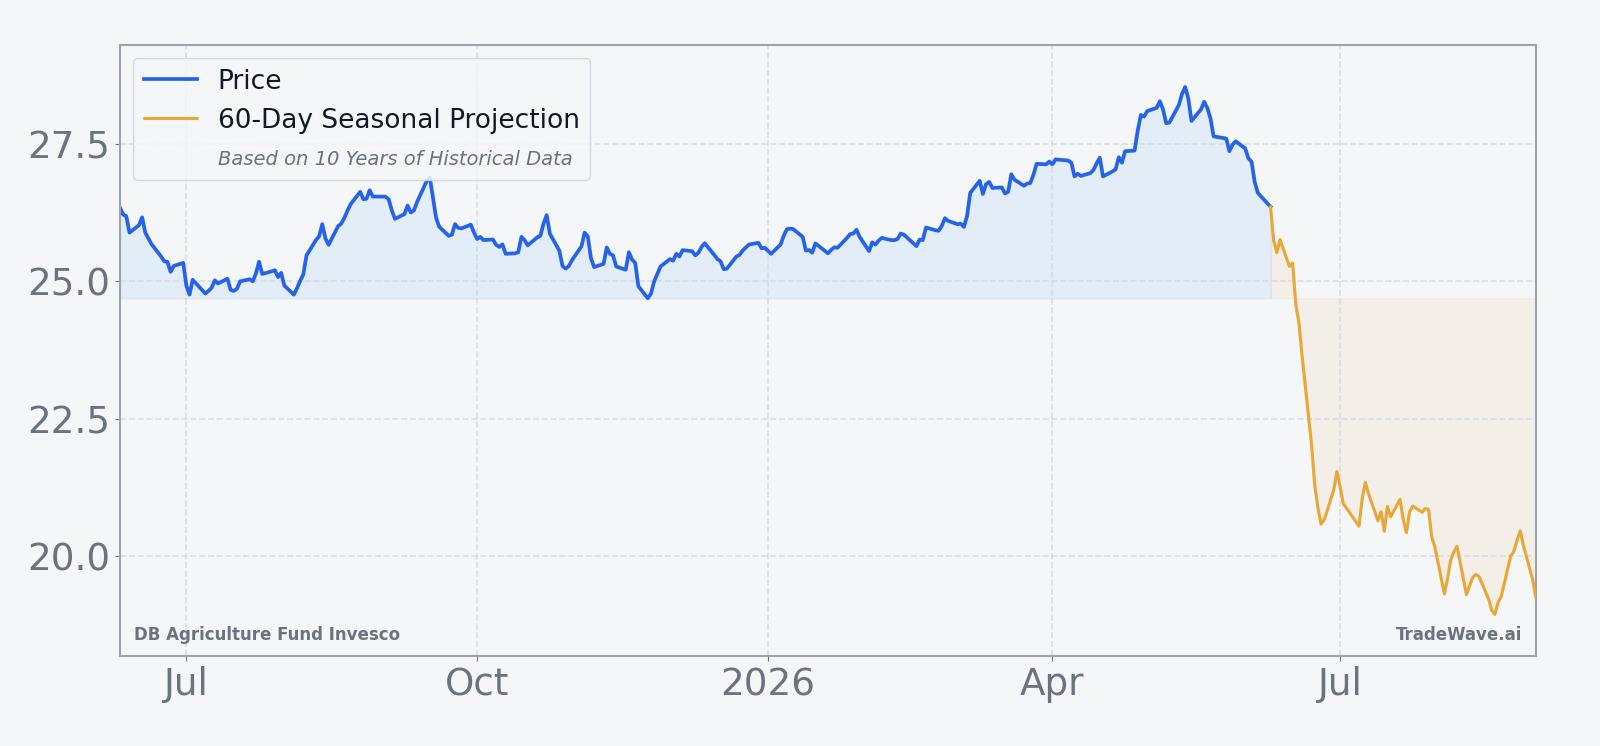
DBA tracks a diversified basket of agriculture futures, with grains and oilseeds making up close to half the portfolio alongside exposure to livestock and soft commodities.[3] In February 2026, one commodities analyst argued that this mix positioned DBA to benefit from a potential recovery in grain and oilseed prices from multi-year lows, especially if inflation in input costs and weather volatility persisted into the 2026 crop year.[1] In April 2026, another piece highlighted a no-K1 sister fund, PDBA, as an alternative wrapper for the same underlying exposure, underscoring that investor interest is as much about structure and tax treatment as it is about the agriculture theme itself.[5]
Macro risk has also crept in from outside the farm belt. In March 2026, commentary on rising tensions around the Strait of Hormuz flagged agriculture and fertilizer plays, including DBA, as potential beneficiaries if energy prices spike and fertilizer supply tightens.[2] Higher fuel and fertilizer costs can squeeze farmers but often support futures prices for crops, which in turn feed into DBA’s basket. That mix of supportive macro narratives and a softening price trend into a historically weak seasonal window is what makes this June stretch particularly interesting for traders focused on the agriculture sector’s seasonal outlook.
What should traders watch in this DBA seasonal window?
For the next 18 trading days, the key test is whether DBA behaves anything like its 8-for-10 short-side track record. On the price side, traders will be watching whether the ETF holds above its recent low near the 52-week midpoint or revisits the 24 to 25 area that marked prior support in this cycle.[1] A quick break lower that lines up with the historical pattern would reinforce the idea that this June window remains a soft spot for broad agriculture exposure.
Macro catalysts could either amplify or blunt that pattern. Incoming crop progress reports, early yield estimates and any escalation in weather or geopolitical risks that threaten supply could all jolt the underlying futures that DBA holds.[1] If those headlines trigger sustained buying in grains and oilseeds, a strong rally through the 50-day moving average around 27.46 would run counter to the historical seasonal trend and mark one of the rarer losing years for shorts in this window.[1]
Flows and structure also matter. While recent commentary has highlighted PDBA as a no-K1 alternative, any meaningful shift of assets between the two vehicles would still reflect investor conviction in the same agriculture story.[5] Persistent inflows into the complex during a window that has historically favored short exposure would be a sign that macro forces are overpowering the calendar pattern, while fading interest or outflows would fit more neatly with the decade-long DBA seasonal trend.
Add it up: DBA is entering an 18-day stretch that has historically rewarded patience on the short side, even as the fundamental narrative around agriculture remains constructive. Traders who care about seasonality will be watching whether price action respects that history or breaks it, and how any move interacts with the broader inflation and commodity story that has kept agriculture ETFs on the radar this year.
Sources
About this seasonal analysis
Seasonal pattern data is sourced from TradeWave.ai, which analyzes historical price behavior across annual calendar windows going back up to 30 years. Read the full data methodology or the book The 100-Year Pattern by Afshin Moshrefi (2026 edition). Past performance of seasonal patterns does not guarantee future results. This article is for informational purposes only and does not constitute investment advice.