S&P 500 SPDR (SPY) Has Rallied in 7 of 7 Midterm Windows, Averaging 14.52% Gains
S&P 500 SPDR is trading just below its 52-week high as it approaches a 344-day midterm election-year seasonal window that has never posted a loss in this dataset.

What is the seasonal pattern for S&P 500 SPDR (SPY)?
S&P 500 SPDR has risen in 7 of 7 midterm election-year windows starting around Jul 11, with an average gain of 14.52% in winning years.
- 7 for 7 in this window since 1998, with average gains of 14.52% in winning years.
- Seasonal window begins Jul 11 and runs 344 trading days, spanning late midterm year into the following pre-election year.
- Percent Profitable is 100%, with 7 winners and 0 losers across the last seven midterm election-year cycles.
- Cumulative return across all seven windows is 156%, with a Sharpe ratio of 1.8 on end-of-window outcomes.
- TradeWave Ratio of 1.76 suggests price typically travels meaningfully in the long direction within the window, even before final results.
- Individual years have still seen sizable drawdowns inside the window, with adverse moves exceeding 10% in several cycles before recovering.
According to historical data from TradeWave.ai, this upcoming midterm-to-pre-election stretch has behaved very differently from an average year on the calendar. The next section walks through what that pattern has looked like in prior cycles and how it frames the backdrop for SPY.
How has S&P 500 SPDR (SPY) traded in this midterm-year window?
The seasonal window that begins on Jul 11 and runs 344 trading days has been a clean sweep for S&P 500 SPDR in the last seven midterm election years, with gains every time and an average move of 14.52% in winning years. Today SPY closed at 754.61, up 1.7% on the session and about 0.8% below its 52-week high of 760.40, so the ETF is heading into this historically strong stretch from a position of strength.
Grouping the data by the presidential election cycle matters here because this window sits in the heart of the midterm election year and then runs deep into the year before the presidential election, a phase that has often coincided with friendlier policy tone and stronger risk appetite. In this sample, the pattern phase is defined as the last seven midterm election years, so each observation reflects how SPY behaved from roughly late September of the midterm year through mid-July of the following pre-election year.
Across those seven cycles, the end-of-window results are strikingly consistent for a long setup. Percent Profitable is 100%, with 7 winners and 0 losers, and the cumulative return across all windows is 156%. The median gain of 15.64% is slightly higher than the average, which tells you the typical outcome has leaned toward the stronger side of the distribution rather than being skewed by a single outlier year.
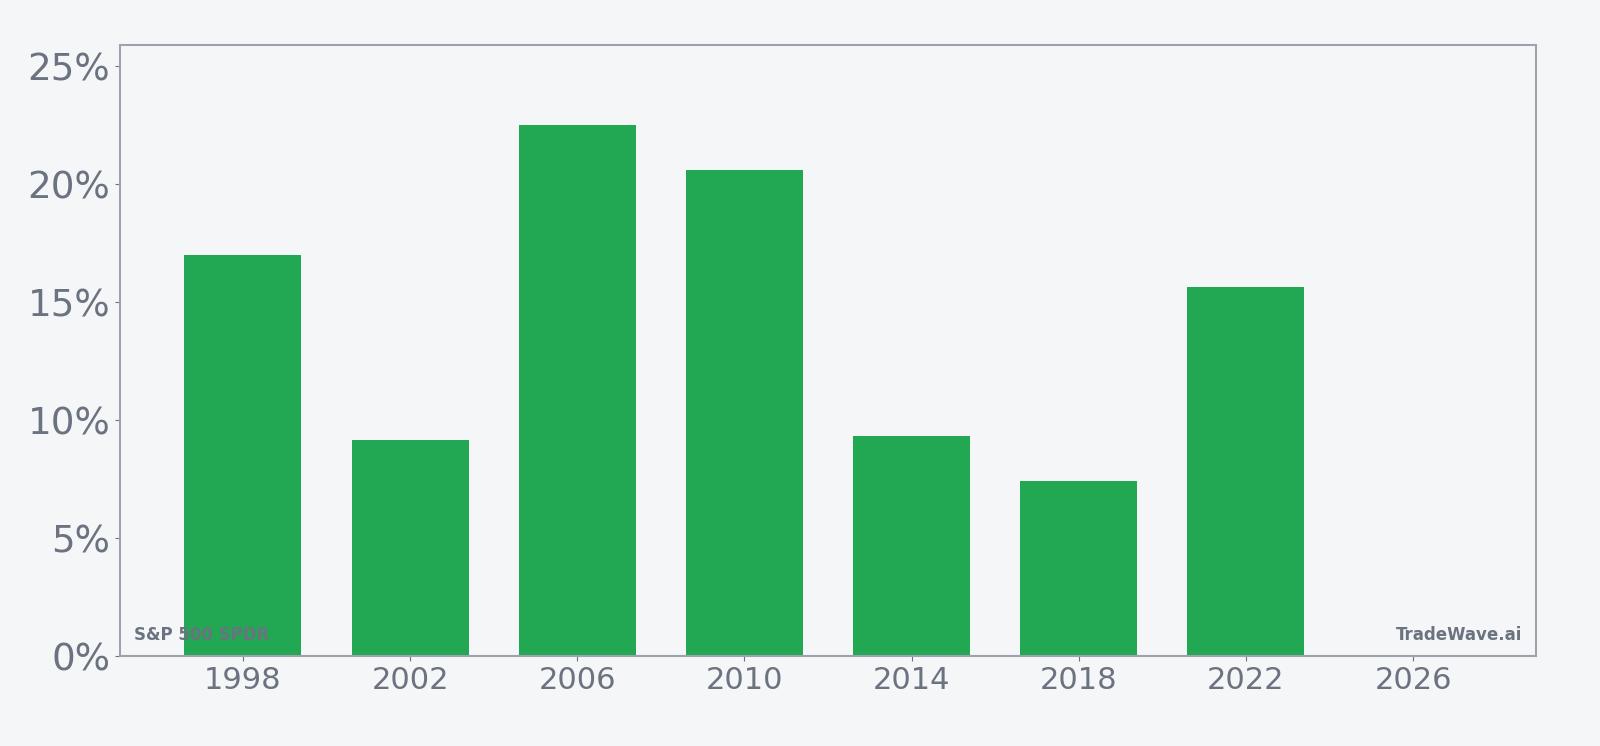
Looking at individual years, the strongest net return in this midterm-year window came in 2006, when SPY gained 22.51% between the entry and exit dates. The weakest outcome was still positive: in 2018 the ETF added 7.42% over the window, even though that period included a sharp volatility spike and a late-year selloff. Add it up and the pattern has delivered a solid double-digit gain in every midterm cycle in this dataset.
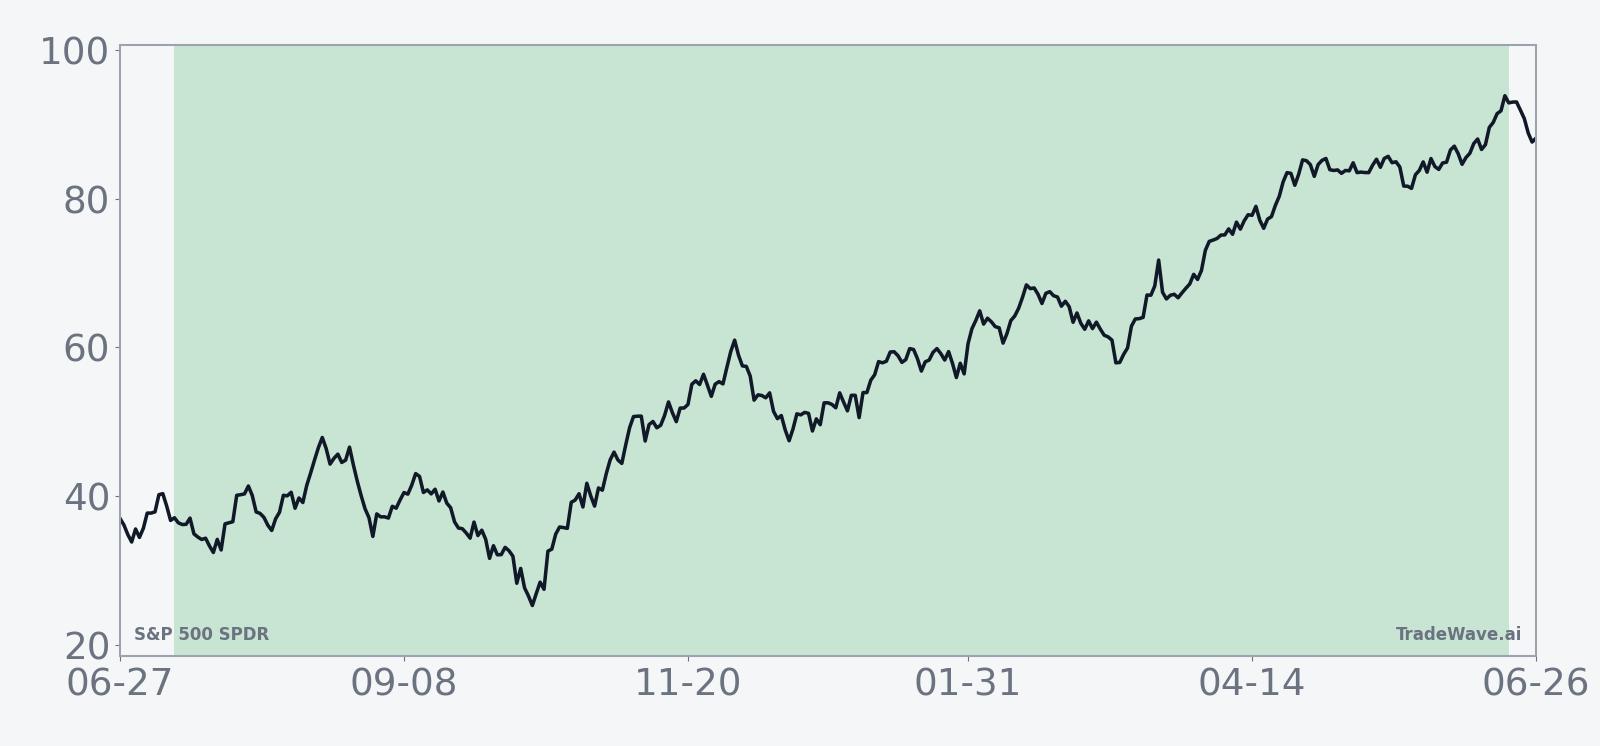
The historical seasonal average trend for this window shows gains that tend to build steadily rather than in a single burst. In several years, including 2010 and 2022, SPY saw a strong run-up early in the window, consolidated, and then pushed higher again into the following summer, which fits the idea of a two-playbook midterm year: choppy early months followed by a smoother climb once this regime kicks in.
Year-by-year net returns and intraperiod swings show how much SPY has typically moved in both directions inside this window.
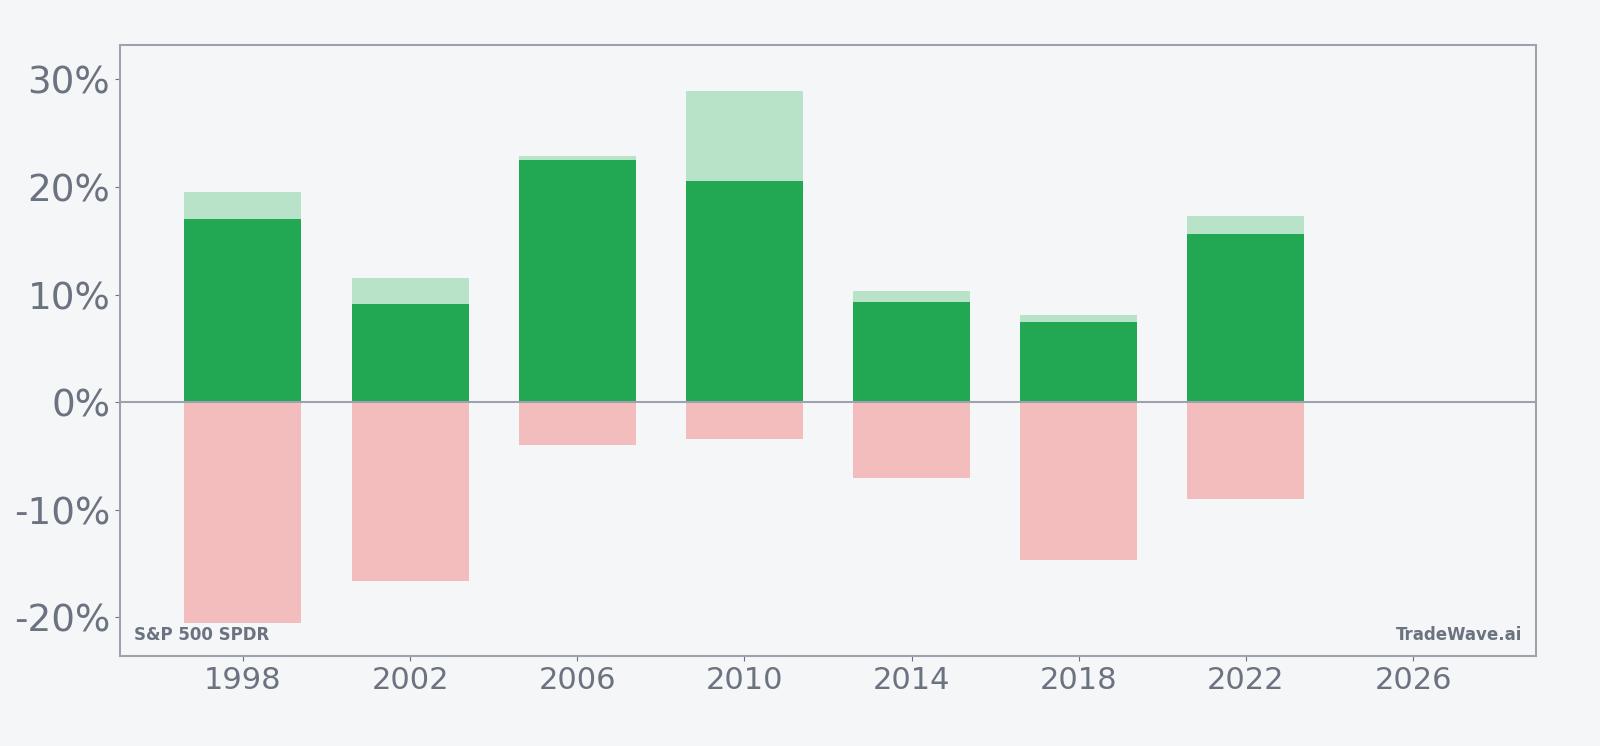
Intraperiod swings are an important part of the story. In 1998, for example, SPY finished the window up 16.98%, but the worst drawdown from entry was a 20.56% slide before the recovery. In 2002 and 2018, adverse moves of 16.64% and 14.69% respectively also preceded ultimately positive outcomes. On the upside, maximum favorable excursions have often run ahead of the final net gains, with years like 2010 showing a 28.89% peak run-up against a 20.58% final gain, which is consistent with a TradeWave Ratio of 1.76 that signals meaningful travel in the long direction inside the window.
Put simply, the pattern is clear: this midterm-to-pre-election window has favored longs in every one of the last seven cycles, but it has not been a straight line and has included double-digit drawdowns along the way.
History does not guarantee future results; adverse excursions (MAE) can be large even in winning windows.
Why does S&P 500 SPDR (SPY) follow this seasonal pattern?
One likely driver is the way the policy and earnings calendar lines up between the back half of a midterm election year and the following pre-election year. Analysts often point to a combination of reduced political uncertainty after midterms, a tendency for fiscal policy to lean more supportive, and improving earnings breadth as companies guide into the next presidential cycle. This pattern may also reflect institutional portfolio repositioning, as large allocators add equity risk once early midterm volatility has passed and the macro backdrop looks more stable.
What is driving S&P 500 SPDR (SPY) today?
SPY closed Tuesday at 754.61, up 1.7% on the day, with a one-month gain of 2.12% and average 20-day volume of about 53.5 million shares, leaving the ETF roughly 0.8% below its 52-week high of 760.40 and comfortably above its 50-day moving average of 724.78. That price action keeps the broader S&P 500 trend firmly bullish heading into the heart of the midterm election year.
Macro drivers remain central to the outlook. In 2025, investors focused heavily on the core PCE price index as a guide to inflation and Federal Reserve policy, with rate expectations feeding directly into SPY’s performance through both discount rates and sector leadership, especially in technology.[1] A weaker-than-expected jobs report in Aug 2025 showed how quickly that macro mix can shift, knocking rates, the dollar and equities lower in a single session and reminding traders that labor data can still trigger sharp cross-asset moves.[2]
By Sep 2025, strategists at BMO were framing anticipated Fed rate cuts as supportive for U.S. equities but warning that forward returns might be more muted than the early-cycle surge, a backdrop that remains relevant as SPY trades near record levels.[3] Earlier technical work on the S&P 500 in Jul 2025 flagged “unusual strength” and suggested that buying dips had been rewarded as long as the index held key support, a pattern that has broadly persisted into the current midterm year.[8]
Trade and currency tensions are another swing factor. In Jul 2025, currency markets flashed stress signals ahead of a tariff deadline, a reminder that policy shocks can spill quickly into equity volatility for SPY even when domestic fundamentals look solid.[10] With the U.S. now in the midterm election year, the policy calendar is likely to stay busy, keeping macro and political headlines tightly linked to day-to-day moves in the index ETF.
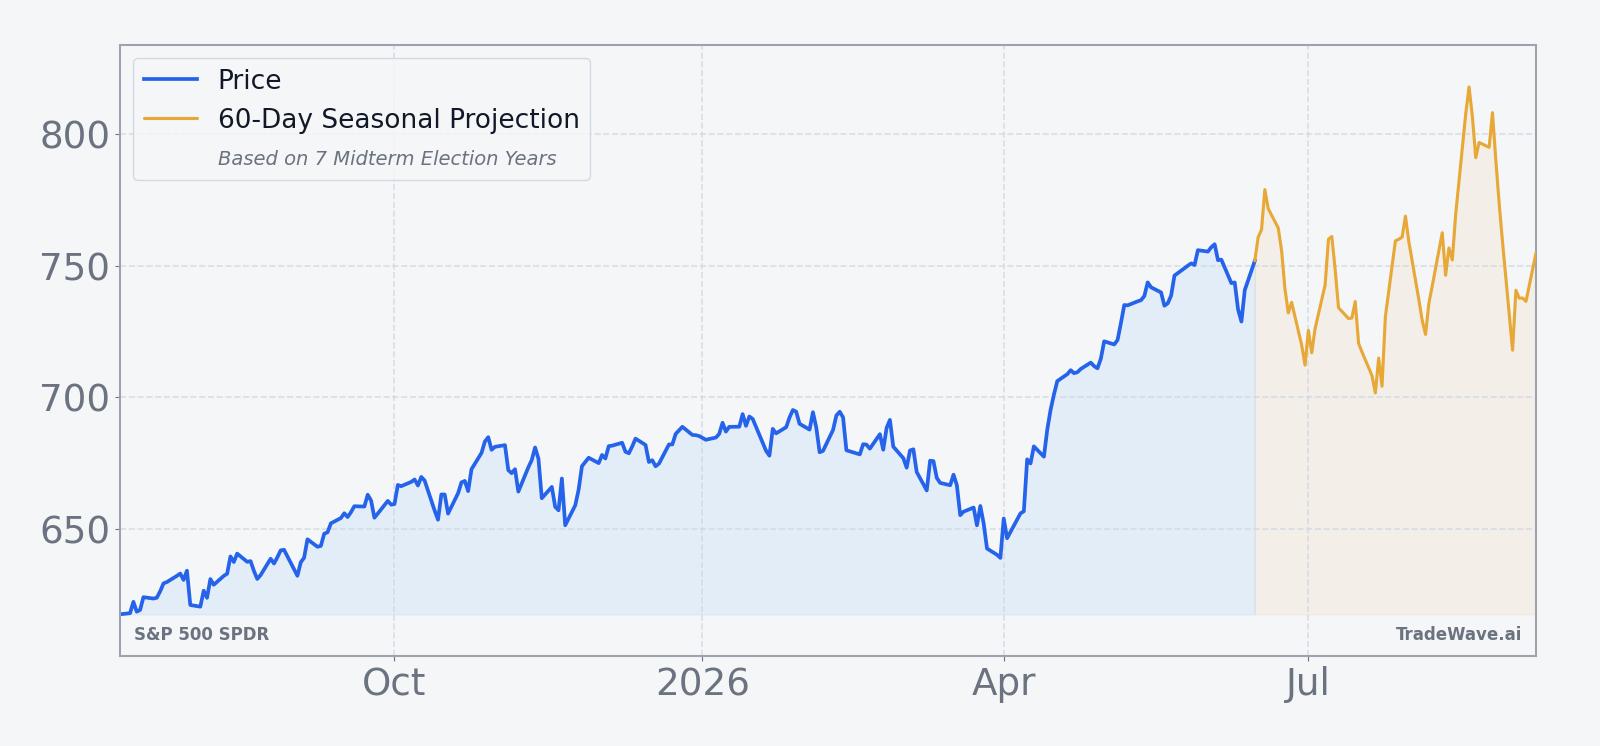
The chart below situates the latest move in its recent multi-month context and overlays a short-term seasonal projection.
What should traders watch as this SPY seasonal window approaches?
First, the calendar: the 344-day window opens on Jul 11, so any shift in volatility or breadth around that date will be watched closely against the historical pattern. Traders will be looking to see whether early-window behavior again features a strong initial run-up, as in 2010 and 2022, or a deeper shakeout before the longer climb, as in 1998 and 2002.
Second, key macro prints such as inflation and jobs data will shape how much room the Fed has to maneuver on rates, which in turn influences valuations for the mega-cap names that dominate SPY.[1][2] A backdrop of easing policy and stable growth has historically lined up well with the midterm-to-pre-election seasonal tailwind, while renewed inflation or growth scares could make any intraperiod drawdowns more severe even if the window ultimately finishes higher.
Third, watch the policy calendar around trade and tariffs, where surprise announcements have previously jolted currency markets and spilled into equities.[10] If similar shocks land inside this window, they could be the catalysts that produce the kind of double-digit adverse excursions seen in past cycles before the pattern reasserted itself.
Finally, price levels matter. On the downside, how SPY behaves around its 50-day moving average near 724.78 will be a basic test of trend strength if volatility picks up. On the upside, sustained trading above the recent 52-week high of 760.40 would signal that the ETF is leaning into the historical seasonal bias rather than fighting it. The combination of a strong long-term SPY seasonal trend, a supportive midterm-to-pre-election phase, and a market already near records makes this one of the more consequential windows on the calendar, even if history’s perfect record is no guarantee of what happens next.
Sources
About this seasonal analysis
Seasonal pattern data is sourced from TradeWave.ai, which analyzes historical price behavior across annual calendar windows going back up to 30 years. Read the full data methodology or the book The 100-Year Pattern by Afshin Moshrefi (2026 edition). Past performance of seasonal patterns does not guarantee future results. This article is for informational purposes only and does not constitute investment advice.