Nasdaq QQQ Invesco ETF (QQQ) Cash Levels, AAII Sentiment Clash With Bullish Midterm History
Nasdaq QQQ Invesco ETF is approaching a midterm-year seasonal window that has never lost in the last six cycles, even as the ETF trades just below record highs and sentiment looks stretched.

What is the seasonal pattern for Nasdaq QQQ Invesco ETF (QQQ)?
Nasdaq QQQ Invesco ETF has risen in 6 of 6 midterm-election-year windows starting around late June, with an average gain of 19.97% in winning years.
- 6 for 6 in this window, with winning years averaging 19.97% gains across the last six midterm election years.
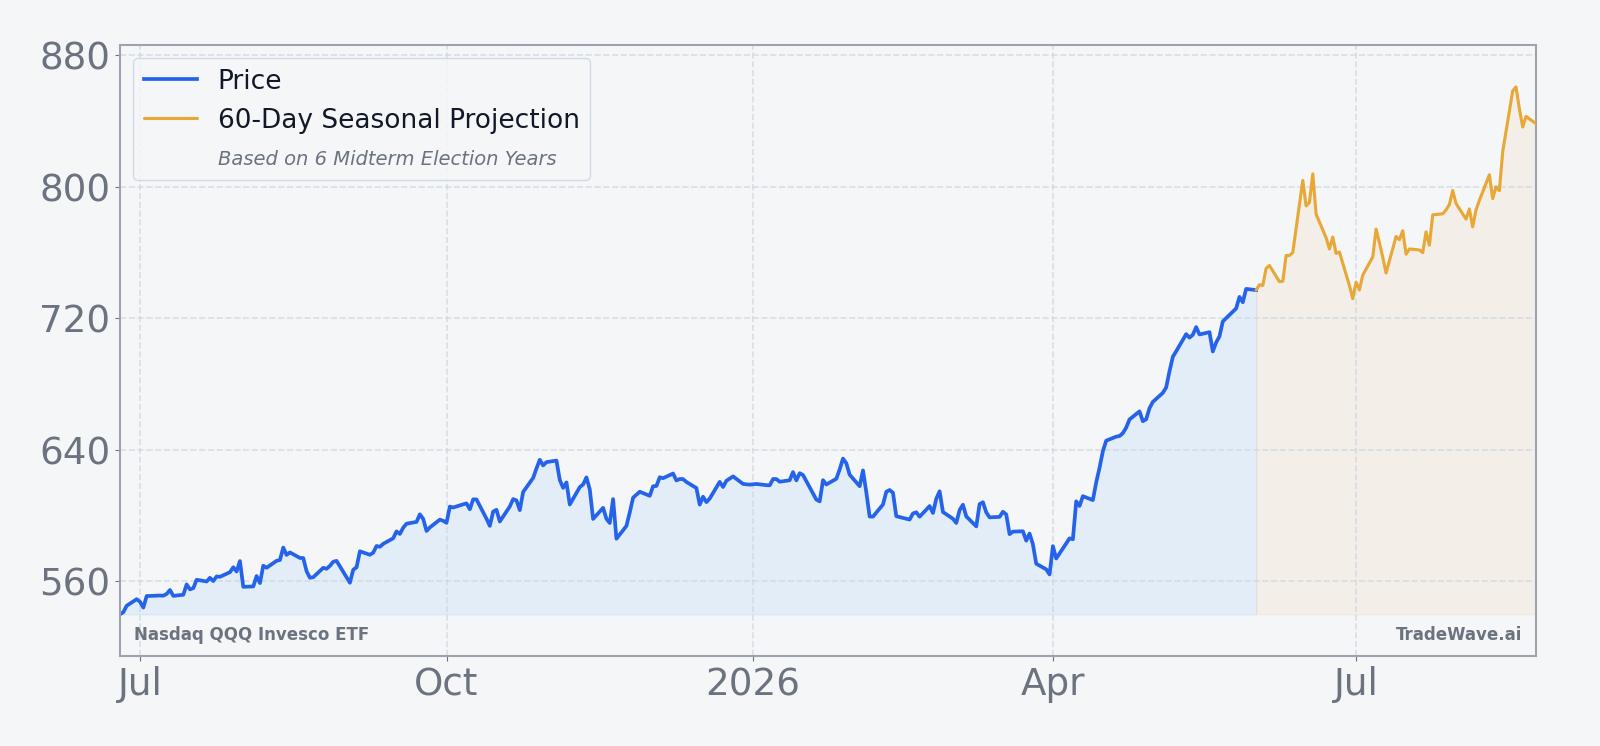
- The upcoming window begins Jun 25, 2026 and runs for 364 trading days, covering the late midterm year into the pre-election year.
- Percent Profitable is 100%, with 6 winners and 0 losers in the historical sample.
- Trade Direction is long, supported by a Sharpe ratio of 3.04 and a TradeWave Ratio (TWR) of 2.9, indicating strong upside travel in the trade direction.
- Individual years have seen maximum favorable moves as high as 31.83% and adverse drawdowns as deep as -22.39% within the window, underscoring meaningful volatility.
- Cumulative return across all six windows totals 196%, with gains clustering through the back half of the midterm year and into the following pre-election year.
According to historical data from TradeWave.ai, this specific midterm-year stretch has behaved very differently from an average calendar year for QQQ, and the next iteration is about to start.
How has Nasdaq QQQ Invesco ETF (QQQ) traded in this midterm-year window?
Nasdaq QQQ Invesco ETF has posted gains in all six prior midterm-election-year windows that begin around Jun 25 and run for roughly a full year, averaging 19.97% in those winning stretches. Today QQQ closed at 743.71, up 3.1% on the session and sitting about 0.7% below its 52-week high of 748.65, so the ETF is heading into this historically strong seasonal regime from a position of strength.
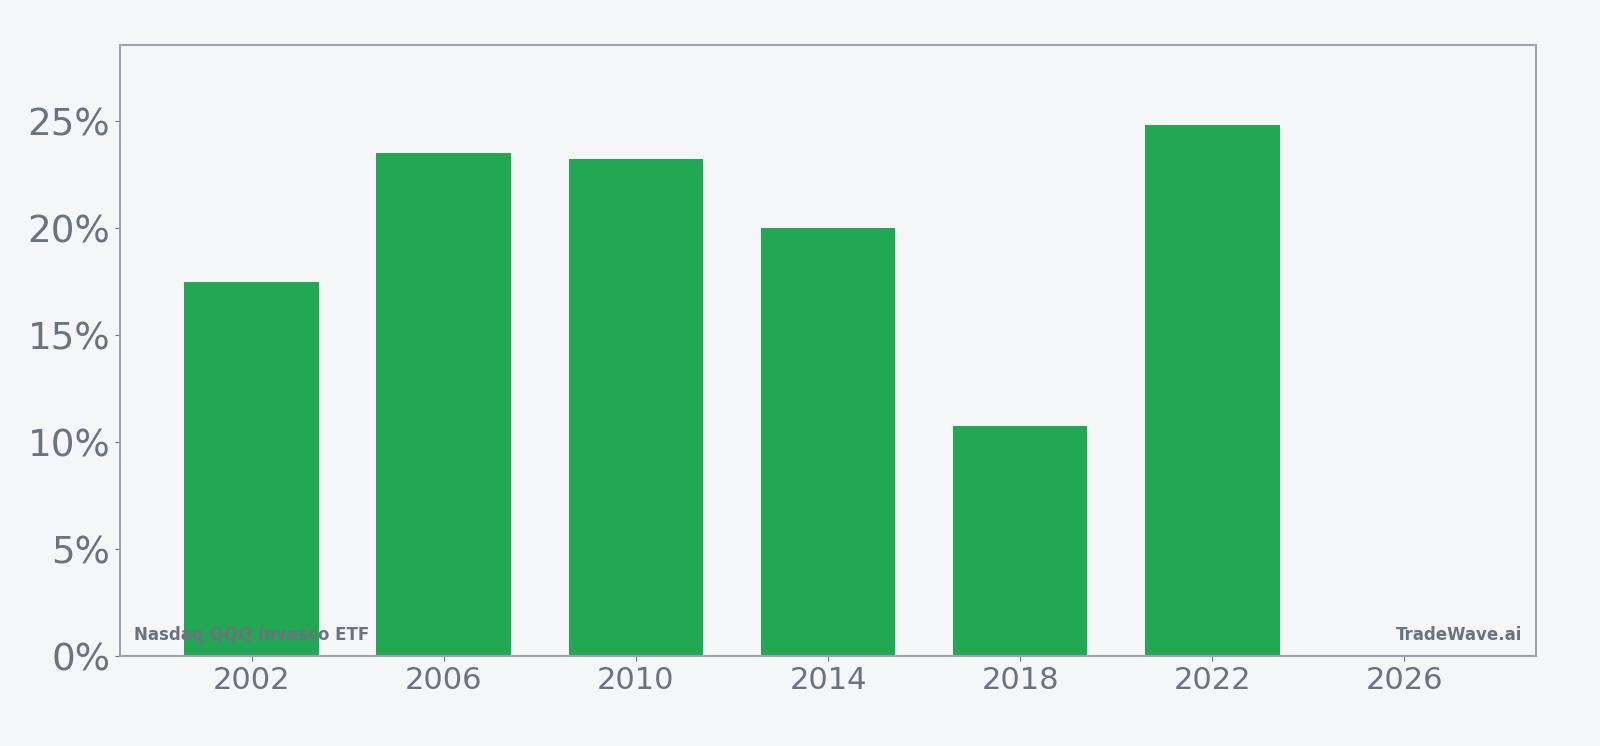
The pattern is built on the last six midterm election years, a phase of the presidential cycle that often features policy uncertainty early in the year followed by a more supportive backdrop as the calendar rolls toward the pre-election year. In this case the Trade Direction is long, and every one of the six historical windows delivered a positive net return, from a 10.75% gain in 2018 to a 24.85% gain in 2022. Add it up: the cumulative return across those six midterm-year windows is 196%, with a 19.87% annualized pace.
Average gains tell only part of the story. The maximum favorable move inside the window, or peak run-up from entry, ranged from 12.37% in 2018 to 31.83% in 2010, showing that in strong years QQQ has often pushed well beyond its final close before consolidating. On the downside, the worst intraperiod drawdowns from entry have been meaningful, with maximum adverse excursions as shallow as -3.04% in 2014 but as deep as -22.39% in 2002, reminding traders that even “all green” seasonal windows can involve sharp pullbacks along the way.
The per-year table shows that 2002 and 2018 were the choppier examples. In 2002 QQQ ultimately gained 17.48% over the window, but only after enduring that -22.39% drawdown from the starting level. In 2018 the ETF finished up 10.75% with a 12.37% peak run-up, yet it also saw a -15.9% adverse move inside the same stretch. By contrast, 2014 delivered a smoother ride, with a 20.03% net gain, a 20.29% peak run-up and only a -3.04% worst drawdown.
The historical seasonal trend line slopes higher through most of the 364-day window, with gains tending to build from late in the midterm year into the heart of the following pre-election year. The average path shows modest early volatility, then a more persistent climb, which lines up with the broader pattern of risk appetite improving as the political calendar shifts from midterm uncertainty toward the next presidential race.
A second view combines net results with the best and worst intraperiod swings to show how far QQQ has typically traveled inside this window.
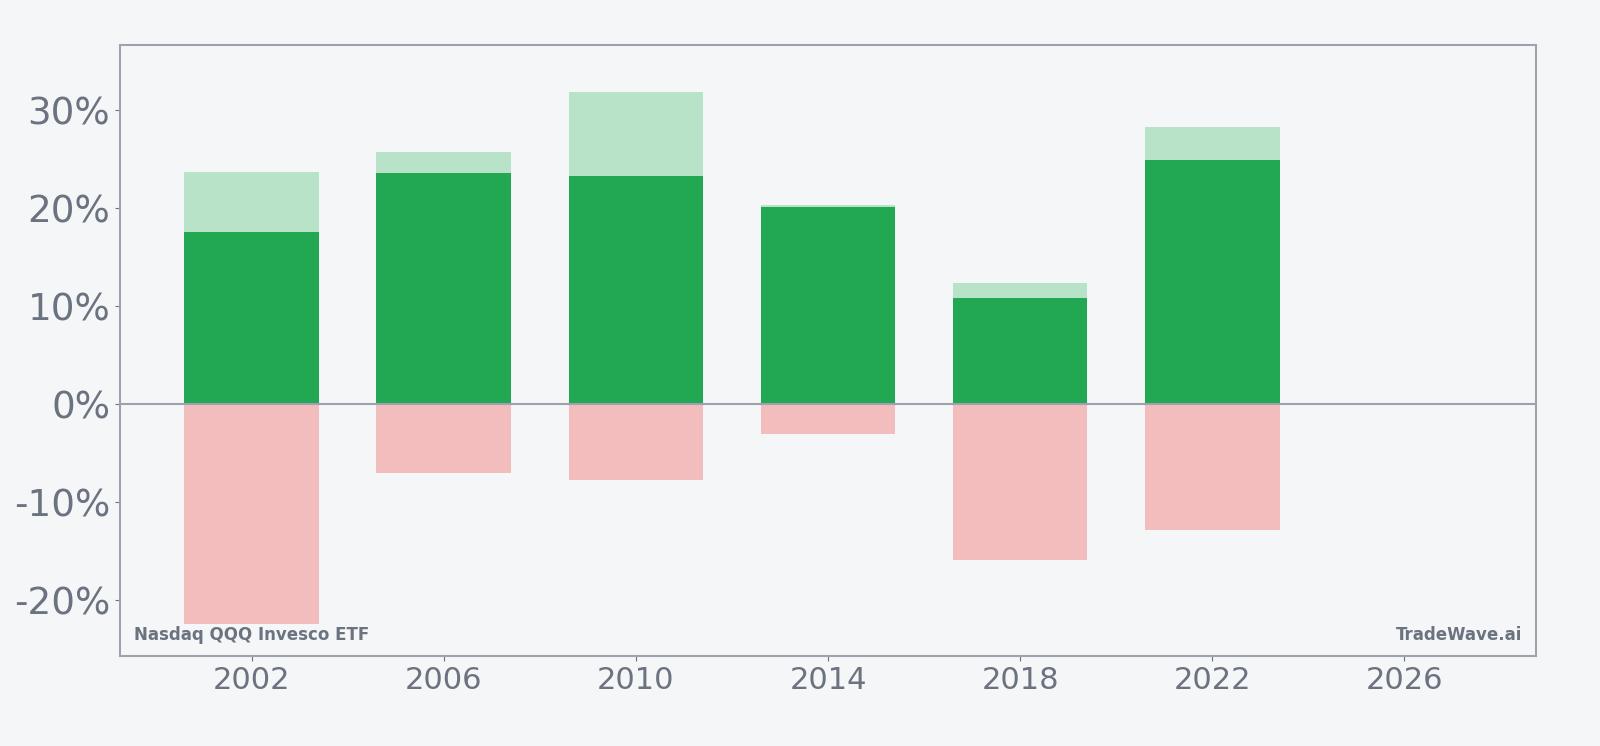
The combined net/MFE/MAE bars make the trade-off clear: historically this has been a bullish QQQ seasonal trend, but the path has involved sizable swings in both directions, especially in years like 2002 and 2018 where the worst drawdowns approached or exceeded mid-teens levels even as the final outcome stayed positive. For traders, the key takeaway is that this midterm-to-pre-election window has favored long exposure in QQQ, yet it has not been a straight line.
History does not guarantee future results; adverse excursions can be large even in winning windows, and past seasonal behavior may not repeat.
Why does Nasdaq QQQ Invesco ETF (QQQ) follow this seasonal pattern?
One likely driver is the way the presidential election cycle shapes risk appetite for growth and technology stocks. Midterm years often start with policy and rate uncertainty, but by late in the year the Federal Reserve’s path and fiscal stance are usually clearer, and investors begin positioning for the historically stronger pre-election year. That shift, combined with the tech sector’s earnings calendar and index rebalancing flows, may help explain why QQQ’s midterm-year seasonal window from late June into the following year has repeatedly skewed positive despite bouts of volatility.
What is driving Nasdaq QQQ Invesco ETF (QQQ) today?
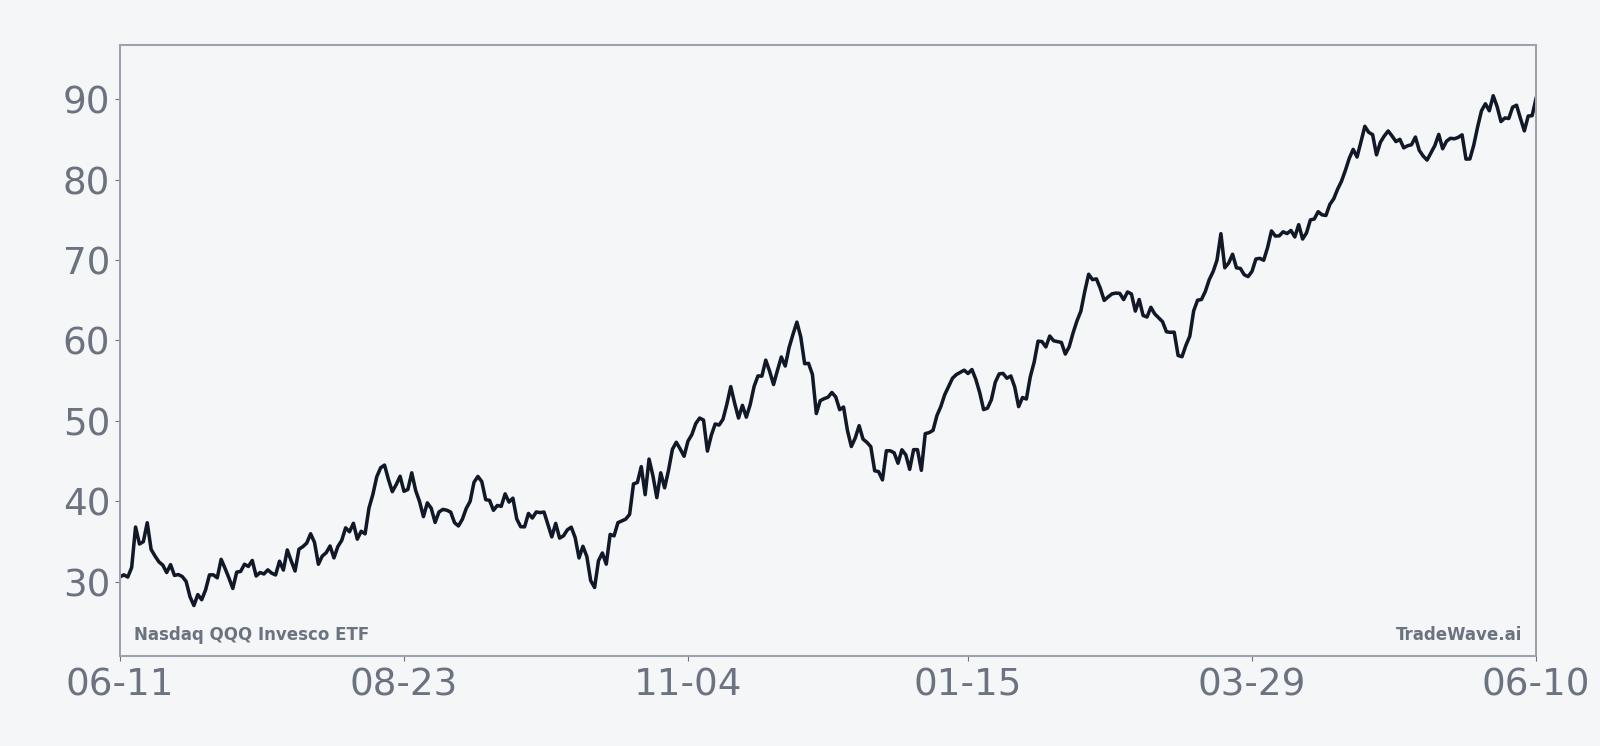
QQQ closed Monday at 743.71, up 3.1% on the day, as the ETF pushed to within about 0.7% of its 52-week high of 748.65 on heavy volume of roughly 37.3 million shares versus a 20-day average near 48.1 million. The ETF has also climbed about 4.95% over the past month, extending a powerful uptrend that has carried price well above its 50-day moving average around 684.99, and leaving the tech-heavy benchmark as one of the strongest risk proxies on the board.
Macro discussion around QQQ has increasingly focused on cash levels and sentiment, with attention on how American Association of Individual Investors (AAII) readings and investor cash balances have lined up with past performance in the ETF.[1] Elevated optimism and lower cash have sometimes preceded consolidation phases in prior cycles, while high cash and bearish sentiment have often marked better entry points for long exposure. Against that backdrop, QQQ’s surge toward new highs just as a historically strong midterm-year seasonal window approaches gives traders a clean test of whether this cycle will rhyme with the last six or diverge.
The chart below situates the latest move in its recent multi-month context alongside a short-term seasonal projection.
What should traders watch as this QQQ seasonal window opens?
First, the calendar: the new midterm-year window begins on Jun 25, 2026 and runs for 364 trading days, carrying QQQ from the back half of the midterm election year into the heart of the pre-election year. Historically that combination has been friendly to long QQQ exposure, but the path has included drawdowns as deep as -22.39% inside otherwise winning windows, so how the ETF behaves on pullbacks may matter as much as the headline trend.
Second, levels: with QQQ already just below its 52-week high, traders will be watching whether the ETF can hold above its 50-day moving average on any shakeouts and whether dips stay contained to single-digit percentages rather than sliding toward the double-digit adverse moves seen in 2002 and 2018. A pattern of shallow pullbacks followed by renewed buying would be more consistent with the historical seasonal trend, while a break that undercuts recent support and fails to recover would mark a clear departure from prior midterm-year behavior.
Third, sentiment and cash positioning: if AAII readings and cash levels remain stretched while QQQ continues to grind higher, it would reinforce the idea that this midterm-to-pre-election window can stay bullish even when investors are already optimistic.[1] On the other hand, a sharp reversal in sentiment or a rush back into cash during the window would raise the odds that this cycle delivers a more volatile or front-loaded pattern than the smooth average path suggests.
Finally, policy and macro catalysts will frame the backdrop. The midterm election year often brings clarity on fiscal priorities and regulatory tone, while the approach of the pre-election year can coincide with a more supportive stance toward markets. If that script holds, QQQ’s strong historical seasonality from late June into the following year will be working with, not against, the broader policy calendar. If policy or growth shocks hit instead, traders will find out how resilient a 6-for-6 seasonal record really is.
Sources
About this seasonal analysis
Seasonal pattern data is sourced from TradeWave.ai, which analyzes historical price behavior across annual calendar windows going back up to 30 years. Read the full data methodology or the book The 100-Year Pattern by Afshin Moshrefi (2026 edition). Past performance of seasonal patterns does not guarantee future results. This article is for informational purposes only and does not constitute investment advice.