7-for-7 Midterm Run: S&P 500 SPDR (SPY) Has Averaged 17.59% Gains From Jul 19
S&P 500 SPDR is trading just below record highs as it approaches a midterm-year seasonal window that has never posted a loss in this dataset.

What is the seasonal pattern for S&P 500 SPDR (SPY)?
S&P 500 SPDR has risen in 7 of 7 midterm-year windows starting around Jul 19, with an average gain of 17.59% in winning years.
- 7 for 7 in this window since 1998, with winning years averaging 17.59% gains for SPY.
- Seasonal window begins Jul 19 and runs 364 days, spanning the late midterm year into the following pre-election year.
- Percent Profitable is 100%, with 7 winners and 0 losers across the last seven midterm election years.
- Annualized return of 17.44% and a Sharpe ratio of 2.08 point to unusually strong risk-adjusted performance.
- TradeWave Ratio of 2.02 suggests SPY typically travels meaningfully in the long direction within this window before it closes.
- Intraperiod drawdowns have still been sizable in some years, with adverse moves exceeding 10% even in ultimately positive cycles.
According to historical data from TradeWave.ai, this midterm-year stretch has behaved very differently from an average year on the calendar. The next section walks through how that pattern has played out and why the upcoming iteration matters for SPY.
How has S&P 500 SPDR (SPY) traded in this midterm-year window?
S&P 500 SPDR has posted gains in every one of the last seven midterm election years during the 364-day window that begins around Jul 19, averaging 17.59% per cycle. Today SPY closed at 746.74, up 0.8% on the session and about 1.3% below its 52-week high of 756.50.[1] That combination of a near-record price and a spotless seasonal record gives this upcoming window unusual weight for investors trying to time exposure to the broad U.S. equity market.
The presidential election cycle matters here because this pattern is built only from midterm election years, then carried forward into the following pre-election year. That aligns the seasonal window with a policy backdrop that has often featured late-cycle fiscal support, clearer visibility on regulation after midterms, and a tendency for risk appetite to rebuild as the next presidential race comes into view.
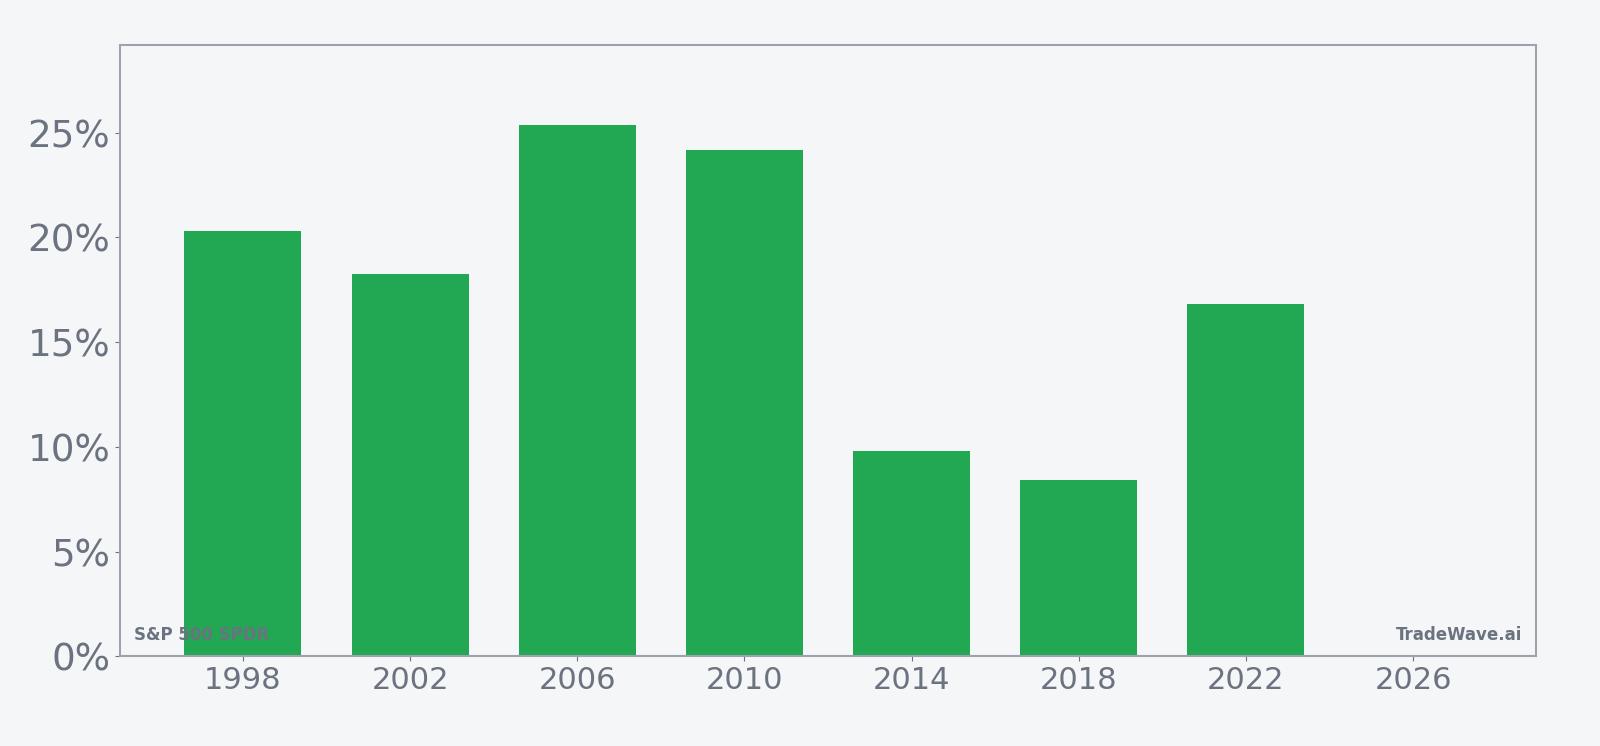
Historically, the trade direction for this SPY seasonal window is long, and the record has been clean. Percent Profitable is 100%, with 7 winners and 0 losers, and the average profit of 17.59% is close to the 18% all-years average because there have been no losing years to drag it down. The median outcome of 18.27% shows that the typical midterm-year cycle has delivered a high-teens gain rather than relying on one or two outliers.
The per-year breakdown shows how consistent that strength has been. The strongest cycle in this sample was 2006, when SPY gained 25.38% from entry to exit, while 2010 was close behind at 24.18%. Even the softest year, 2018, still finished up 8.44% over the window, and 2014 delivered 9.79%, underscoring that the weaker outcomes have still been solidly positive.
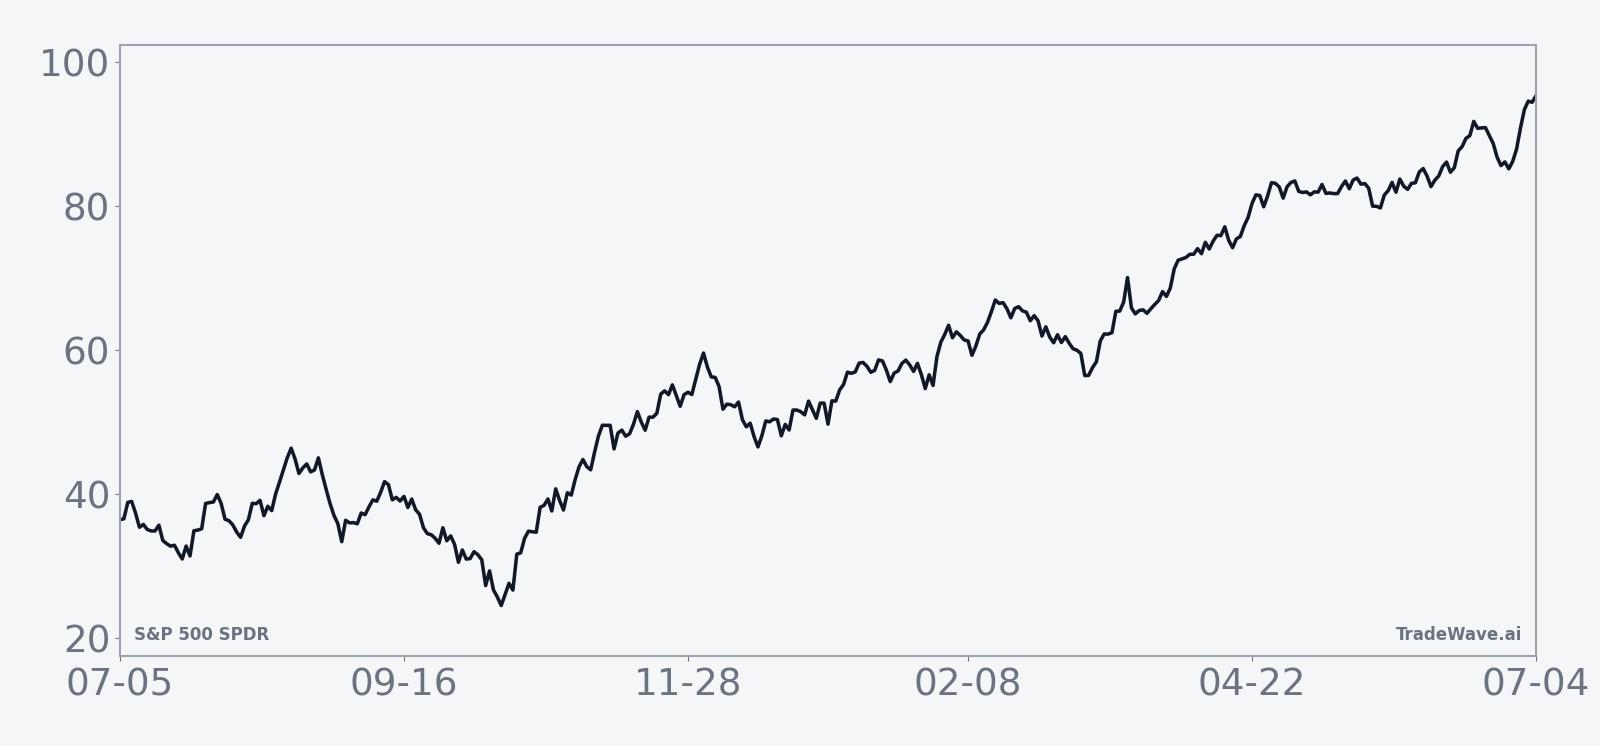
The historical seasonal trend chart shows a fairly steady upward slope rather than a single explosive burst. Gains tend to accrue across the full 364-day span, with only modest pauses, which fits the idea of a long regime rather than a short tactical trade. That profile also means the window has historically rewarded patience more than precise day-to-day timing.
The next view layers in how far SPY has typically run up and sold off inside the window before finishing higher.
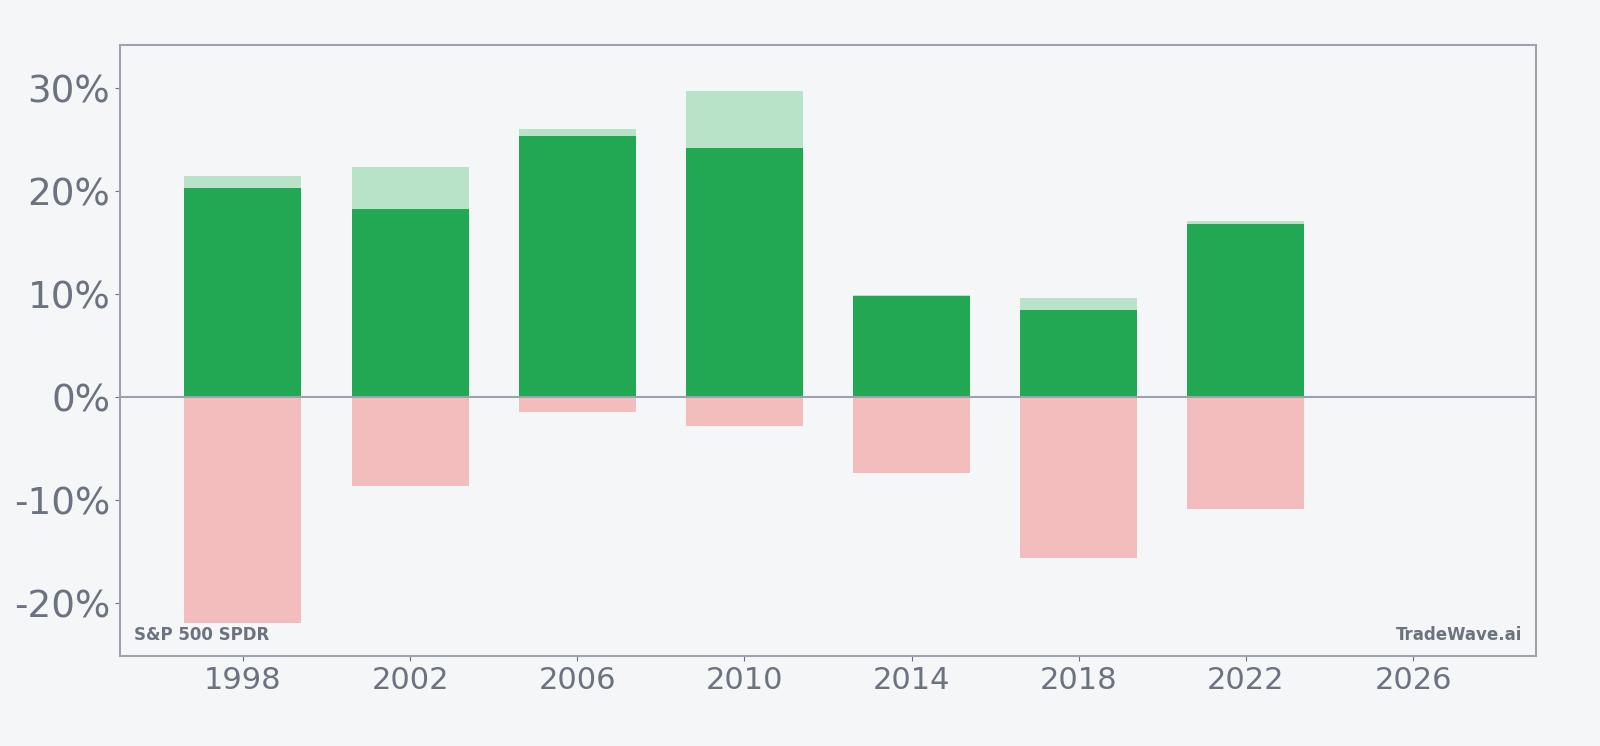
The bars with MFE and MAE show that even in winning years, the ride has not been smooth. In 1998, for example, SPY finished the window up 20.29% with a best intraperiod run-up of 21.46%, but it also saw a worst drawdown of -21.94% from the entry point before recovering. More recent cycles such as 2018 and 2022 saw adverse moves of -15.65% and -10.89% respectively, alongside positive final returns, which underlines that this bullish seasonal tendency has come with meaningful volatility along the way.
History does not guarantee future results; adverse excursions (MAE) can be large even in winning windows.
Put simply, the pattern is clear: this midterm-to-pre-election window has favored long SPY exposure in every cycle in this dataset, but it has often done so through deep, tradable swings rather than a straight line higher.
Why does S&P 500 SPDR (SPY) follow this seasonal pattern?
One likely driver is the way the policy calendar and investor positioning evolve from the midterm election year into the pre-election year. Analysts have pointed to a mix of post-midterm clarity on regulation, fiscal support that often ramps ahead of presidential campaigns, and institutional portfolio rebalancing that tends to favor equities in this phase. This SPY seasonal trend may also reflect earnings breadth improving as the cycle matures, encouraging broad-based buying across the index.
What is driving S&P 500 SPDR (SPY) today?
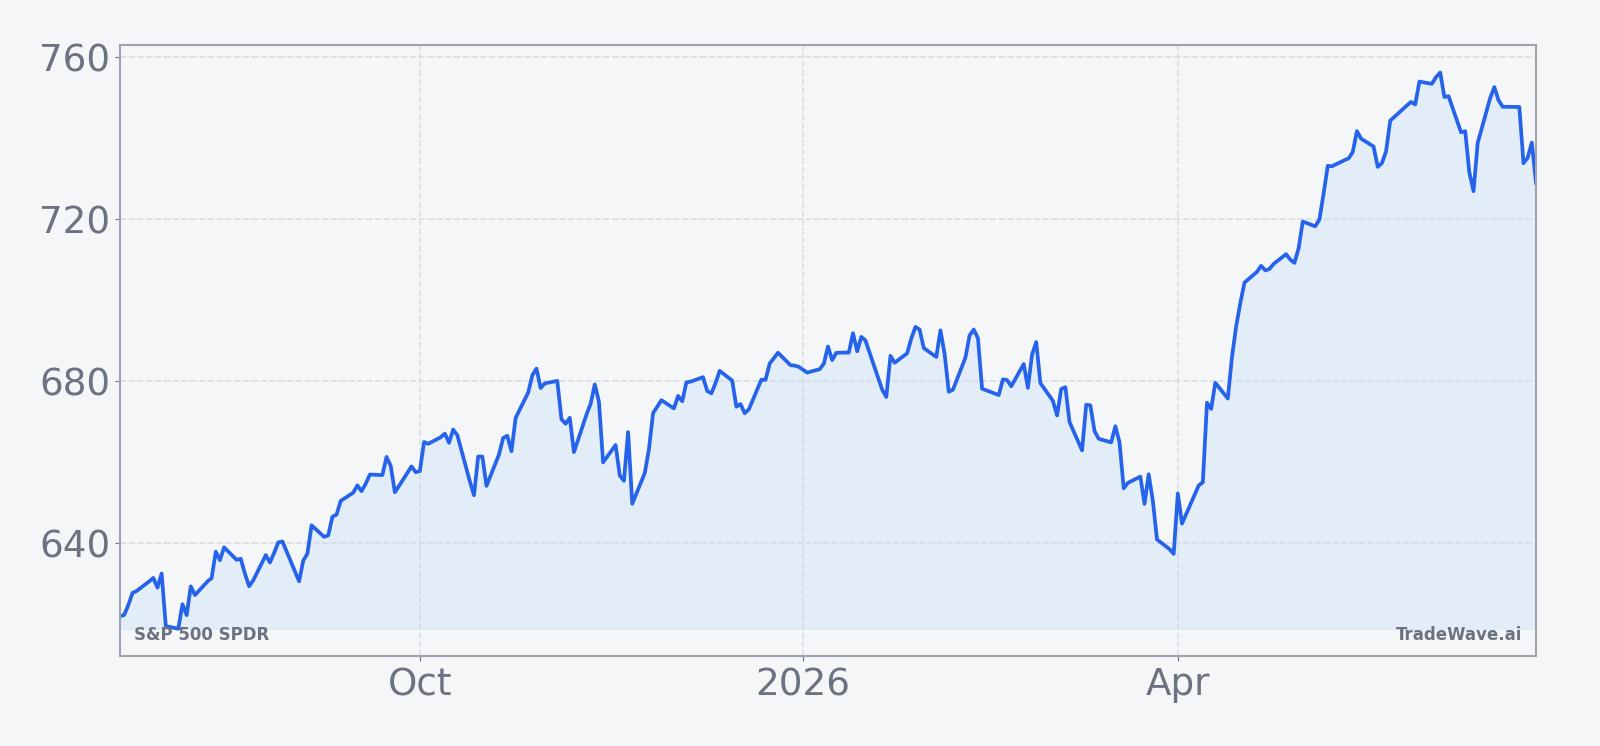
SPY added 0.8% on Monday to close at 746.74, with intraday trading confined to a relatively tight 743.86 to 748.23 range and volume of about 80.9 million shares, modestly above its 20-day average of roughly 58.5 million.[1] The ETF sits about 1.3% below its 52-week high of 756.50 and comfortably above its 50-day moving average near 725.99, keeping the broader S&P 500 trend pointed higher into the heart of the midterm election year.[1]
Macro drivers remain front and center for SPY, with investors watching how the Federal Reserve balances inflation control against growth risks and how that shapes the path of policy rates.[1] Labor-market data and manufacturing indicators have also been key inputs for equity sentiment, as traders weigh whether the expansion can continue without reigniting price pressures.[1] At the same time, strategists have flagged a menu of downside scenarios for 2026, from slower global growth to renewed volatility around fiscal debates, that could test the resilience of this bull market.[1]
The chart below situates the latest move in its recent multi-month context and overlays a short-term seasonal projection.
What should traders watch as this SPY seasonal window approaches?
First, the calendar: the 364-day midterm-year window begins on Jul 19, so the next few weeks are about positioning rather than execution. Historically, this stretch has overlapped the broader midterm-to-pre-election regime that has been one of the strongest on the S&P 500 calendar, so how SPY behaves into that start date will shape how much room traders see for the pattern to play out.
Second, levels: with SPY less than 2% below its 52-week high and well above its 50-day moving average, traders will be watching whether pullbacks stay shallow or begin to resemble the double-digit intraperiod drawdowns seen in prior midterm cycles. A correction that holds above the 50-day line would look more like the contained setbacks of 2006 or 2010, while a deeper slide would echo 1998 or 2018 and remind investors that even “all green” seasonal windows can be bumpy.
Third, macro and policy catalysts: upcoming inflation prints, jobs data, and any shifts in Fed communication will help determine whether this midterm-year seasonal tailwind lines up with or fights against the macro tape.[1] If rate expectations stabilize and growth data stay firm, the historical pattern of steady gains could find a supportive backdrop. If downside scenarios around growth or policy uncertainty start to materialize, the same seasonal window could instead coincide with more volatile swings inside a still-positive full-year outcome.
Finally, behavior inside the window itself will be the real test. In prior cycles, SPY has often seen its maximum favorable move and maximum adverse move well before the final exit date, creating opportunities and risks for investors who try to time entries and exits. If this year’s path again features a sizable early drawdown followed by a strong recovery, it would fit the historical script. A grind higher with only shallow dips would mark a cleaner, but historically less common, version of this powerful midterm-year pattern.
Sources
About this seasonal analysis
Seasonal pattern data is sourced from TradeWave.ai, which analyzes historical price behavior across annual calendar windows going back up to 30 years. Read the full data methodology or the book The 100-Year Pattern by Afshin Moshrefi (2026 edition). Past performance of seasonal patterns does not guarantee future results. This article is for informational purposes only and does not constitute investment advice.