S&P 500 Technology Sector SPDR (XLK) Near Highs as 356-Day Midterm Rally Window Opens Jul 2
S&P 500 Technology Sector SPDR is edging toward a historically powerful midterm-year seasonal window even as the ETF trades just below its 52-week high.

What is the seasonal pattern for S&P 500 Technology Sector SPDR (XLK)?
S&P 500 Technology Sector SPDR has risen in 6 of 6 midterm-year windows during this 356-day stretch, with an average gain of 21.08% in winning years.
- 6 for 6 in this window, with winning years averaging 21.08% gains across the last six midterm election cycles.
- Seasonal window begins Jul 2, 2026 and runs for 356 trading days, spanning late midterm year into the following pre-election year.
- Percent Profitable is 100%, with 6 winners and 0 losers across the historical sample.
- Trade Direction is long, supported by a Sharpe ratio of 2.13 and a TradeWave Ratio of 2.19.
- Individual years have seen strong upside bursts, with maximum favorable moves reaching up to 37.69% inside the window.
- Adverse moves have still appeared intraperiod, with worst drawdowns as deep as -22.45% before recovering into gains.
According to historical data from TradeWave.ai, this upcoming stretch for XLK behaves very differently from an average year, with a distinct midterm-election flavor that most traders never see quantified.
How strong is the upcoming seasonal window for S&P 500 Technology Sector SPDR (XLK)?
S&P 500 Technology Sector SPDR has posted gains in every one of the last six midterm-election windows that start in early July and run for roughly a year, averaging 21.08% in those winning stretches. Today the ETF closed at 191.73, up 3.2% on the session and sitting about 3.5% below its 52-week high of 198.73.[1] That combination of a powerful historical tailwind and a price still shy of record territory is why this particular XLK seasonal trend is drawing attention as the calendar approaches Jul 2.
The presidential election cycle matters here because this pattern is built only from midterm election years, a phase that often features policy uncertainty early on and a more supportive backdrop as the next election approaches. In this case, the 356-day XLK trading window that begins on Jul 2 sits squarely in the late midterm phase and extends into the year before the presidential election, when risk appetite has historically improved for growth and technology exposure.
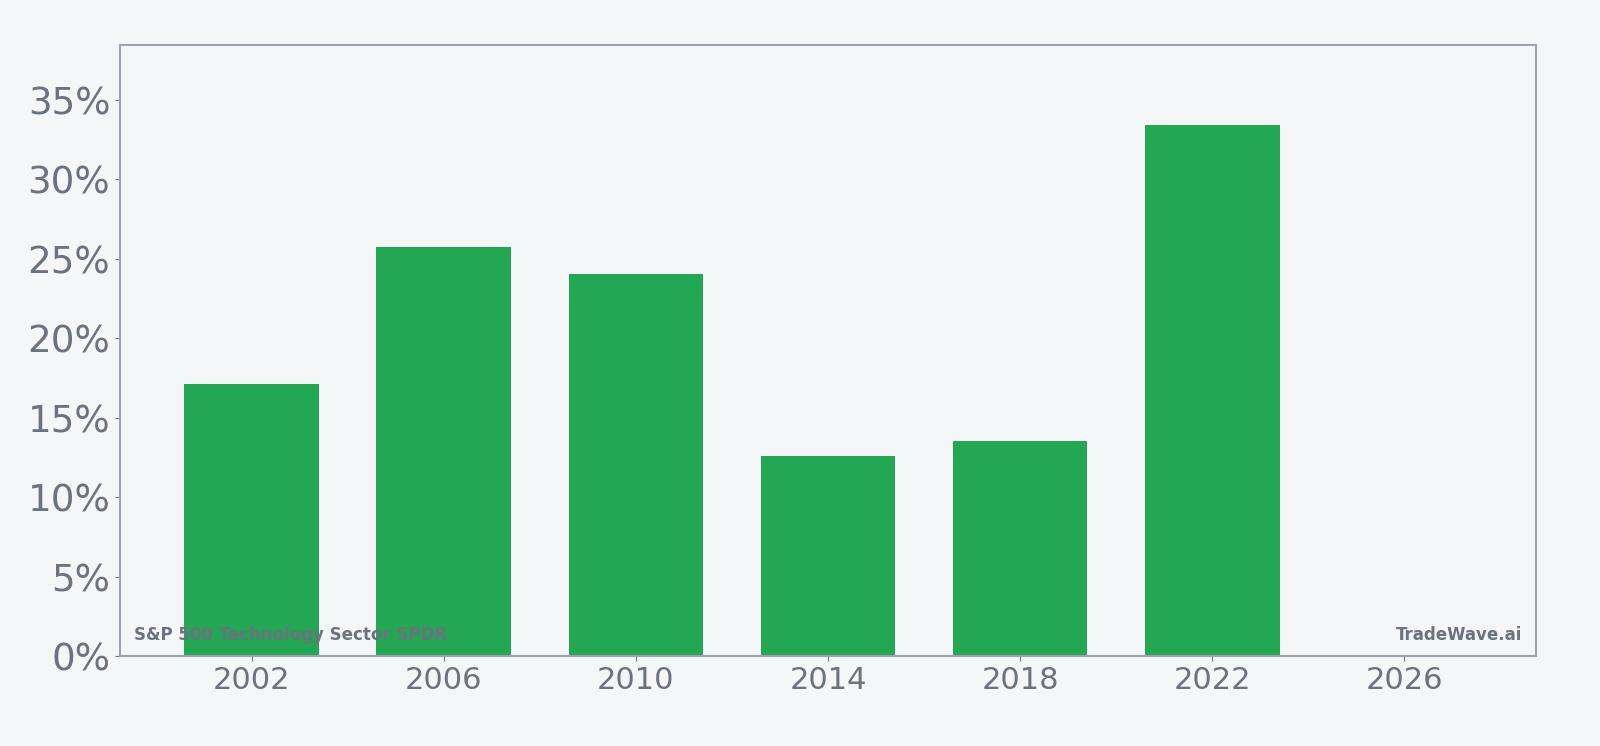
Across the six midterm years in the sample, XLK’s long trade direction has aligned cleanly with outcomes: every window finished positive, with net returns ranging from 12.61% in 2014 to 33.44% in 2022. The average winner gain of 21.08% sits well above the 8.08% standard deviation of outcomes, which helps explain the strong 2.13 Sharpe ratio for this setup. Add it up and the cumulative return across all six windows is 211%, a sizable contribution for investors who stayed long through the full seasonal regime.
The intraperiod path has not been a straight line. Maximum favorable moves inside the window have reached as high as 37.69% in 2022 and 34.48% in 2010, showing that when XLK trends in this stretch it can run far before pausing. At the same time, maximum adverse moves have occasionally been sharp, with a worst drawdown of -22.45% in 2002 and -17.23% in 2018 before the ETF ultimately finished those windows in the green. That mix of strong upside and meaningful downside swings is exactly what the TradeWave Ratio of 2.19 is designed to capture: how far price typically travels in the trade direction within the window, independent of the final close.
Looking at individual years, 2022 stands out as the strongest example of the pattern in action. XLK entered that midterm-year window around 62.71 and exited near 83.68, banking a 33.44% net gain while experiencing a maximum favorable move of 37.69% and a maximum adverse move of -12.22% along the way. On the softer side, 2014 still delivered a 12.61% net gain, but with a more modest 14.51% peak run-up and a -5.27% worst drawdown, illustrating that even the “quiet” versions of this window have historically been positive for longs.
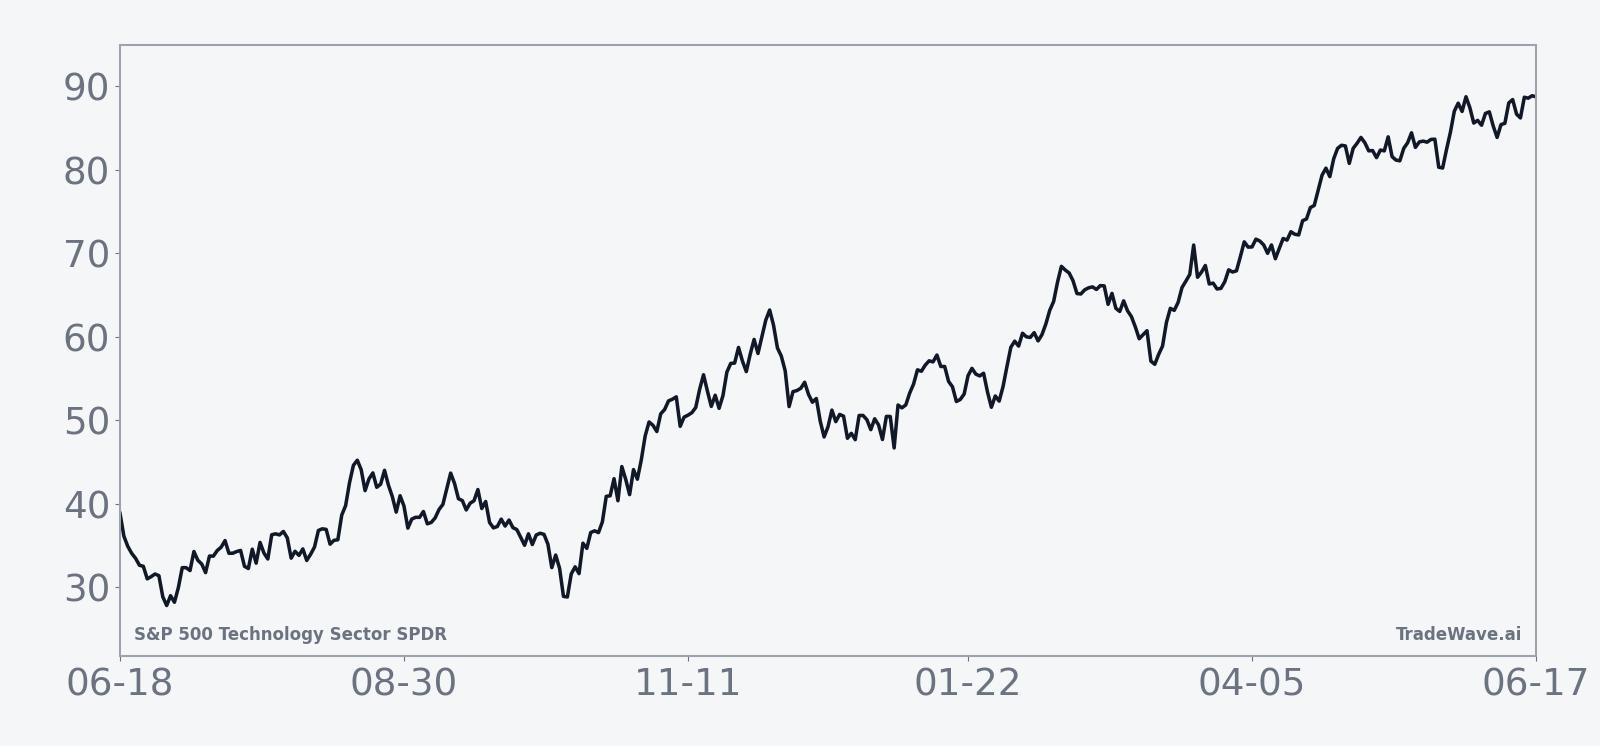
The historical seasonal average trend line for this window shows a steady upward bias rather than a single explosive burst. Gains tend to accrue across much of the 356-day span, with only brief periods where the average path flattens or dips, which is consistent with the long trade direction and the dominance of winning years in the sample.
A closer look at yearly net returns and intraperiod swings shows how upside and drawdowns have coexisted in this pattern.
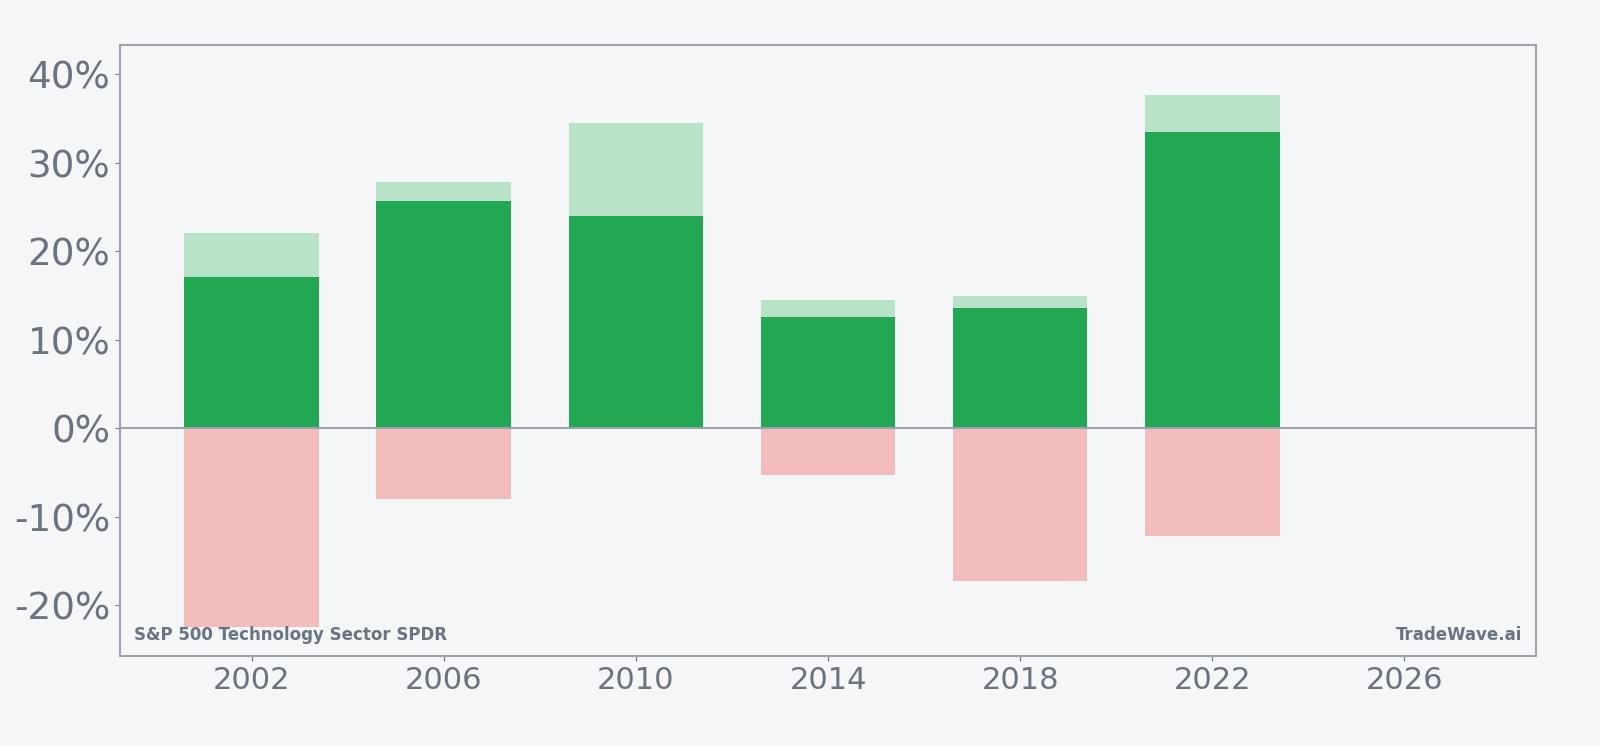
The combined net, maximum favorable, and maximum adverse bars highlight a clear pattern: XLK has historically delivered sizable upside potential in this window, but the path has often included double-digit drawdowns before the final gains were locked in. For traders, that means the window has rewarded patience with the long side, yet it has also punished anyone who could not tolerate volatility along the way.
History does not guarantee future results; adverse excursions can be large even in winning windows, and past midterm-year behavior may not repeat.
Why does S&P 500 Technology Sector SPDR (XLK) follow this seasonal pattern?
One likely driver is the way the tech sector’s earnings calendar and capital spending cycles line up with the midterm-to-pre-election phase, when corporate visibility often improves and risk appetite returns after early-cycle policy uncertainty. Analysts have also pointed to institutional portfolio rebalancing and sector rotation, with investors adding back growth and technology exposure as the political backdrop stabilizes ahead of the next presidential race. This pattern may also reflect the heavy weighting of mega-cap tech in major indices, which can amplify flows into XLK when broad equity sentiment turns more constructive late in the midterm year.
What is driving S&P 500 Technology Sector SPDR (XLK) today?
S&P 500 Technology Sector SPDR finished Jun 19 at 191.73, up 3.2% on the day, after trading between 189.38 and 191.62 on volume of about 8.7 million shares, below its 20-day average of roughly 15.0 million.[1] The ETF is trading above its 50-day moving average of 172.11 and sits about 3.5% below its 52-week high of 198.73, leaving it in a firmly bullish trend but not yet at fresh records.[1] With no single earnings or macro headline dominating the tape in this dataset, the move looks more like a continuation of the broader bid into large-cap technology than a reaction to a specific catalyst.
The chart below situates the latest move in its recent multi-month context and overlays a short-term seasonal projection.
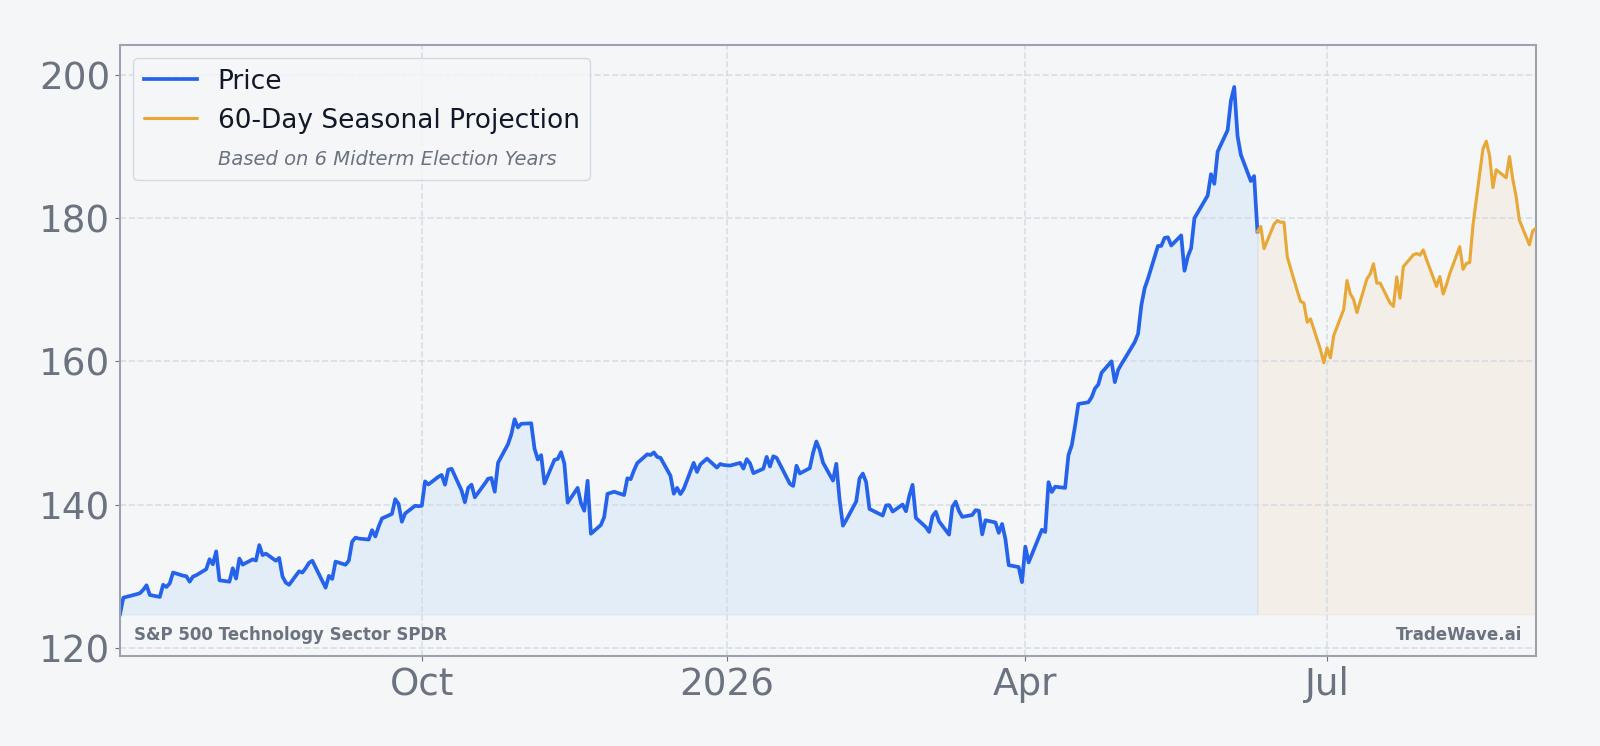
That backdrop matters because XLK is both a barometer and a driver of broader U.S. equity sentiment. Its largest holdings sit at the center of themes like artificial intelligence, cloud computing, and digital infrastructure, which have dominated index-level performance in recent years. If the ETF continues to grind higher into early July, it will be entering a historically strong seasonal window from a position of strength, which has previously coincided with extended rallies rather than abrupt reversals in this specific midterm-year pattern.
What should traders watch as this XLK seasonal window approaches?
First, the calendar: the 356-day window begins on Jul 2, so price action in the final weeks of June will shape the starting point for any seasonal analysis. A push back toward the 198.73 high before the window opens would mean the next cycle starts from stretched levels, while consolidation below that mark would leave more room above for the kind of 20% to 30% gains seen in prior midterm years.[1]
Second, volatility inside the window will be key. Historical maximum adverse moves as deep as -22.45% show that even winning years have included sharp pullbacks, so traders will want to track whether any early drawdowns stay within that historical envelope or break below it. A shallow pullback followed by renewed strength would be consistent with the past pattern, while a deeper or more persistent decline would be an early sign that this cycle is diverging from the script.
Third, watch how XLK trades around major macro and policy dates in the back half of the midterm year and into the pre-election year. Historically, this phase has seen a shift from policy uncertainty to a more supportive liquidity and sentiment backdrop for growth assets, which has lined up with the ETF’s strong seasonal record in this window. If upcoming data or policy decisions trigger sustained risk-off behavior in technology, that would challenge the historical tendency and could compress the kind of gains that have defined earlier cycles.
Finally, monitor breadth inside the technology complex. The seasonal pattern is built on XLK as a whole, not just a handful of mega-cap names, so participation from software, semiconductors, and hardware has mattered in prior midterm-year windows. Strong, broad-based advances would echo the historical 6-for-6 record, while a narrow rally led by only a few giants would make the pattern more fragile than the headline numbers suggest.
Sources
About this seasonal analysis
Seasonal pattern data is sourced from TradeWave.ai, which analyzes historical price behavior across annual calendar windows going back up to 30 years. Read the full data methodology or the book The 100-Year Pattern by Afshin Moshrefi (2026 edition). Past performance of seasonal patterns does not guarantee future results. This article is for informational purposes only and does not constitute investment advice.