Nasdaq QQQ Invesco ETF (QQQ) Hovers 1% Below Records as Fed Cut Talk Fuels Bullish Midterm Run
Nasdaq QQQ Invesco ETF is trading just below a fresh 52-week high as it approaches a midterm-year seasonal window that has never produced a losing year in the past six cycles.

What is the seasonal pattern for Nasdaq QQQ Invesco ETF (QQQ)?
Nasdaq QQQ Invesco ETF has risen in 6 of 6 midterm election-year windows like this one, with an average gain of 19.97% in winning years.
- 6 for 6 in this window, averaging 19.97% gains in winning years across the last six midterm election cycles.
- Percent Profitable is 100%, with 6 winners and 0 losers for a long trade direction in this 364-day Nasdaq QQQ Invesco ETF trading window.
- Average profit of 19.97% in winning years comes alongside a 19.87% annualized return and a Sharpe ratio of 3.04.
- The TradeWave Ratio (TWR) of 2.9 shows how far QQQ price typically travels in the long direction within the window, independent of the final close.
- Historical maximum adverse excursions have reached as deep as -22.39% in a single year, underscoring meaningful drawdown risk even in an all-winner sample.
- The strongest year in this pattern delivered a 24.85% net return, while the softest still gained 10.75%, highlighting a consistently bullish QQQ seasonal trend in midterm election years.
According to historical data from TradeWave.ai, this upcoming midterm-year stretch for QQQ has behaved very differently from an average calendar year. The next section walks through how that election-cycle pattern has played out in prior midterm years and what it means for the window that opens this week.
How has Nasdaq QQQ Invesco ETF (QQQ) traded in past midterm-year windows?
Nasdaq QQQ Invesco ETF has risen in every one of the last six midterm election-year windows like the one that begins on Jun 25, 2026, averaging a 19.97% gain for long positions. Today QQQ closed at 740.62, up 2.5% on the session and about 1.1% below its 52-week high of 748.65, putting this historical seasonality on the radar just as the ETF hovers near record territory.
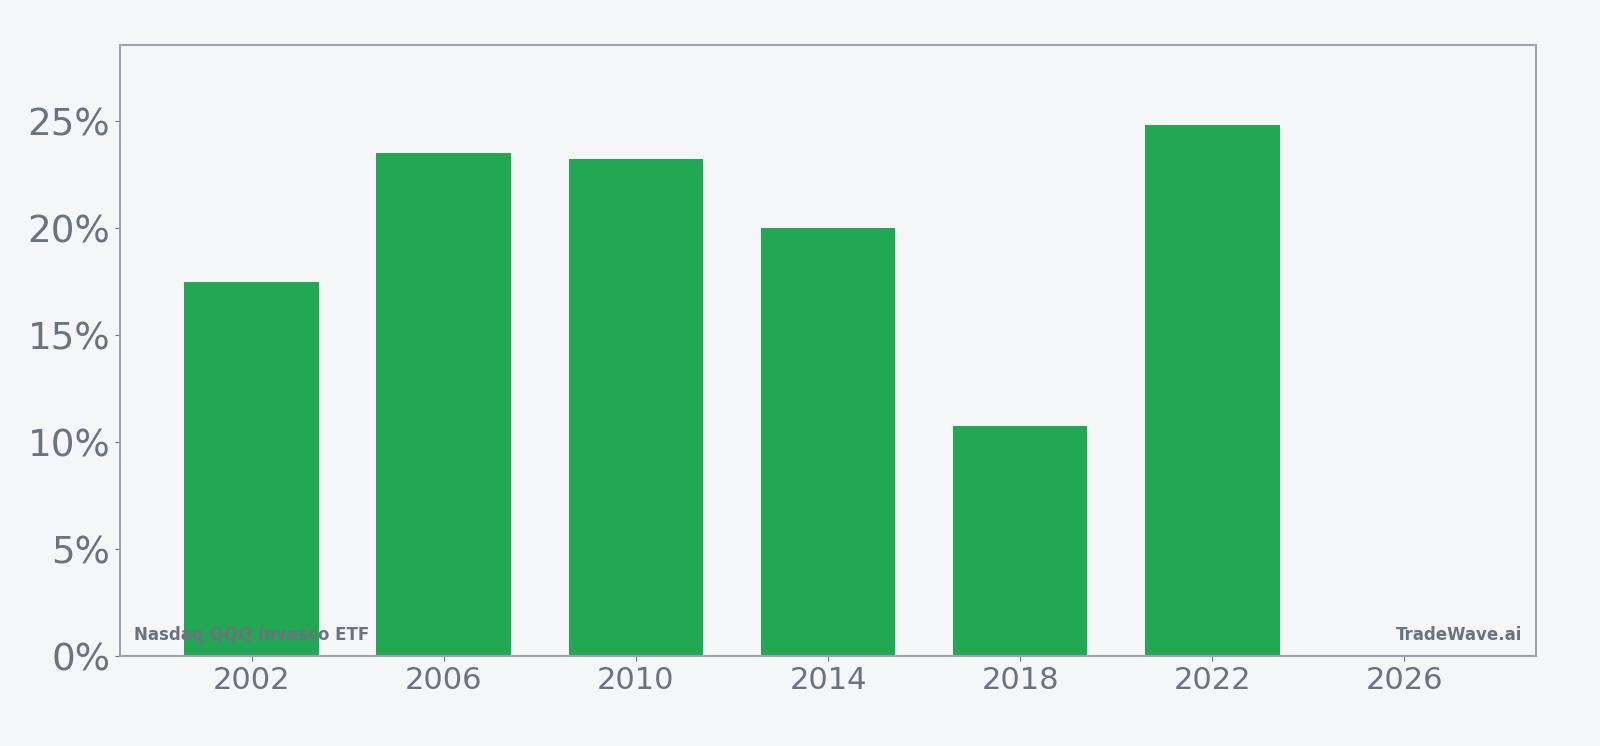
Because this pattern is grouped by the presidential election cycle, it only looks at midterm election years, not every calendar year. That matters for QQQ, which is heavily tilted to large-cap technology and growth stocks that tend to be sensitive to policy shifts, regulation debates and liquidity conditions that often change in the middle of a presidential term.
This seasonal window begins on Jun 25 and spans 364 trading days, effectively running from late June of the midterm election year into late June of the following pre-election year. Historically, during this period, Nasdaq QQQ Invesco ETF has shown a strong bullish tendency for long exposure. The trade direction is explicitly long, and across the last six midterm cycles the Percent Profitable is 100%, with 6 winners and 0 losers.
Average profit in those winning years is 19.97%, with a median outcome of 21.62%, so the typical midterm-year iteration has delivered a double-digit gain for QQQ over the full window. The cumulative return across all six windows is 196%, which works out to a 19.87% annualized return, and the Sharpe ratio of 3.04 points to unusually strong risk-adjusted performance for this specific slice of the calendar.
The per-year breakdown shows that even the weakest midterm-year window in this sample, 2018, still produced a 10.75% net gain from entry to exit. The strongest year, 2022, delivered a 24.85% net return, while 2006 and 2010 also posted gains above 23%. Add it up: six midterm election years, six positive outcomes, and no single year with a negative net result for this QQQ seasonal pattern.
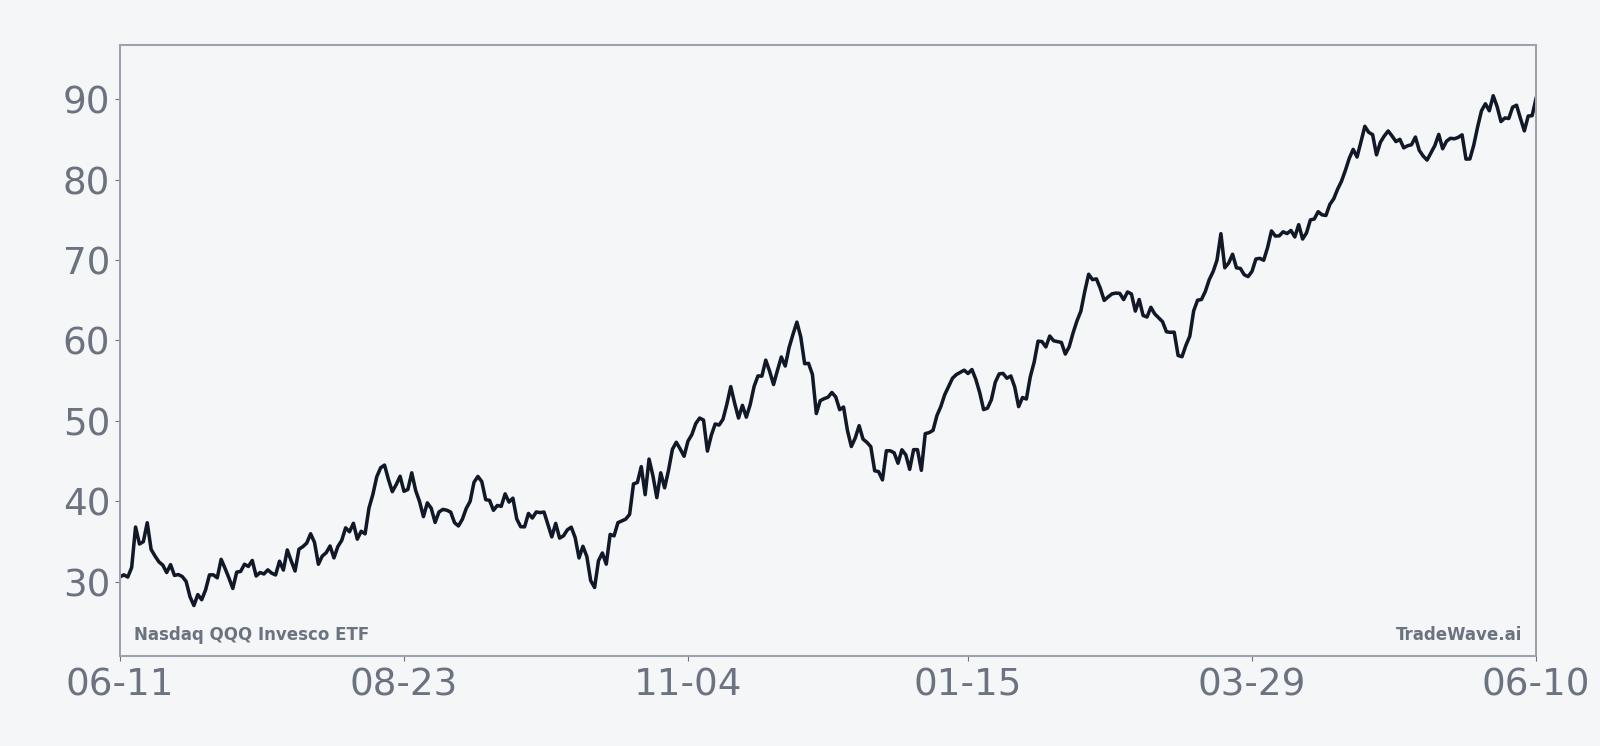
The historical seasonal average trend line suggests that QQQ’s gains in this window have not been front-loaded into a single month. Instead, returns have tended to build over the full year, with periods of consolidation and pullback along the way but a clear upward drift when the entire window is viewed as one trade. That fits a pattern where tech-led rallies often accelerate as the midterm year gives way to the pre-election year, when risk appetite has historically improved.
A second view that combines net results with peak run-ups and worst drawdowns shows how much QQQ has typically moved inside the window before the final outcome is set.
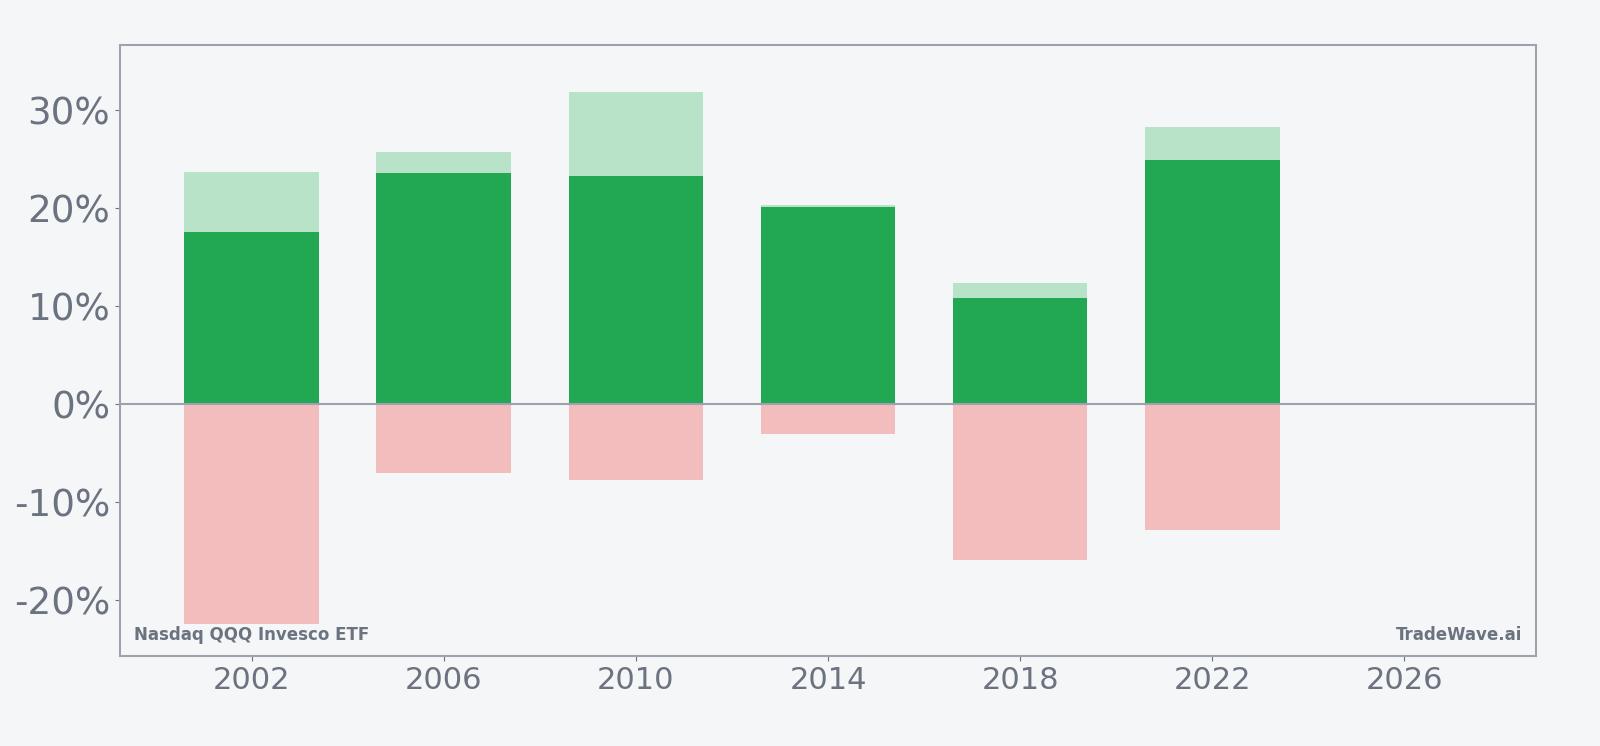
The maximum favorable move within the window has ranged from 12.37% in 2018 to 31.83% in 2010, showing that in strong years QQQ has often pushed well beyond the final net gain before giving some ground back. On the downside, the worst intraperiod drawdown reached -22.39% in 2002, with other years seeing adverse moves between roughly -3% and -15.9%, so even winning windows have included sharp pullbacks. The TradeWave Ratio of 2.9 captures this dynamic by measuring how far price typically travels in the trade direction within the window, independent of where it finishes.
Looking at individual years, 2002 stands out as a case where QQQ ultimately gained 17.48% but endured a -22.39% drawdown at one point, while 2014 delivered a smoother 20.03% gain with only a -3.04% worst excursion. That spread between the calmest and choppiest years is a reminder that the same bullish seasonal tendency can play out with very different volatility profiles depending on the macro backdrop and policy environment of each midterm cycle.
History does not guarantee future results; adverse excursions (MAE) can be large even in winning windows.
Why does Nasdaq QQQ Invesco ETF (QQQ) follow this seasonal pattern?
This midterm-to-pre-election pattern may reflect how investors reposition around policy risk and growth expectations in the middle of a presidential term. One likely driver is the clustering of macro and regulatory headlines that hit large-cap technology and growth stocks during midterm years, followed by a tendency for risk appetite to improve as the next election cycle comes into view. Portfolio rebalancing, index flows and the tech earnings calendar can amplify that effect, turning this long midterm-year window into a period where QQQ has historically trended higher despite meaningful drawdowns along the way.
What is driving Nasdaq QQQ Invesco ETF (QQQ) today?
QQQ finished Jun 22 at 740.62, up 18.11 points or 2.5% on the day, with intraday trading between 732.51 and 741.82 on volume of about 50.2 million shares. That leaves the ETF roughly 1.1% below its 52-week high of 748.65 and well above its 50-day moving average around 693.18, underscoring how strong the recent tech-led advance has been.
In midterm election years, macro policy often looms large for QQQ because of its heavy exposure to mega-cap technology and growth names. In October 2025, analysis from CNBC highlighted how traders were watching key moving averages and potential support levels in QQQ as volatility picked up around Federal Reserve policy expectations and broader macro uncertainty, with some investors turning to put spreads as hedges against downside risk.[1] That backdrop of rate-cut speculation and elevated volatility remains a key lens for how traders interpret any pullbacks or breakouts as this new seasonal window opens.
The chart below situates the latest move in its recent multi-month context and overlays a short-term seasonal projection.
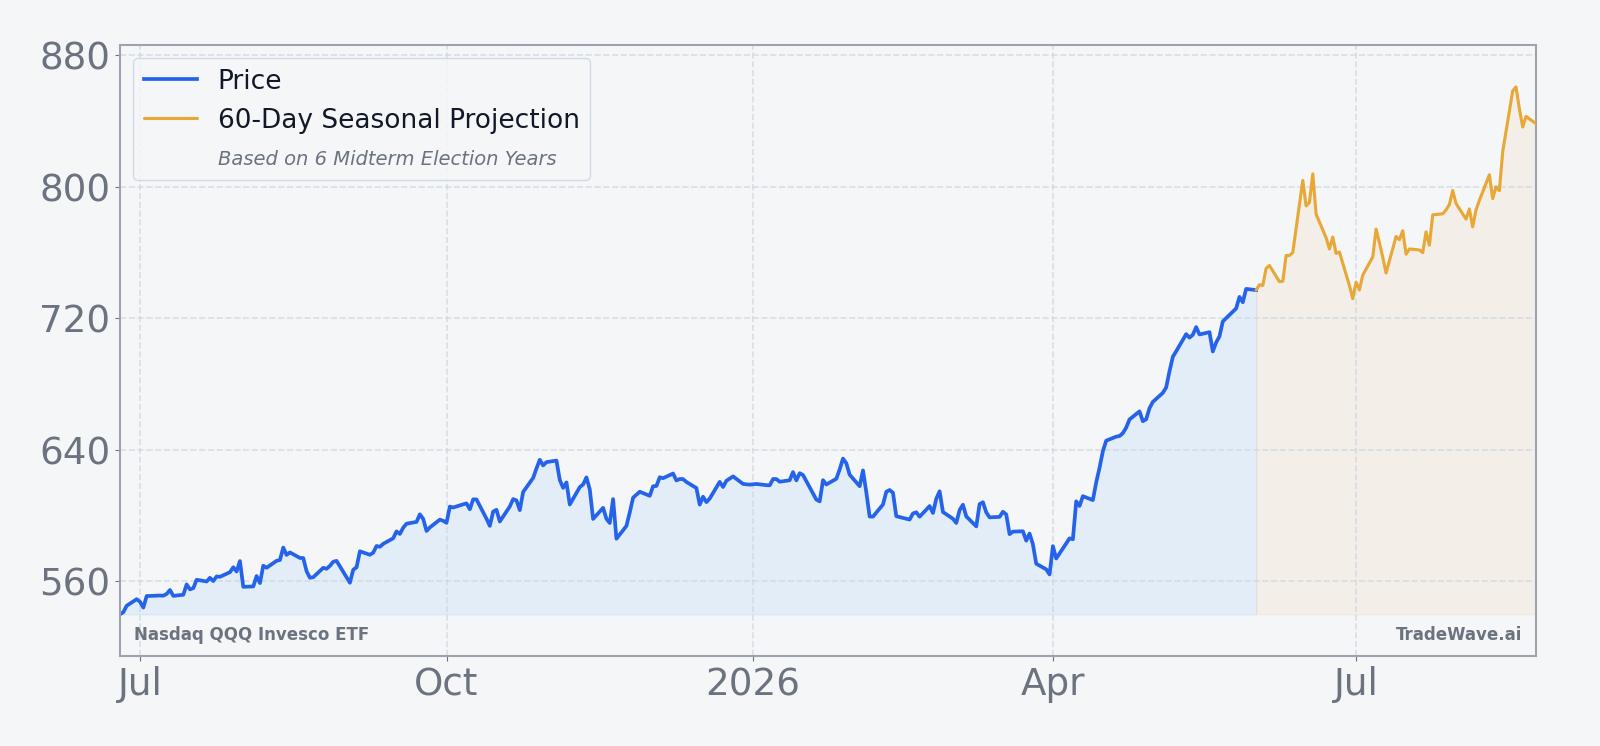
For traders, the tension is clear. QQQ is already near record highs after a powerful run, yet the historical seasonality for this specific midterm-year window has been strongly positive for long exposure. That combination raises the stakes around any macro surprises, since prior cycles show that even within an all-winner pattern, drawdowns of 10% to 20% have not been unusual before the longer-term uptrend reasserts itself.
What should traders watch as this QQQ seasonal window opens?
First, watch how QQQ behaves around the 52-week high near 748.65 as the Jun 25 window kicks in. A sustained break above that level with pullbacks that hold near the 50-day moving average would be consistent with the historical pattern of strong but sometimes choppy gains across the midterm-to-pre-election stretch.
Second, monitor volatility around major macro events, especially Federal Reserve decisions and data that could shift expectations for rate cuts or hikes. In October 2025, chart-based analysis of QQQ emphasized the importance of support zones and hedging strategies when volatility picked up around policy headlines,[1] and similar dynamics could shape how any intraperiod drawdowns unfold in this cycle.
Third, keep an eye on sector leadership inside QQQ. The historical seasonal trend has been strongest when large-cap technology and growth names have led the market higher, so a rotation away from those groups during the window would be one sign that this cycle might diverge from the prior six. Conversely, if AI and cloud leaders continue to drive index gains, that would align more closely with the bullish midterm-year seasonal pattern.
Finally, track the depth and timing of pullbacks. History shows that even in winning years, QQQ has sometimes dropped more than 15% inside the window before finishing higher. If early drawdowns stay relatively shallow and are met with strong dip-buying, it would echo the smoother years like 2014. Deeper, faster selloffs would look more like 2002 or 2018, where the path was rougher even though the full-window trade still ended in the green.
Sources
About this seasonal analysis
Seasonal pattern data is sourced from TradeWave.ai, which analyzes historical price behavior across annual calendar windows going back up to 30 years. Read the full data methodology or the book The 100-Year Pattern by Afshin Moshrefi (2026 edition). Past performance of seasonal patterns does not guarantee future results. This article is for informational purposes only and does not constitute investment advice.