This 363-Day Midterm Window Has Delivered 213% Cumulative Gains for S&P 500 Technology Sector SPDR (XLK)
S&P 500 Technology Sector SPDR is nearing a midterm-year seasonal window that has never posted a loss in this dataset, giving tech traders a long-cycle backdrop to weigh against day-to-day volatility.

What is the seasonal pattern for S&P 500 Technology Sector SPDR (XLK)?
S&P 500 Technology Sector SPDR has risen in 6 of 6 midterm-year windows starting around Jul 31, with an average gain of 21.17% in winning years.
- 6 for 6 in this midterm-year window, with average winner gains of 21.17% across the sample.
- Seasonal window begins Jul 31, 2026 and spans 363 calendar days, covering the late midterm year into the pre-election year.
- Percent Profitable is 100%, with 6 winners and 0 losers in the last six midterm election years.
- Trade Direction is long, supported by a Sharpe ratio of 2.41 and a TradeWave Ratio (TWR) of 2.5.
- Individual years have seen maximum favorable moves as high as 37.62%, but adverse excursions have reached roughly -21% inside otherwise winning trades.
- Cumulative return across the six historical windows totals 213%, highlighting how persistent this XLK seasonal trend has been in midterm cycles.
According to historical data from TradeWave.ai, this upcoming stretch for XLK has behaved very differently from an average year in prior midterm cycles. The next section walks through that election-cycle seasonality in detail, separate from any short-term headlines.
How strong is the upcoming seasonal window for S&P 500 Technology Sector SPDR (XLK)?
S&P 500 Technology Sector SPDR has posted gains in every one of the last six midterm election years during the 363-day window that starts around Jul 31, averaging 21.17% per cycle. With the next iteration of that window set to begin on Jul 31, 2026, traders are weighing a historically powerful tech-sector tailwind against whatever the tape is doing in the moment. Because this regime runs almost a full year, it effectively bridges the back half of the midterm election year into the heart of the pre-election year, when risk appetite has often been stronger for growth and technology stocks.
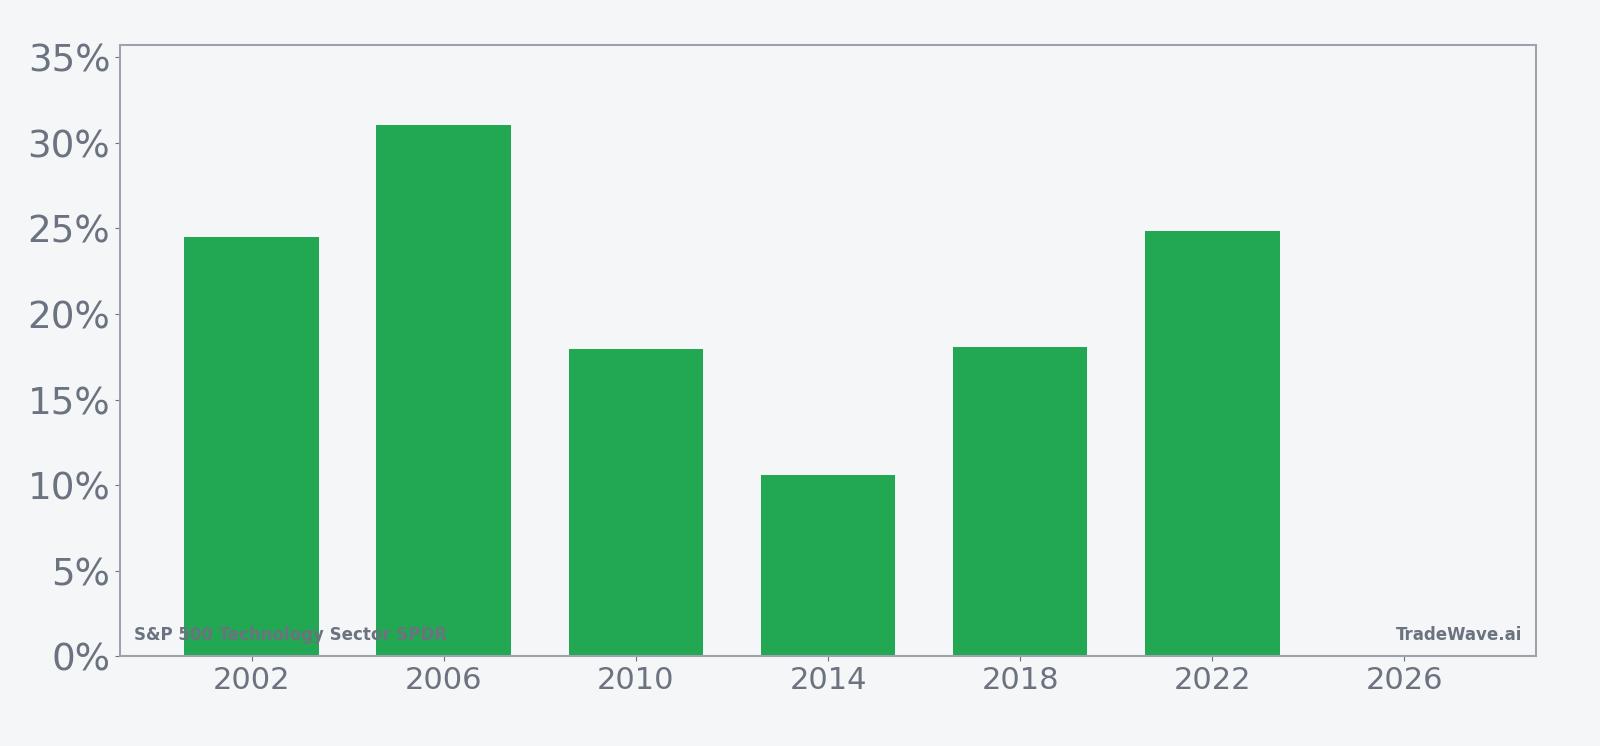
Grouping the data by the presidential election cycle matters here because this XLK pattern only looks at midterm election years, not every calendar year. That focuses the analysis on a policy backdrop where Washington is in the middle of a term, fiscal and regulatory agendas are clearer, and markets are already starting to discount the next presidential race.
Across the six midterm-year samples, the trade direction is firmly long. Percent Profitable is 100%, with 6 winners and 0 losers, and the average gain of 21.17% lines up closely with the 21.29% median, which tells you the distribution of outcomes has been tight rather than skewed by a single outlier year. The weakest of the six windows still delivered a 10.59% net return, while the strongest year, 2006, posted a 31.05% gain from entry to exit.
The intraperiod path has not been smooth, even in winning years. Maximum favorable moves have ranged from 14.38% in 2014 to 37.62% in 2006, showing that XLK has often pushed well beyond its final net gain at some point during the window. On the downside, maximum adverse excursions have stretched to roughly -20.39% in 2002 and -21.31% in 2022, underscoring that even a historically bullish tech-sector seasonal window can include deep drawdowns before finishing higher.
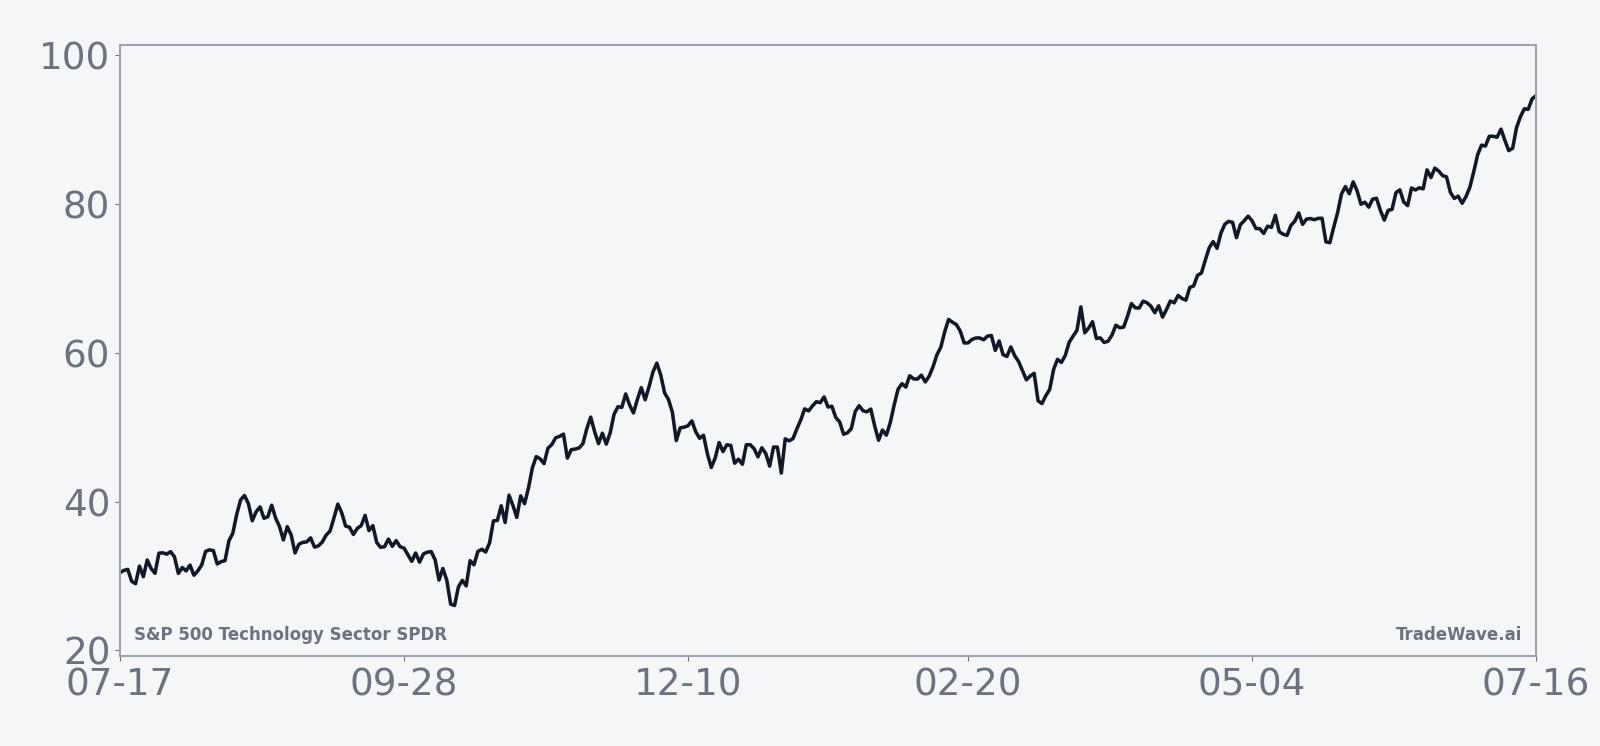
The historical seasonal trend chart for this pattern shows a fairly steady upward slope rather than a single explosive burst. Gains tend to accrue across the full 363-day span, with only brief pauses and pullbacks, which fits with the idea of a long regime that straddles the late midterm year and the pre-election year rather than a short tactical trade. In other words, the typical XLK seasonal outlook here is a grind higher, not a quick spike.
A second view combines net results with the best and worst intraperiod swings to show how far XLK has tended to travel inside the window.
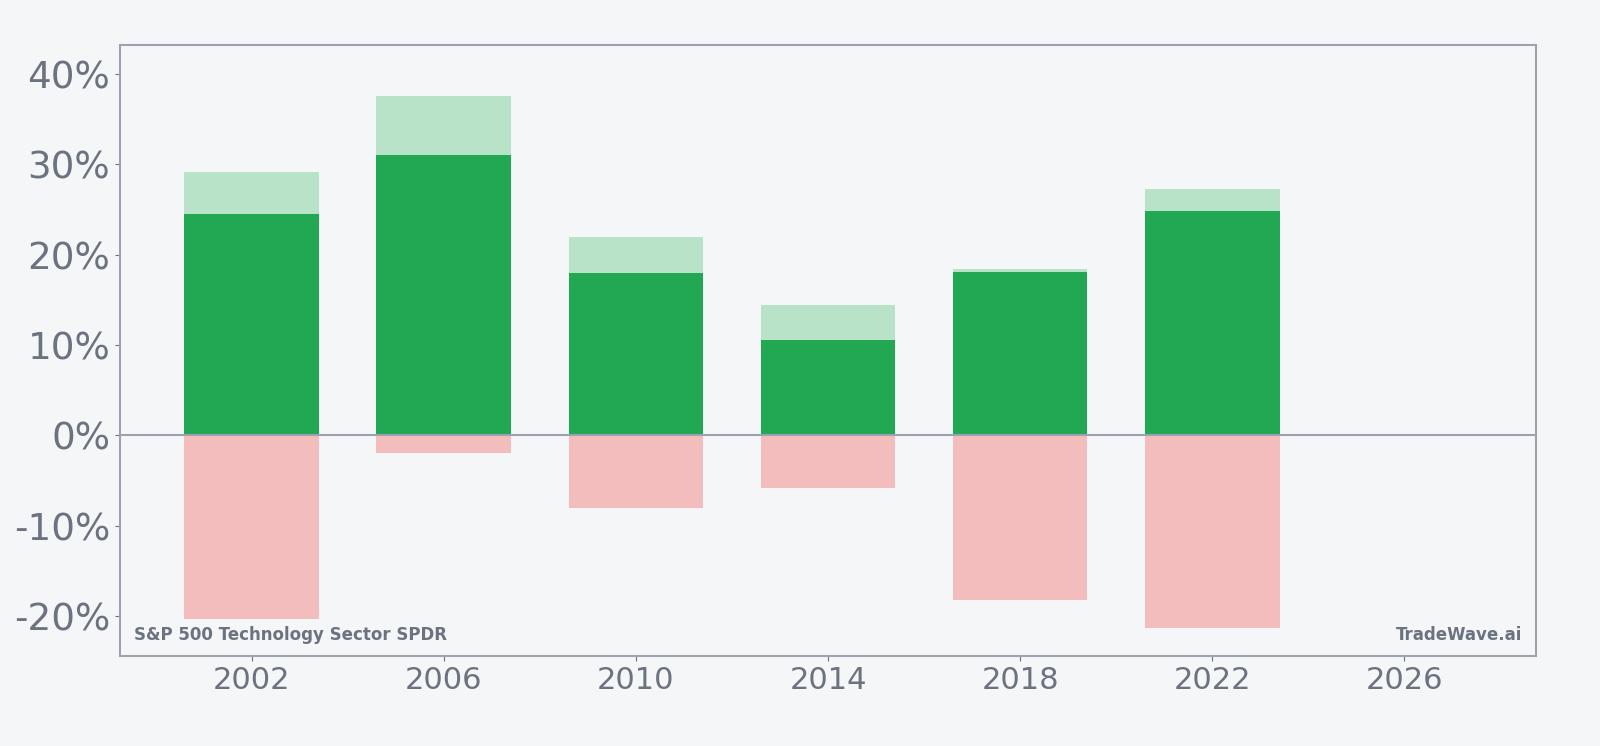
The combined net / MFE / MAE view makes the trade-off clear: every year finished positive, but several saw double-digit drawdowns along the way, especially 2002, 2018 and 2022. For long-only investors, that history suggests the window has rewarded patience, while shorter-term traders may see opportunity in the swings themselves. Add it up: six straight winning midterm-year windows, 213% cumulative gains, and a pattern that has favored staying long XLK through a full election-cycle regime shift.
History does not guarantee future results; adverse excursions (MAE) can be large even in winning windows.
Why does S&P 500 Technology Sector SPDR (XLK) follow this seasonal pattern?
One likely driver is the way the tech earnings calendar and capital spending plans line up with the midterm and pre-election years. Corporate IT budgets and cloud spending often ramp as economic visibility improves, and that has tended to coincide with friendlier policy signals and more stable rate expectations late in the presidential cycle. This pattern may also reflect institutional portfolio repositioning into growth and technology as the market starts to discount the next administration and a potential pickup in risk appetite.
What is driving S&P 500 Technology Sector SPDR (XLK) today?
Day to day, XLK is trading without a single dominant catalyst in view, and the usual drivers are in play: earnings revisions across mega-cap tech, shifting expectations for interest rates, and the broader debate over how much AI spending can support sector margins. Average 20-day volume sits around 13.78 million shares, which keeps liquidity deep enough for both institutional and retail traders even when volatility picks up. With the ETF roughly 1.28% lower over the past month, the tape has cooled just enough to make the upcoming seasonal window a more interesting backdrop than it might have been after a straight-line rally.
The chart below situates the latest move in its recent multi-month context and overlays a short seasonal projection.
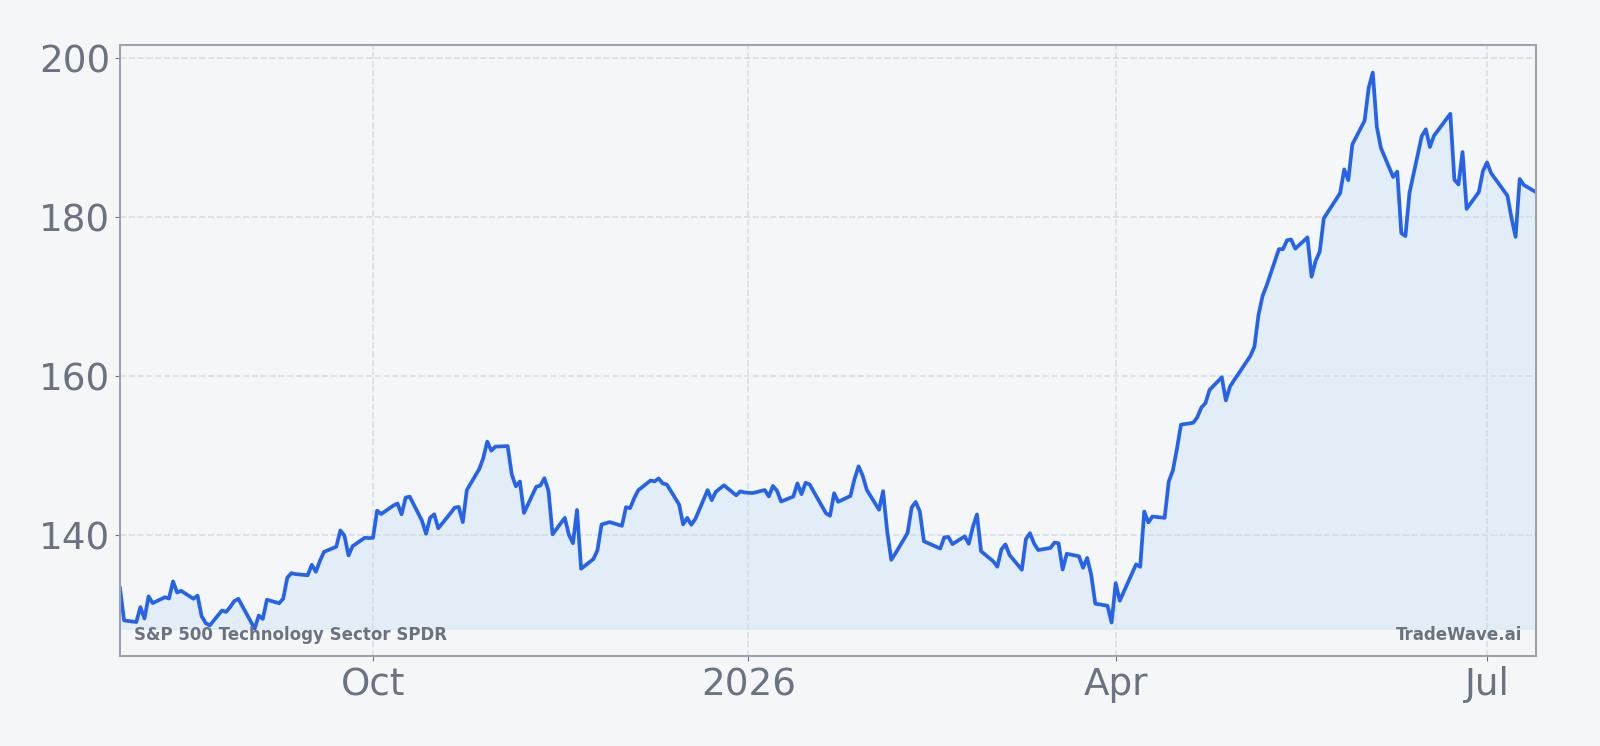
From a structural standpoint, XLK also sits inside a much broader midterm-to-pre-election regime that has historically been one of the strongest stretches for U.S. equities. The 52-week range, from about 62.64 on the low end to 198.26 on the high, shows how far the tech sector has already traveled in this cycle, and the 50-day moving average near 179.65 offers a simple line in the sand many traders watch for trend confirmation. Against that backdrop, the long midterm-year seasonal window starting Jul 31 is less about calling the next week’s move and more about framing how tech has tended to behave as Washington moves from midterm gridlock toward the next presidential race.
What should traders watch as this XLK seasonal window approaches?
First, watch how XLK behaves as Jul 31 approaches relative to its 50-day moving average around 179.65 and the upper end of its recent range. Strength into the start of the window would line up with the historical pattern of persistent gains, while a sharp break lower would test how durable that 6-for-6 record really is. Second, keep an eye on sector-level earnings guidance from the largest XLK constituents; upbeat commentary on AI, cloud and enterprise software spending would fit the historical script of stronger tech performance into the pre-election year.
Third, monitor macro catalysts tied to the policy calendar, including any shifts in rate expectations or regulatory headlines that could alter the tech risk premium. The historical seasonality does not depend on any single event, but it has played out against a backdrop where liquidity conditions and fiscal policy were at least not getting worse. Finally, as the window unfolds, the key tell will be how XLK trades around double-digit pullbacks: in prior cycles, those drawdowns have been buying opportunities inside an otherwise bullish regime. If a similar dip this time fails to attract demand, that would be an early sign that this midterm-year pattern is starting to break.
Sources
About this seasonal analysis
Seasonal pattern data is sourced from TradeWave.ai, which analyzes historical price behavior across annual calendar windows going back up to 30 years. Read the full data methodology or the book The 100-Year Pattern by Afshin Moshrefi (2026 edition). Past performance of seasonal patterns does not guarantee future results. This article is for informational purposes only and does not constitute investment advice.