This 155-Day Midterm Window Has Delivered 6 of 6 Winners for S&P 500 Healthcare Sector SPDR (XLV)
S&P 500 Healthcare Sector SPDR is about to enter a historically strong 155-day midterm-year seasonal window, just as healthcare leadership and bullish options flow keep traders focused on the sector.

What is the seasonal pattern for S&P 500 Healthcare Sector SPDR (XLV)?
S&P 500 Healthcare Sector SPDR has risen in 6 of 6 midterm-election-year windows starting around Jul 11 and lasting 155 days, with an average gain of 9.18% in winning years.
- 6 for 6 in this 155-day midterm-year window, with average gains of 9.18% in winning years.
- Percent Profitable is 100%, with 6 winners and 0 losers across the last six midterm election years.
- The upcoming window begins Jul 11, 2026 and runs roughly into early December, covering the heart of the midterm-year policy calendar.
- Average profit of 9.18% across all years reflects a tight cluster of mid-to-high single-digit gains rather than one outlier spike.
- Historical intraperiod swings have included double-digit drawdowns in some years, so downside volatility has still been meaningful even in winning windows.
- The pattern aligns with healthcare’s role as a defensive sector during mid-cycle policy uncertainty, giving XLV a distinct seasonal trend compared with the broader market.
According to historical data from TradeWave.ai, this midterm-year stretch for XLV has behaved very differently from an average half-year on the calendar, and the next iteration starts this weekend.
How has S&P 500 Healthcare Sector SPDR (XLV) traded in this midterm-year window?
Grouping by the presidential election cycle matters here because this pattern looks only at the last six midterm election years, when policy risk and sector rotation often diverge from typical bull-market behavior. S&P 500 Healthcare Sector SPDR has risen in all six of those 155-day windows starting around Jul 11, averaging a 9.18% gain with no losing years in the sample. The next window begins on Jul 11, 2026 and runs for roughly five months, giving healthcare traders a clearly defined seasonal backdrop as the midterm year unfolds.
This seasonal window begins on Jul 11 and spans 155 calendar days. Historically, during this period, S&P 500 Healthcare Sector SPDR has shown a consistently bullish tendency for long exposure, with every midterm-year iteration finishing higher than it started. The trade direction for this pattern is explicitly long, so the historical gains line up with the intended side of the trade rather than fighting the tape.
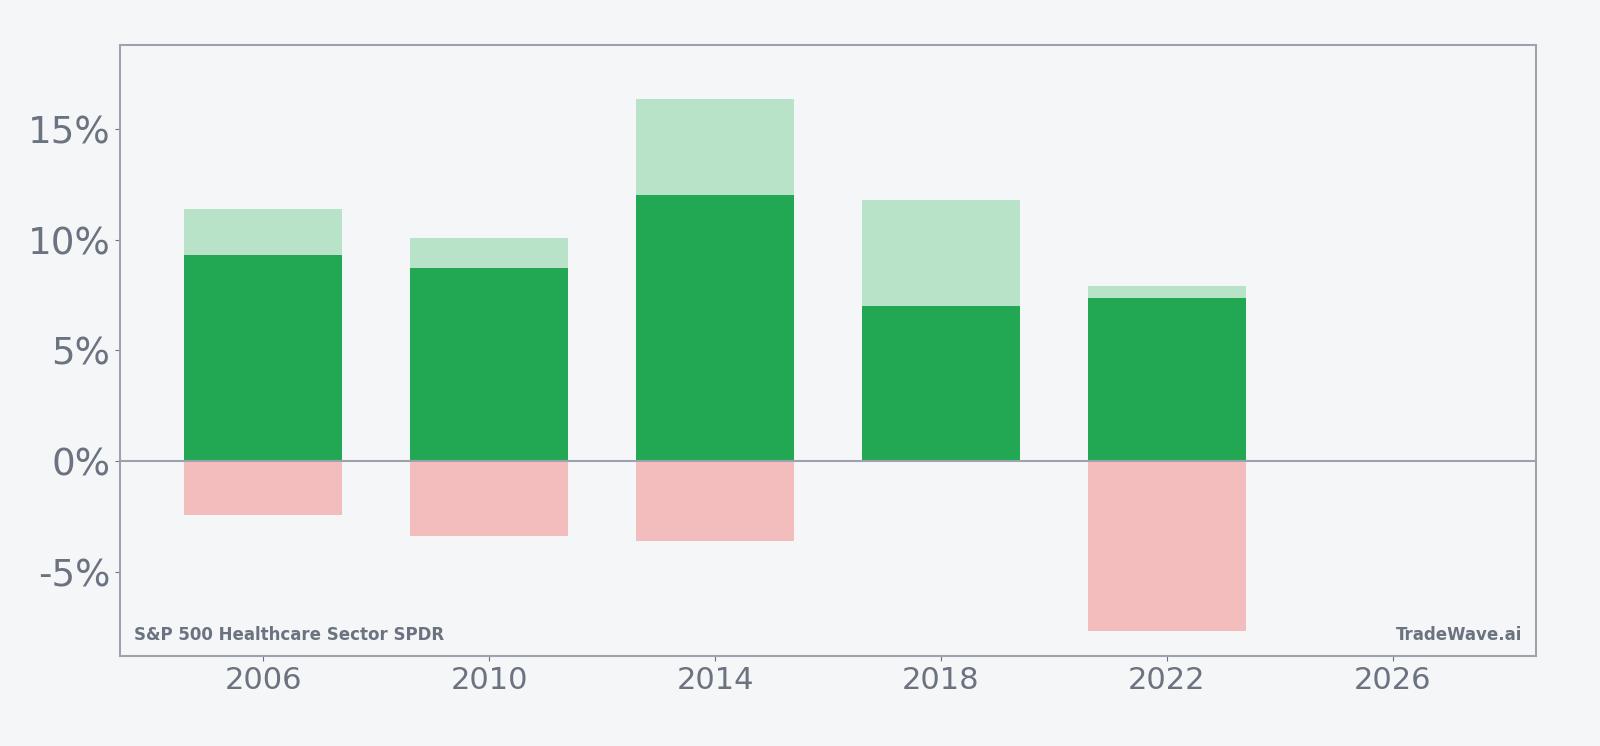
Across the six midterm-election-year samples, Percent Profitable is 100%, with 6 winners and 0 losers. Average profit in winning years is 9.18%, and because there are no losing years in the dataset, the all-years average is the same 9.18% figure. That makes this less about one monster outlier and more about a steady cluster of mid-to-high single-digit advances, from a 7.01% gain in 2018 to a 12.02% gain in 2014.
The TradeWave Ratio (TWR) for this pattern is 3.09, which means the price of XLV has typically traveled a substantial distance in the trade direction within the window, independent of where it finally closed. The Sharpe ratio of 3.88 points to a strong risk-adjusted profile based on end-of-window outcomes, reflecting both the consistency of positive returns and relatively contained dispersion across years.
Intraperiod swings have still been meaningful. Maximum favorable moves inside the window have ranged from 7.9% in 2022 to 16.44% in 2002, showing that in strong years XLV has often pushed well beyond its final gain before consolidating. On the downside, the worst adverse excursions have stretched to about -11.92% in 2002 and -7.65% in 2022, underscoring that even winning midterm-year windows have included sizable drawdowns before finishing higher.
The per-year pattern shows 2014 as the standout winner, with a 12.02% net return and a 16.33% peak run-up from entry, while 2018 and 2022 sit at the lower end of the range with gains just above 7%. That spread suggests the window has historically delivered a “floor” of mid-single-digit gains for longs in this sample, with occasional double-digit upside when macro and policy conditions line up in healthcare’s favor.
Trend metrics inside the window lean clearly to the upside. The long-trend score of 68 versus a short-trend score of 6, and an even stronger 76 versus 0 on the shorter-term trend view, indicate that XLV has tended to grind higher more often than not throughout the window rather than delivering a single sharp spike. The average cumulative return path shows gains building steadily over the 155 days, with only modest mid-window pauses before the pattern typically finishes the year’s stretch in positive territory.
Because this analysis is anchored in midterm election years, it also overlaps the broader midterm-to-pre-election regime that has historically been one of the strongest stretches for the S&P 500 in Afshin Moshrefi’s 100-Year Pattern framework. XLV’s own seasonal trend inside that regime has leaned even more defensive and consistent, reflecting healthcare’s role as a relative safe harbor when policy debates and rate uncertainty pick up.
Put together, the message from the seasonal stats is straightforward: six for six, with average gains near 9% and a tendency for XLV to trend higher across the bulk of the window rather than chopping sideways. History does not guarantee a repeat, but the consistency across two decades of midterm election years is hard to ignore.
Why does S&P 500 Healthcare Sector SPDR (XLV) follow this seasonal pattern?
One likely driver is the way healthcare policy and reimbursement debates cluster around the midterm-year legislative calendar, which can push investors toward defensive sector exposure as headlines heat up. Analysts also point to institutional portfolio rebalancing and sector rotation, with managers adding healthcare weight as growth sectors wobble mid-cycle and as earnings visibility in drugmakers and insurers looks relatively stable. This pattern may also reflect the timing of major healthcare conferences and product news, which often land in the back half of the year and can support flows into XLV during this specific window.
History does not guarantee future results, and the worst intraperiod drawdowns in this window have still reached double digits even when the final outcome was positive.
What is driving S&P 500 Healthcare Sector SPDR (XLV) today?
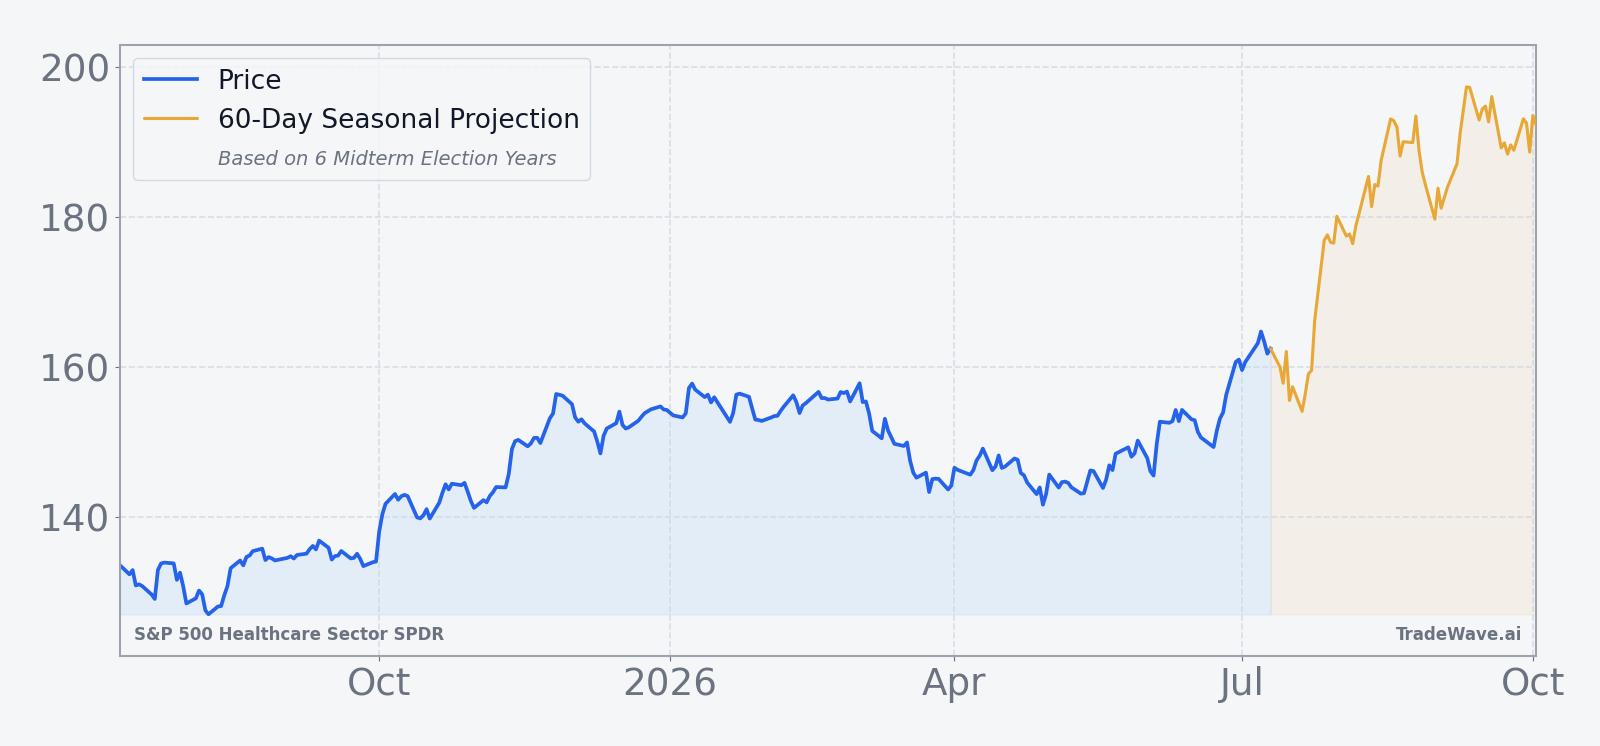
S&P 500 Healthcare Sector SPDR heads into this midterm-year seasonal window after a powerful rotation into healthcare, with the ETF up roughly 25% from its August lows and leading one- and three-month sector performance in the S&P 500.[1] That move followed a bottoming pattern in late September 2025 and a strong breakout that left XLV on track for its first weekly overbought reading since August 2024, a setup that often invites tactical pullbacks even within a broader uptrend.[1] Options traders have leaned into the strength: in early June 2026, call buyers dominated activity in XLV, with about 5,300 calls trading versus roughly 1,000 puts and $11 million of $13 million in notional tied to calls, signaling a clear bullish skew in positioning.[2]
The chart below shows XLV’s past year of trading alongside a 60-day seasonal projection, highlighting how the recent breakout lines up with the historical midterm-year pattern.
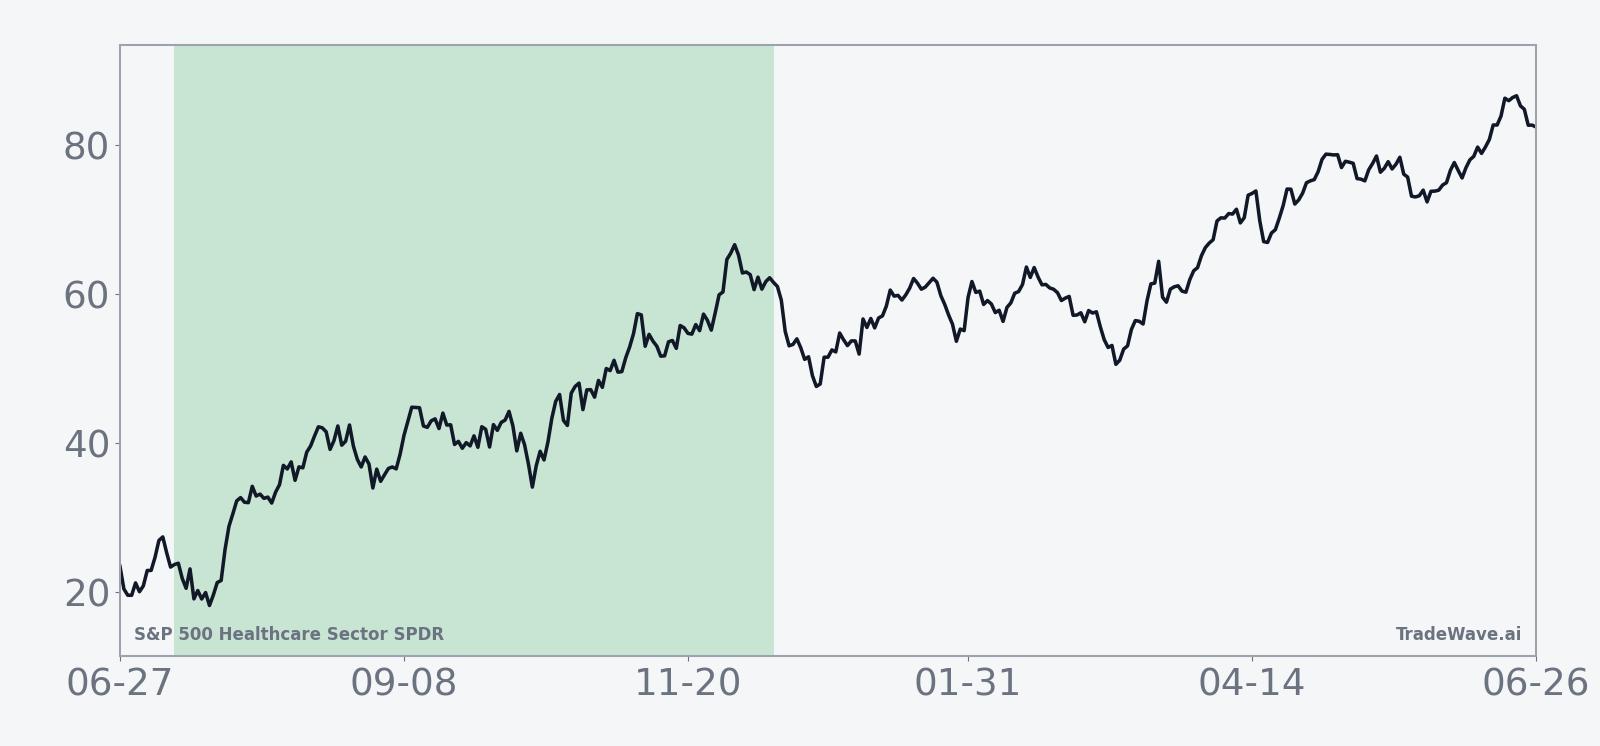
Year-by-year net returns and intraperiod swings show how consistently XLV has finished higher while still experiencing meaningful drawdowns along the way.
What should traders watch in this XLV seasonal window?
For the next 155 calendar days starting Jul 11, the key question is whether XLV behaves like the prior six midterm election years, where every instance finished with a gain and average profits clustered around 9%. The first checkpoint is how the ETF trades around any early drawdowns: in past cycles, even the strongest years saw pullbacks of up to roughly 10% inside the window before recovering, so a sharp dip would not automatically break the pattern as long as buyers step back in.
Policy and macro headlines will matter. Healthcare often sits at the center of budget debates, drug-pricing proposals and election messaging in midterm years, and those storylines can drive both defensive inflows and short bursts of volatility. Traders will be watching whether XLV continues to act as a leadership group when broader risk sentiment wobbles, or whether it starts to lag if rates back up or regulatory rhetoric intensifies.
The options market is another important tell. The early June surge in call buying, with roughly five calls trading for every put and most of the notional tied to bullish structures, showed that speculative and hedging flows were leaning hard to the upside.[2] If that call-heavy skew persists or even builds as the seasonal window progresses, it would signal that investors are leaning into the historical pattern; a sharp reversal toward put demand or collapsing call volumes would suggest traders are fading the seasonality instead.
Finally, watch how XLV trades around key technical levels and sector breadth. A pattern-consistent path would likely feature shallow-to-moderate pullbacks that hold above the 50-day moving average, continued leadership from large-cap drugmakers and insurers, and steady inflows into healthcare funds. A break of those supports, combined with weakening breadth and a shift in options positioning, would be the clearest sign that this midterm-year window is starting to diverge from its six-for-six track record.
Sources
About this seasonal analysis
Seasonal pattern data is sourced from TradeWave.ai, which analyzes historical price behavior across annual calendar windows going back up to 30 years. Read the full data methodology or the book The 100-Year Pattern by Afshin Moshrefi (2026 edition). Past performance of seasonal patterns does not guarantee future results. This article is for informational purposes only and does not constitute investment advice.