S&P 500 SPDR (SPY) Has Rallied in 7 of 7 Aug. 1 Midterm Windows, Averaging 15.07% Gains
S&P 500 SPDR is trading well below its 52-week high as it approaches an Aug. 1 midterm-year seasonal window that has never posted a loss in this dataset.
What is the seasonal pattern for S&P 500 SPDR (SPY)?
S&P 500 SPDR has risen in 7 of 7 midterm election-year windows starting Aug. 1, with an average gain of 15.07% in winning years.
- 7 for 7 in this window, with S&P 500 SPDR averaging 15.07% gains in winning years across the last seven midterm election cycles.
- Percent Profitable is 100%, with 7 winners and 0 losers in this 363-day S&P 500 SPDR trading window.
- The window begins on Aug. 1 and runs for 363 calendar days, spanning the late midterm election year into the following pre-election year.
- Average profit of 15.07% reflects strong upside in this SPY seasonal trend, with individual years ranging from 9.46% to 22.24% gains.
- Intraperiod swings have been meaningful, with some years showing double-digit drawdowns even as the final result finished positive.
- The pattern aligns with the presidential election cycle, capturing the historically strong midterm-to-pre-election regime for the broad U.S. equity market.
According to historical data from TradeWave.ai, this upcoming stretch for S&P 500 SPDR behaves differently from an average year, with a distinct election-cycle flavor that traders often overlook.
How does S&P 500 SPDR (SPY) trade in the Aug. 1 midterm-year window?
The seasonal window beginning Aug. 1 has been quietly powerful for S&P 500 SPDR, with gains in all seven midterm election years in this sample and an average profit of 15.07%. The ETF last closed at 655.83, leaving it about 13.3% below its 52-week high and roughly 8.5% above its 52-week low. That combination of a pullback from the highs and a historically strong midterm-to-pre-election window gives this slice of the calendar unusual weight for investors watching the broad U.S. equity tape.
Grouping the data by the presidential election cycle matters here because this window sits in the heart of the midterm election year and then runs deep into the year before the presidential election, a phase that has often coincided with friendlier policy signals and improving risk appetite. In this framework, the current calendar phase is the midterm election year, while the pattern window captures the last seven midterm cycles, so the upcoming Aug. 1 start date effectively marks the handoff from a choppier midterm backdrop into a historically stronger regime for SPY.
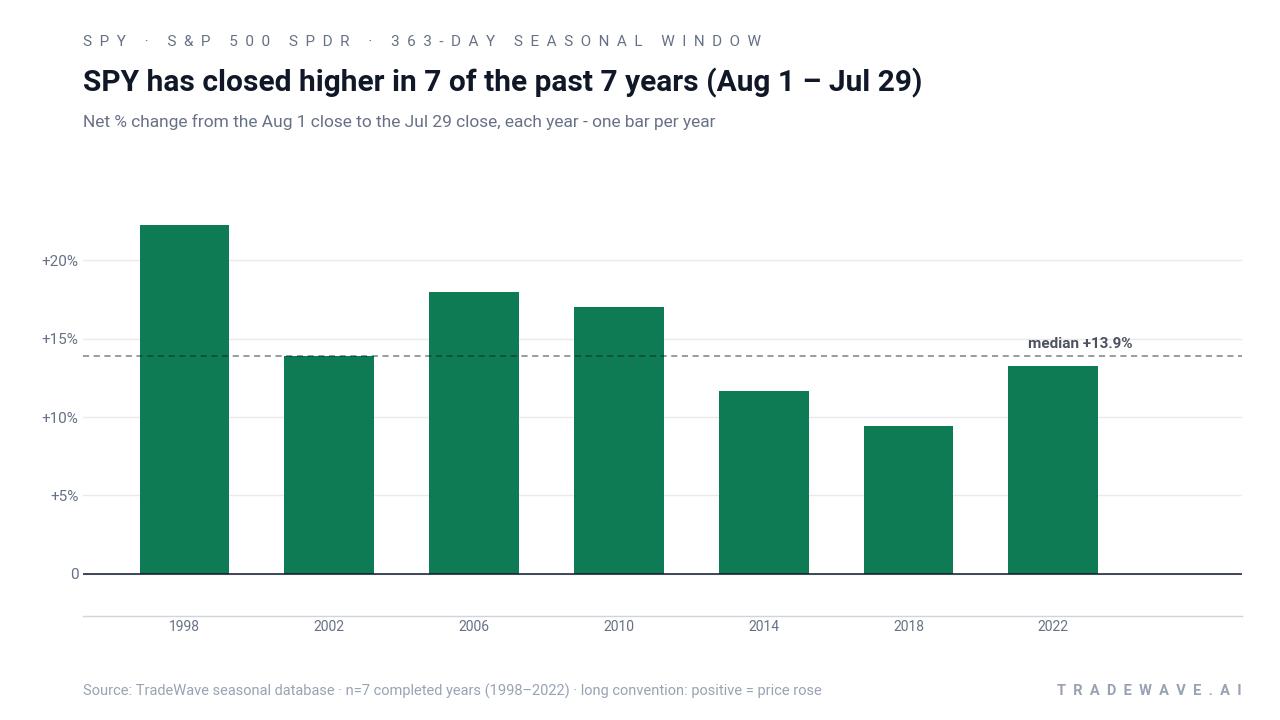
Historically, this 363-day SPY seasonal trend has been a straightforward long setup. Percent Profitable is 100%, with 7 winners and 0 losers, and the average profit of 15.07% shows that the gains have not been marginal. The strongest year in the sample was 1998, when SPY returned 22.24% between entry and exit, while the softest outcome was 2018, which still delivered a 9.46% gain by the end of the window.
The per-year table shows that even the more modest years have stacked double-digit returns, such as 2014 at 11.64% and 2002 at 13.88%. In other words, this is not a pattern built on one outlier; the median profit of 13.88% sits close to the average, which supports the idea of a consistent bullish bias rather than a single lucky run. For a broad-market ETF like S&P 500 SPDR, that kind of repeatable midterm-year seasonal pattern is unusual.
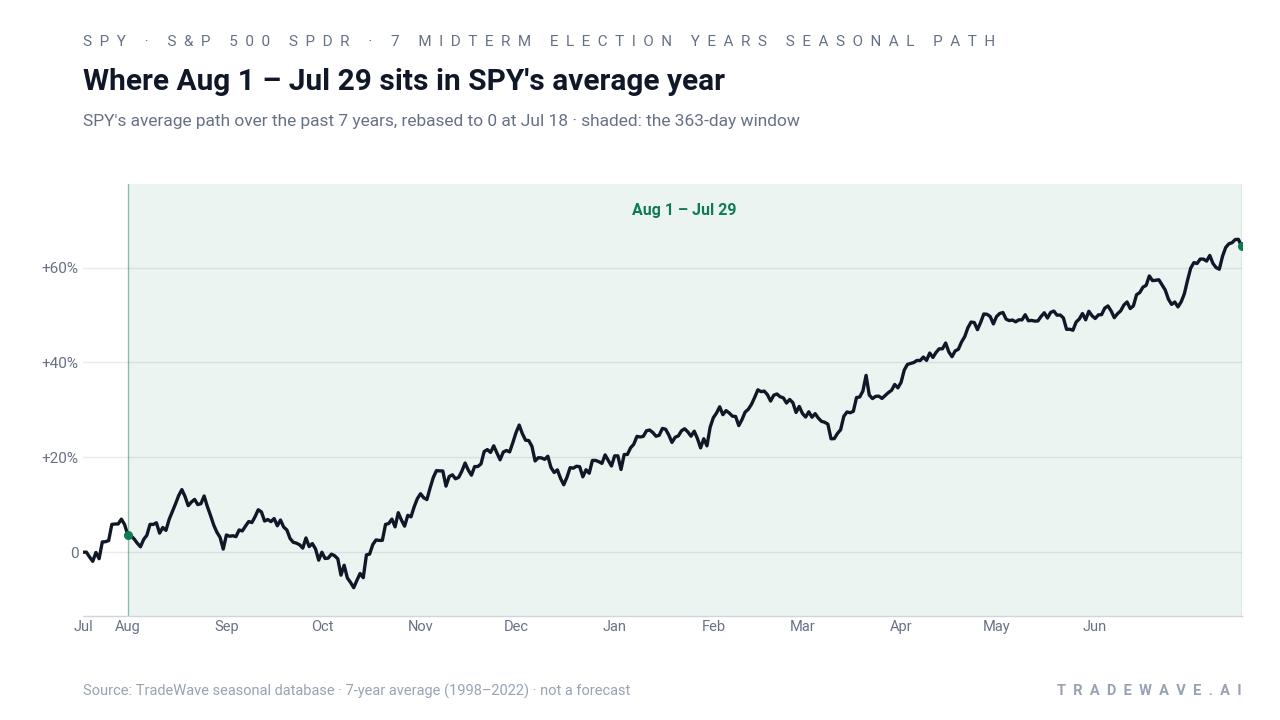
The historical seasonal average trend line slopes higher for most of the window, with relatively steady accrual rather than a single explosive burst. That fits the idea that this regime overlaps the long midterm-to-pre-election pattern often cited as one of the strongest stretches for the S&P 500 across the last century. In this dataset, the trend statistics show 51 days where the pattern favors being long versus 0 days favoring shorts, and a similar 60-to-0 skew in the shorter-term trend view, which reinforces the directional bias.
Yearly net and peak moves highlight how much room SPY has historically had to run in this window, and how deep the temporary setbacks can be along the way.
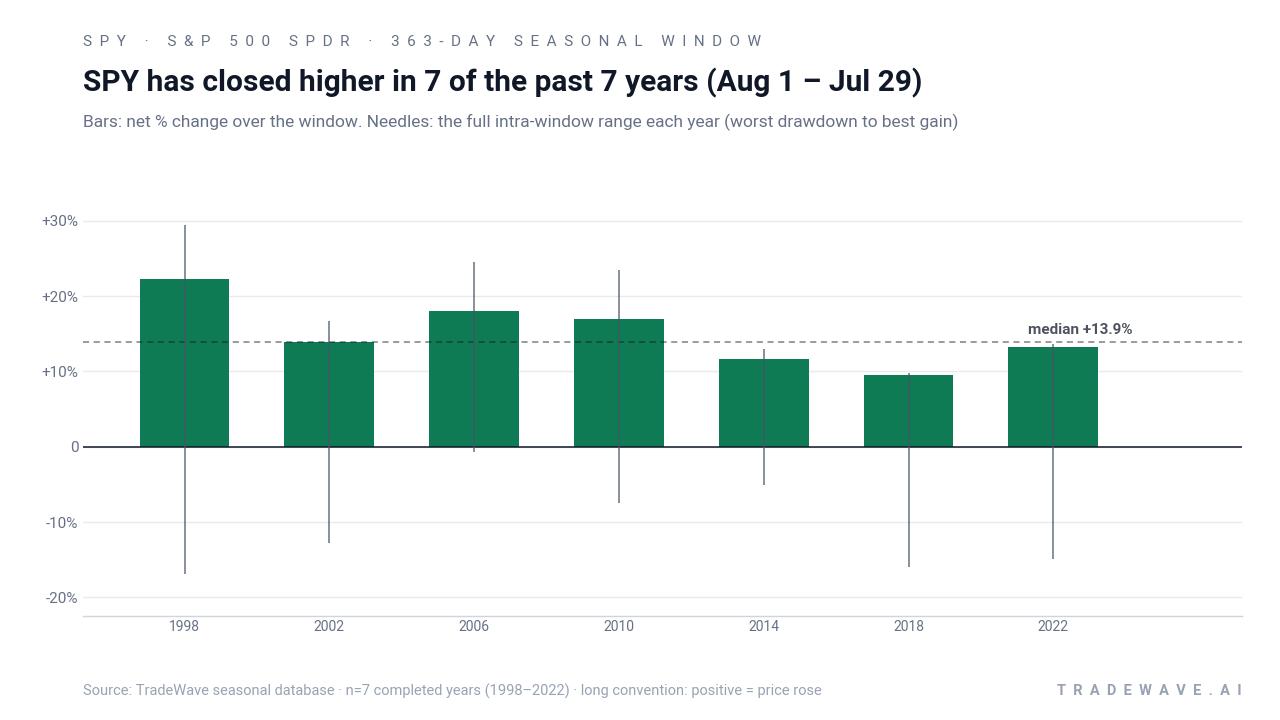
The stacked net, maximum favorable move and maximum adverse move bars show that upside potential and downside risk have both been meaningful. In 1998, for example, SPY’s best intraperiod rally reached 29.37% above the entry level before settling at a 22.24% gain, while the worst drawdown in that same window was a 16.86% drop from entry. Even in 2006, which looks relatively smooth with a 17.97% net gain, the maximum favorable move of 24.5% came with only a shallow 0.74% adverse excursion, highlighting how some cycles have offered cleaner trends than others.
Other years underline the volatility that can lurk inside a winning pattern. In 2018, SPY finished the window up 9.46%, but the worst intraperiod drawdown was a sizable 15.9% from the starting point. The 2022 window tells a similar story, with a 13.27% net gain paired with a 14.91% maximum adverse move. For traders, that mix of strong final outcomes and sizable interim swings means position sizing and risk management matter as much as the headline win rate.
The TradeWave Ratio of 2.03 captures how far price has typically traveled in the trade direction within the window, independent of the final close, and the Sharpe ratio of 2.58 points to a favorable risk-adjusted profile based on end-of-window results. Add it up: seven midterm election-year cycles, seven positive outcomes, and a tendency for SPY to log double-digit gains while enduring occasional double-digit drawdowns along the way.
History does not guarantee future results; adverse excursions can be large even in winning windows, and traders can still lose money if they are forced out during drawdowns.
Why does S&P 500 SPDR (SPY) follow this seasonal pattern?
This pattern may reflect how the policy calendar and institutional positioning evolve from the midterm election year into the year before the presidential election. Analysts often point to a combination of reduced policy uncertainty after midterms, fiscal support and improving earnings breadth as reasons risk appetite tends to rebuild in this phase. Portfolio rebalancing and sector rotation into cyclicals and growth ahead of a new presidential race can amplify that effect in broad vehicles like S&P 500 SPDR.
What is driving S&P 500 SPDR (SPY) today?
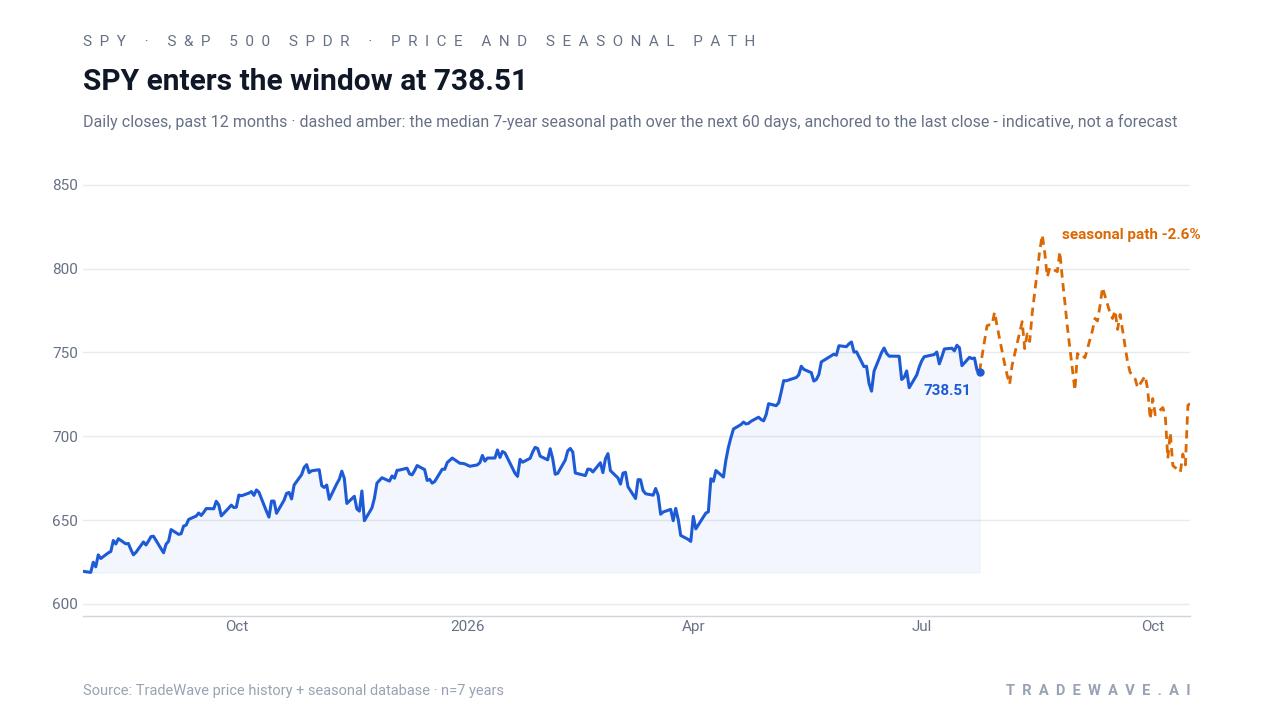
S&P 500 SPDR last changed hands at 655.83, up 0.09% on the day, leaving it about 13.3% below its 52-week high of 756.50 and roughly 8.5% above its 52-week low of 604.40. Over the past month, SPY has gained 1.9%, trading below its 50-day moving average of 736.13 on light macro news and a market that has been digesting earlier gains. The ETF’s 20-day average volume sits at just over 62 million shares, underscoring its role as the primary proxy for U.S. equity risk.
Macro drivers remain familiar. In Aug. 2025, investors were already fixated on the Core PCE Price Index as a key input for Federal Reserve policy, with SPY often used as the cleanest way to express views on inflation and rates.[1] In Apr. 2026, technical commentary again framed SPY’s intraday swings around war-related headlines and early-week recovery rallies, highlighting how geopolitical shocks and policy expectations continue to set the tone for broad equity positioning.[2] Those same themes are likely to shape how traders approach the upcoming seasonal window, especially if volatility around inflation data or geopolitical risk spikes into late summer.
The chart below situates the latest move in its recent multi-month context and overlays a short-term seasonal projection.
What should traders watch as this SPY seasonal window approaches?
First, the calendar. The Aug. 1 start date is less than a month away, and the 363-day span means this is not a quick trade but a full-cycle regime that runs through much of the year before the presidential election. How SPY behaves into that date, especially relative to its 50-day moving average and the 52-week band, will shape how much “room” traders feel they have to lean into the historical seasonality.
Second, the policy and data calendar. Core PCE inflation, Fed meeting rhetoric and any shift in rate-cut expectations will likely dictate whether the market leans into or fades the historical midterm-to-pre-election strength.[1] A backdrop of easing inflation and stable policy could rhyme with prior strong years in the pattern, while renewed inflation worries or aggressive tightening talk would be a clear test of the historical script.
Third, volatility around geopolitical headlines. In Apr. 2026, war-related news was enough to jolt SPY intraday and then fuel recovery rallies, a reminder that macro shocks can override even robust seasonal tendencies in the short run.[2] If similar headlines hit during the upcoming window, traders will want to watch whether SPY’s drawdowns resemble the deeper adverse moves seen in years like 1998, 2018 or 2022, or whether pullbacks stay shallower.
Finally, behavior inside the window itself will be the real test of this stock pattern analysis. If SPY spends the first few months of the window grinding higher with contained pullbacks, it would be consistent with the historical seasonal trend. A sharp break lower that fails to recover, by contrast, would mark the first true failure in this seven-cycle sample and signal that macro forces have overwhelmed the usual midterm election-year seasonal tailwind.
Sources
About this seasonal analysis
Seasonal pattern data is sourced from TradeWave.ai, which analyzes historical price behavior across annual calendar windows going back up to 30 years. Read the full data methodology or the book The 100-Year Pattern by Afshin Moshrefi (2026 edition). Past performance of seasonal patterns does not guarantee future results. This article is for informational purposes only and does not constitute investment advice.