Nasdaq QQQ Invesco ETF (QQQ) Has Rallied in 6 of 6 Midterm Windows, Averaging 23.49% Gains
Nasdaq QQQ Invesco ETF is heading toward a historically powerful midterm-year seasonal window, even as tech leadership and macro policy debates keep volatility elevated.

What is the seasonal pattern for Nasdaq QQQ Invesco ETF (QQQ)?
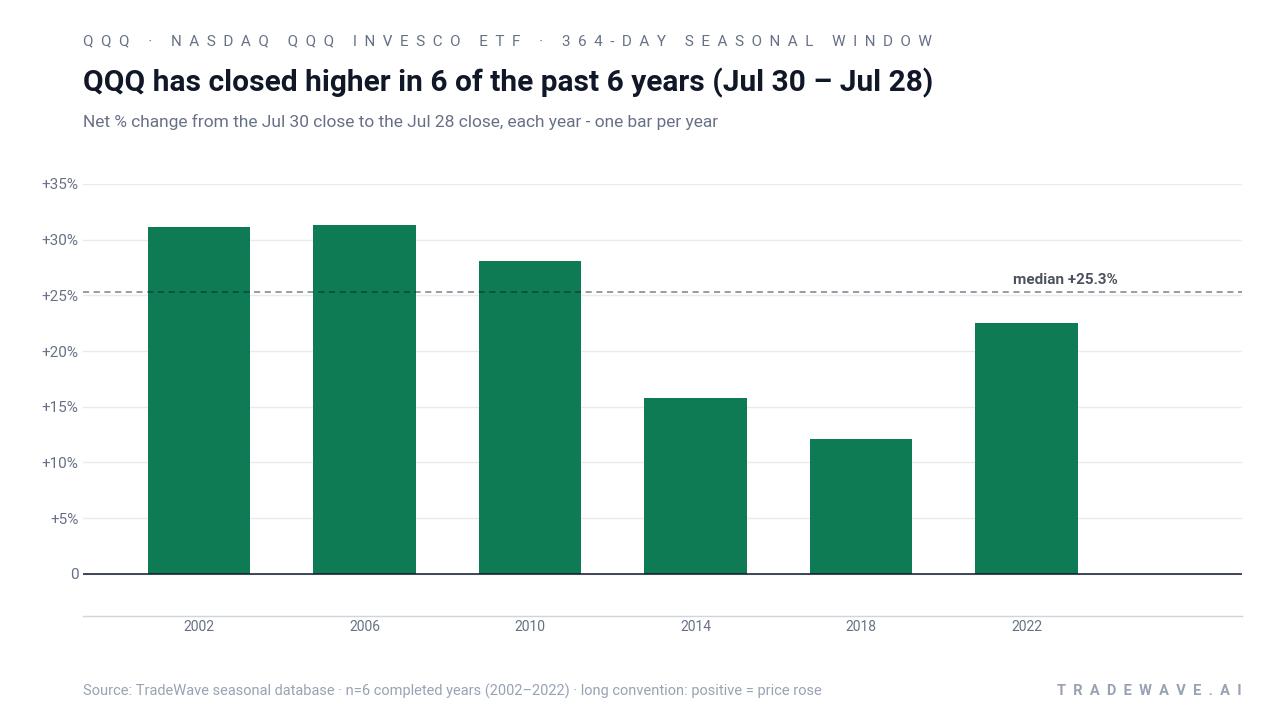
Nasdaq QQQ Invesco ETF has risen in 6 of 6 midterm election-year windows like this one, with an average gain of 23.49% in winning years.
- 6 for 6 in this window, with winning years averaging 23.49% gains across the last six midterm election years.
- The upcoming window starts Jul 30, 2026 and runs for 364 calendar days, covering the heart of the midterm election year into the following summer.
- Percent Profitable is 100%, with 6 winners and 0 losers across the historical sample.
- Cumulative return across those six midterm-year windows totals 250%, with a 23.26% annualized profile and a Sharpe ratio of 2.4.
- The TradeWave Ratio of 2.36 signals that QQQ typically travels meaningfully in the long direction during this stretch, even as intraperiod drawdowns can be sharp.
- Individual years have seen adverse moves as deep as roughly 19% from entry before finishing higher, underscoring that this bullish seasonal edge has come with real volatility.
According to historical data from TradeWave.ai, this midterm election-year stretch for QQQ has behaved very differently from an average calendar year, and the next iteration begins later this month.
How strong is the upcoming seasonal window for Nasdaq QQQ Invesco ETF (QQQ)?
Nasdaq QQQ Invesco ETF has posted gains in every one of the last six midterm election-year windows like the one that starts on Jul 30, 2026, averaging 23.49% per cycle. With QQQ trading between its 52-week low near 540.89 and high around 747.00, the ETF is heading into this historically bullish stretch from an already elevated base that reflects years of tech-led outperformance.
The presidential election cycle matters here because this pattern only looks at midterm election years, a phase that often brings policy uncertainty, tighter financial conditions and choppy tape before risk appetite rebuilds into the pre-election year. Grouping QQQ’s behavior by this cycle isolates how large-cap growth and tech leadership have tended to trade when Washington is focused on mid-cycle fiscal debates rather than fresh campaign promises.
In this specific midterm-year window, the trade direction is long, and every historical instance has finished higher. Percent Profitable sits at 100%, with 6 winners and 0 losers, which is rare for a window that spans nearly a full trading year. Average profit in those winning years is 23.49%, while the cumulative gain across all six cycles is 250%, translating to a 23.26% annualized return profile.
The individual years show how that upside has played out. In 2002, QQQ returned 31.18% in this window, while 2006 delivered a similar 31.28% gain. The weakest of the six, 2018, still finished up 12.11%, and the most recent midterm year in 2022 produced a 22.5% advance from entry to exit. Add it up and the pattern has not yet produced a losing midterm-year stretch for long exposure.
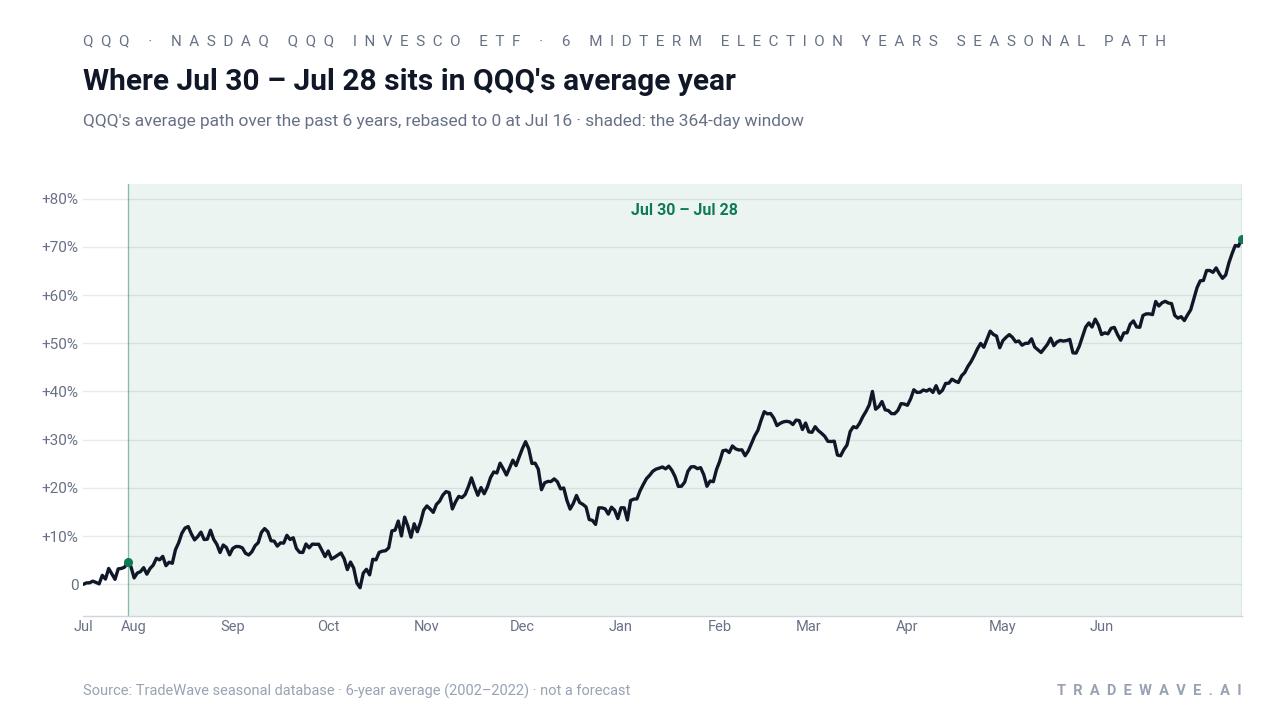
The historical seasonal average trend suggests that QQQ’s gains in this window tend to build steadily rather than in a single burst. Trend statistics show 28 long-biased segments versus 4 short segments across the pattern, and an even stronger 42-to-1 skew when looking at shorter trend slices, which points to persistent upside pressure with only brief countertrend phases.
Yearly net and peak moves highlight upside persistence amid typical drawdowns.
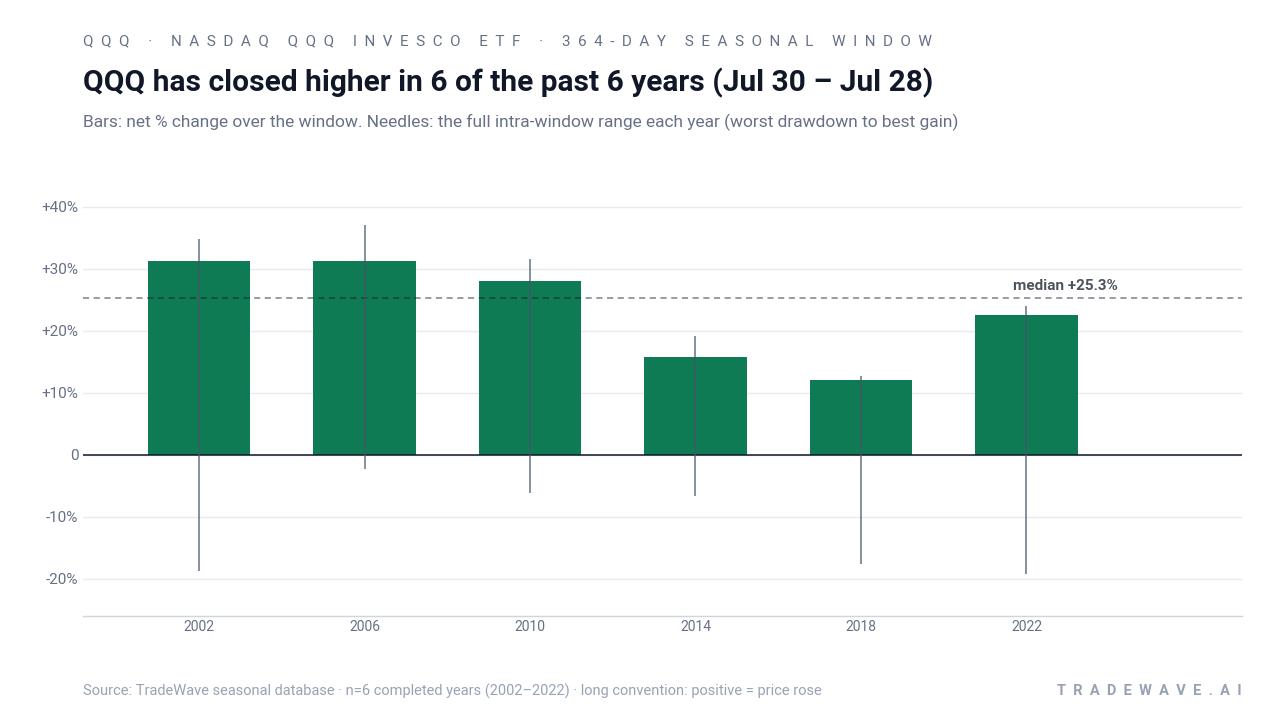
The bar chart that combines net returns with maximum favorable and adverse excursions shows why this window has felt powerful but never easy. Maximum favorable moves have ranged from roughly 12.65% to 36.99%, while maximum adverse moves have stretched as deep as about 19.21% below entry in some years before the ETF recovered. That mix of large positive excursions and sizable drawdowns fits a high-conviction long pattern where bulls have ultimately won, but only after sitting through real volatility.
History does not guarantee future results; adverse excursions (MAE) can be large even in winning windows.
Why does Nasdaq QQQ Invesco ETF (QQQ) follow this seasonal pattern?
This midterm-year seasonal pattern for QQQ may reflect how tech-heavy growth leadership reacts to the policy and liquidity backdrop around the middle of the presidential cycle. One likely driver is that midterm years often see front-loaded volatility and tighter conditions early on, followed by a friendlier policy and liquidity stance as the market looks ahead to the pre-election year, when risk assets have historically done well. Institutional portfolio rebalancing, index weight shifts in mega-cap tech and the clustering of big-cap earnings and product cycles in the back half of the year may also reinforce this tendency for QQQ to trend higher across this long window.
What is driving Nasdaq QQQ Invesco ETF (QQQ) today?
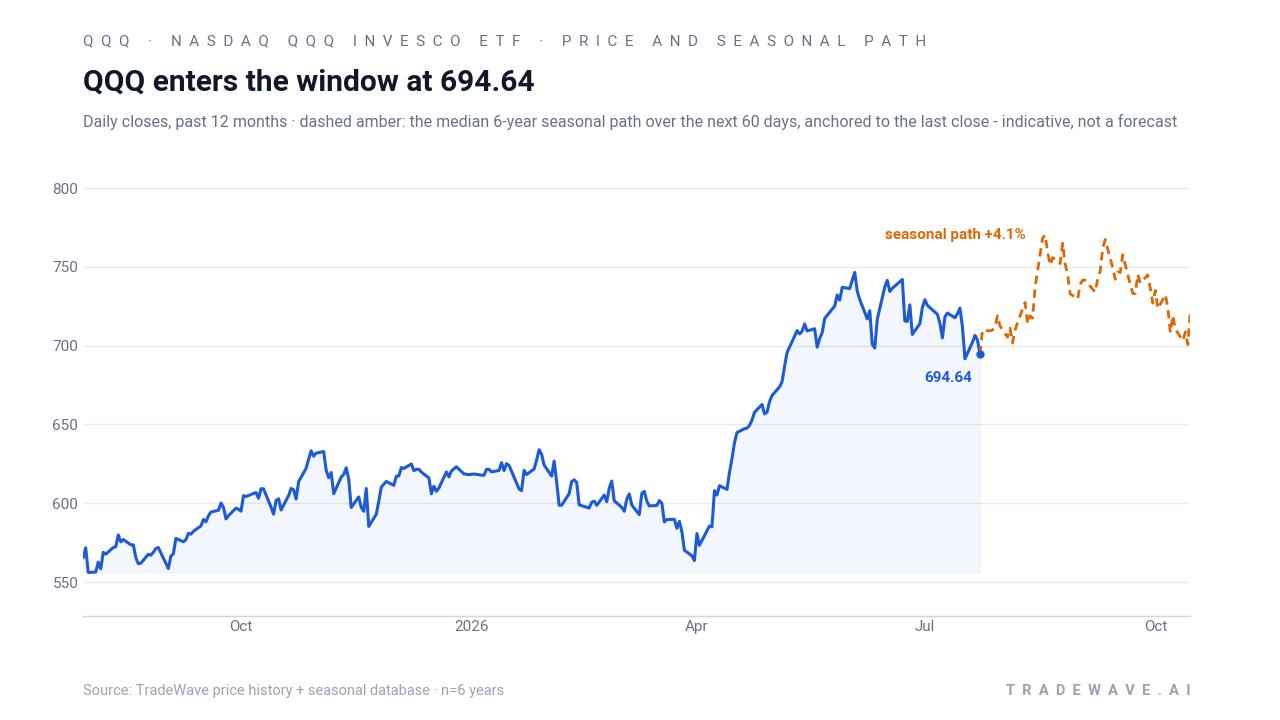
QQQ continues to trade as the liquid proxy for large-cap U.S. growth and tech, with intraday levels widely displayed across market dashboards and news tickers even when there is no ETF-specific headline catalyst. The ETF sits between its 52-week low near 540.89 and high around 747.00, a range that reflects both the strong run in mega-cap technology and the pullbacks that have come with shifting expectations for interest rates and earnings.
The chart below situates the latest move in its recent multi-month context and overlays a short-term seasonal projection.
MarketBeat and other outlets continue to feature QQQ quotes prominently in navigation bars and instant alert pages, underscoring its role as a real-time barometer for U.S. equity risk appetite rather than a vehicle driven by idiosyncratic news. That broad usage means flows into and out of QQQ often reflect macro positioning on rates, inflation and earnings breadth across the Nasdaq ecosystem rather than single-stock stories.
Sources
About this seasonal analysis
Seasonal pattern data is sourced from TradeWave.ai, which analyzes historical price behavior across annual calendar windows going back up to 30 years. Read the full data methodology or the book The 100-Year Pattern by Afshin Moshrefi (2026 edition). Past performance of seasonal patterns does not guarantee future results. This article is for informational purposes only and does not constitute investment advice.