7-for-7 Midterm Record: S&P 500 SPDR (SPY) Nears 364-Day Window Averaging 17.59% Gains
S&P 500 SPDR is nearing a 364-day midterm-election seasonal window that has never produced a loss in the last seven cycles, just as traders weigh inflation data and policy risk into 2027.

What is the seasonal pattern for S&P 500 SPDR (SPY)?
S&P 500 SPDR has risen in 7 of 7 midterm-election-year windows starting around Jul 19, with an average gain of 17.59% in winning years.
- 7 for 7 in this window, with S&P 500 SPDR averaging 17.59% gains across all winning years.
- The upcoming 364-day trading window begins on Jul 19, 2026 and covers the last 7 midterm election years.
- Percent Profitable is 100%, with 7 winners and 0 losers in the historical sample.
- Average winner profit of 17.59% comes with a Sharpe ratio of 2.08, indicating strong risk-adjusted returns.
- The TradeWave Ratio of 2.02 suggests price has typically traveled meaningfully in the long direction within the window.
- Individual years have still seen sizable drawdowns inside the window, with adverse moves as deep as roughly 21.94% before finishing higher.
According to historical data from TradeWave.ai, this midterm-election-year stretch has behaved very differently from an average calendar year for SPY. The next section looks at how that pattern has played out across the last seven comparable cycles.
How has S&P 500 SPDR (SPY) traded in this midterm-year window?
S&P 500 SPDR has posted gains in every one of the last seven midterm-election-year windows starting around Jul 19, averaging 17.59% returns over each 364-day stretch. With the ETF recently pulling back about 2.9% over the past month, traders are weighing whether this historically powerful seasonal regime can reassert itself as the current midterm year transitions toward the pre-election year.[1]
Grouping by the presidential election cycle matters here because this window runs from the heart of the midterm election year into the pre-election year, a phase that has often coincided with shifting fiscal priorities and changing expectations for regulation and spending. In prior cycles, that policy backdrop has lined up with a clear bullish SPY seasonal trend in this specific stretch.
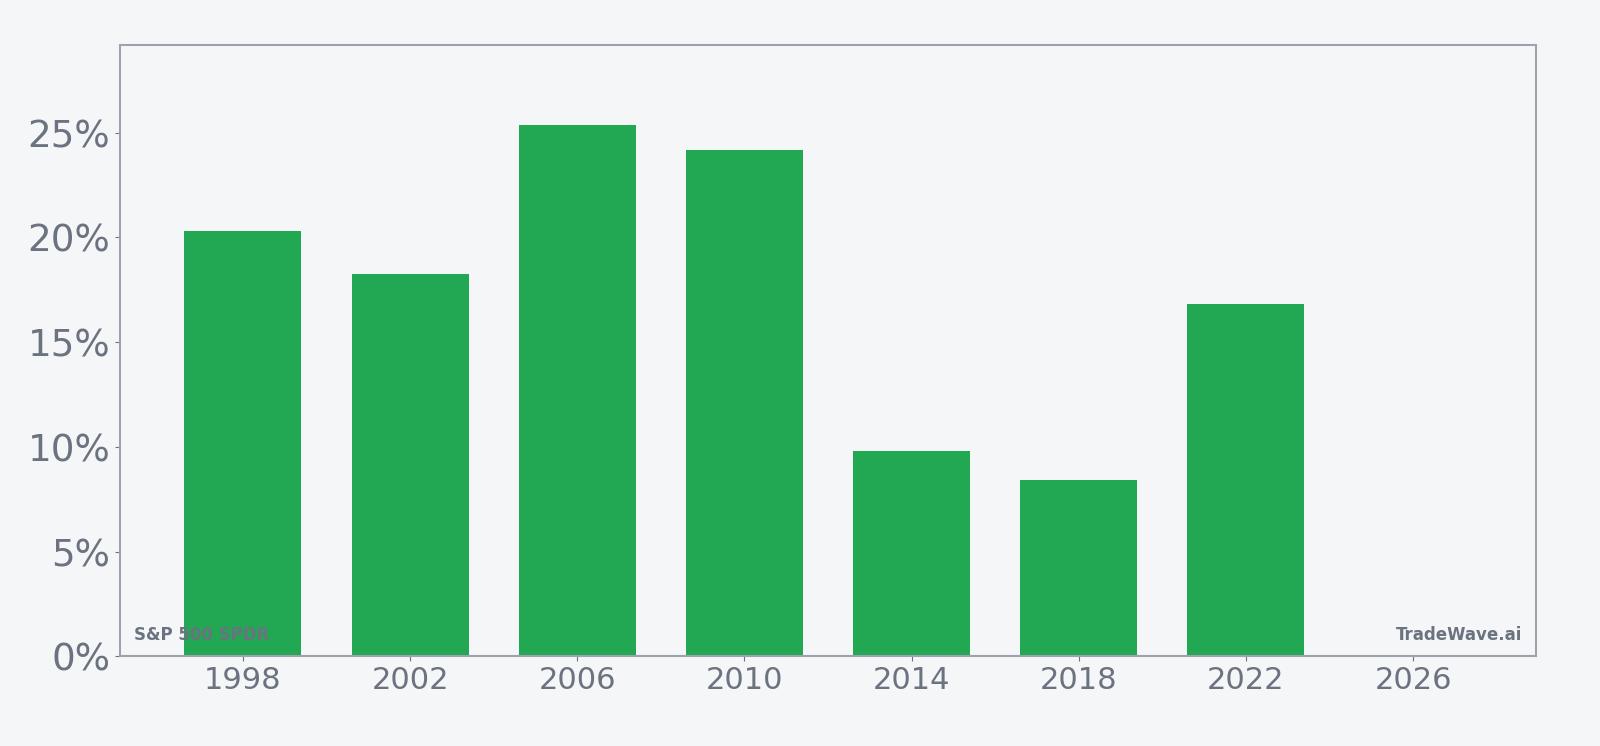
Across the seven midterm-election-year samples since 1998, the trade direction for this pattern is long, and every instance finished higher over the 364-day window. Average profit of 17.59% sits close to the median outcome of 18.27%, which tells you the gains have been relatively consistent rather than driven by a single outlier year. The cumulative return across all seven windows totals 208%, with an annualized return of 17.44% for this pattern.
The strongest year in the sample was 2006, when SPY gained 25.38% from entry to exit, with a maximum favorable move of 26.01% and only a shallow 1.49% worst drawdown inside the window. The softest outcome was 2018, which still delivered an 8.44% net gain but saw an intraperiod adverse move of 15.65% before recovering into the close of the window. That mix captures the core message of this SPY seasonal trend: the direction has been reliably higher, but the path has not always been smooth.
The maximum favorable excursions have generally tracked close to the final net returns, especially in years like 2014 and 2022 where the best run-up of 9.93% and 17.09% respectively was only slightly above the final gains. On the downside, the worst intraperiod drawdowns have ranged from a mild 1.49% in 2006 to a deep 21.94% in 1998, when SPY still finished the window up 20.29%. That profile fits a long pattern where pullbacks have often been buyable within the window, but the size of those pullbacks has varied sharply by cycle.
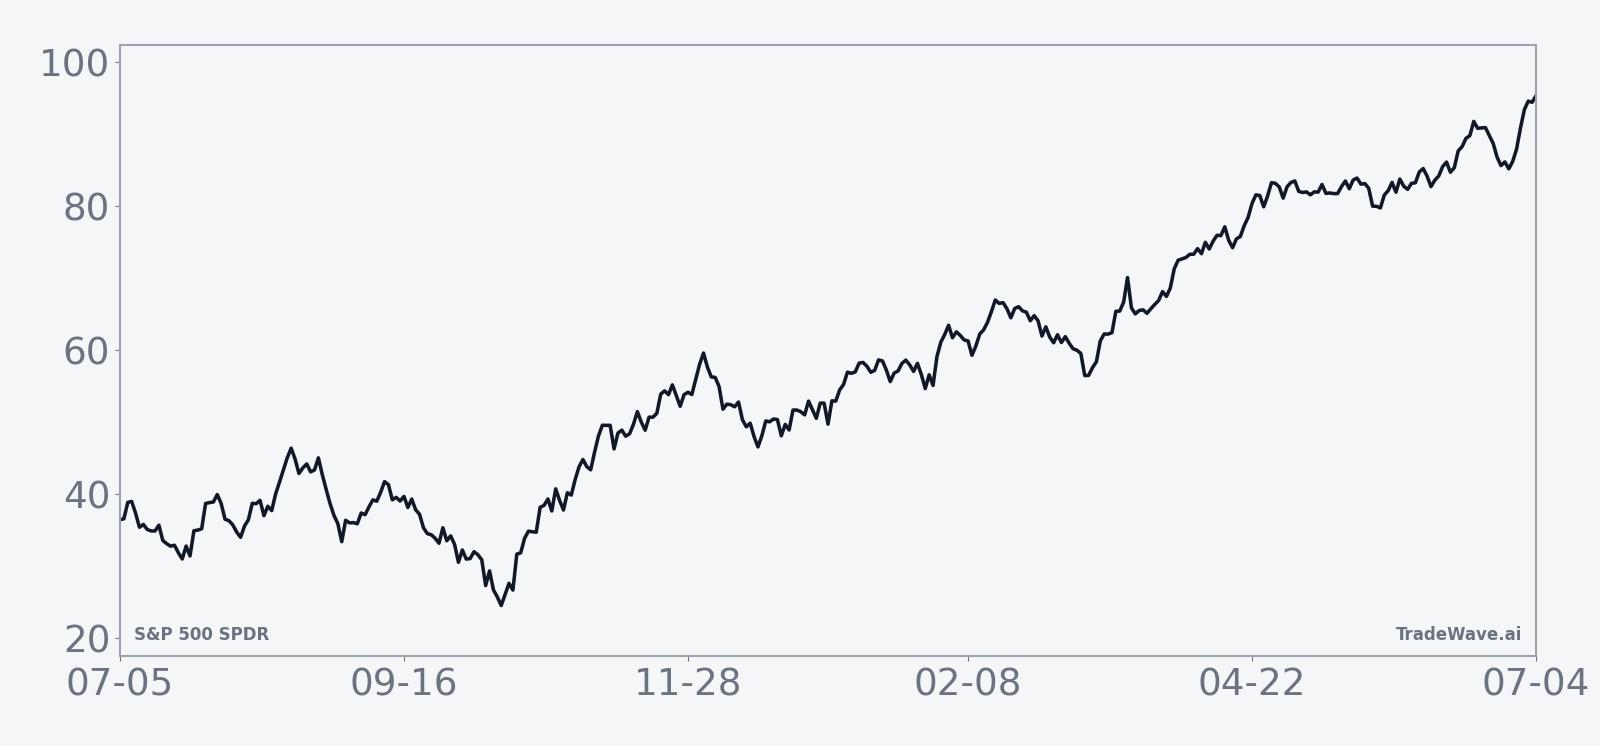
The historical seasonal average trend line slopes steadily higher across most of the 364-day span, with only modest choppiness early in the window and a tendency for gains to compound into the pre-election year. That shape is consistent with the broader “midterm-to-pre-election” regime that many long-horizon investors watch as one of the strongest stretches in the four-year cycle.
Year-by-year bars with intraperiod swings show how much room SPY has historically given traders inside this bullish window.
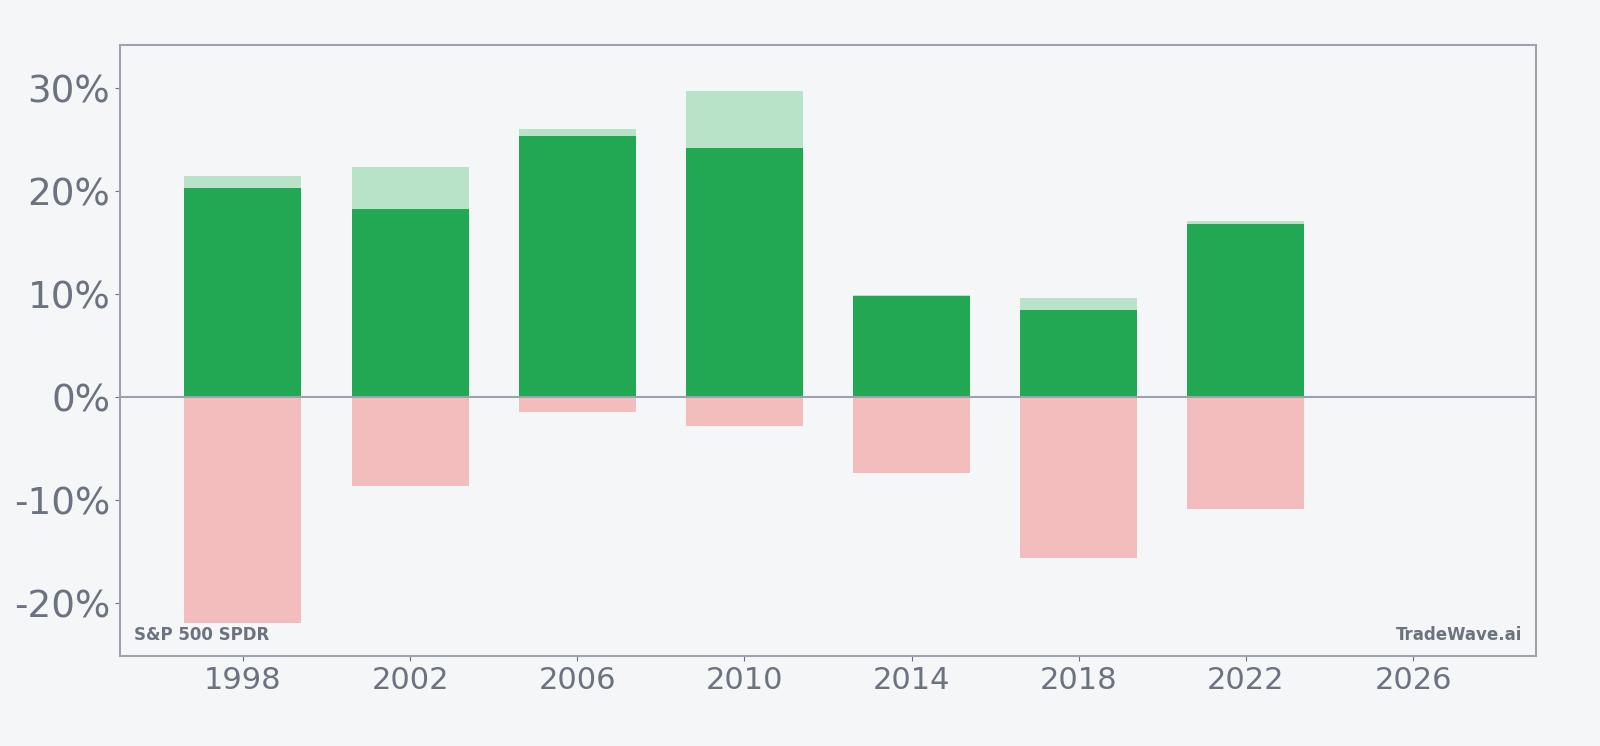
Those bars highlight a key nuance: even in a 7-for-7 winning pattern, maximum adverse moves have sometimes been large, particularly in 1998 and 2018, while maximum favorable moves have tended to cluster near the final net gains. For traders, that means the window has historically rewarded long exposure but has also demanded tolerance for double-digit drawdowns in some cycles.
History does not guarantee future results; adverse excursions can be large even in winning windows, and past midterm-year behavior may not repeat in the next cycle.
Why does S&P 500 SPDR (SPY) follow this seasonal pattern?
One likely driver is the way the policy calendar and earnings cycle line up between the midterm election year and the pre-election year. Analysts have pointed to a mix of post-midterm fiscal clarity, reduced legislative uncertainty and renewed risk appetite as investors look ahead to the next presidential race. This pattern may also reflect institutional portfolio repositioning after midterm volatility, with flows gradually tilting back toward equities as macro visibility improves.
What is driving S&P 500 SPDR (SPY) today?
SPY has slipped about 2.9% over the past month, a modest consolidation after a strong multi-quarter run that has left the ETF still closer to its 52-week high than its low.[1] The pullback comes as investors focus on inflation data, particularly the Core PCE price index, which remains a key input for the Federal Reserve’s path on rates and, by extension, equity valuations.[1]
The chart below situates the latest move in its recent multi-month context alongside a 60-day seasonal projection.
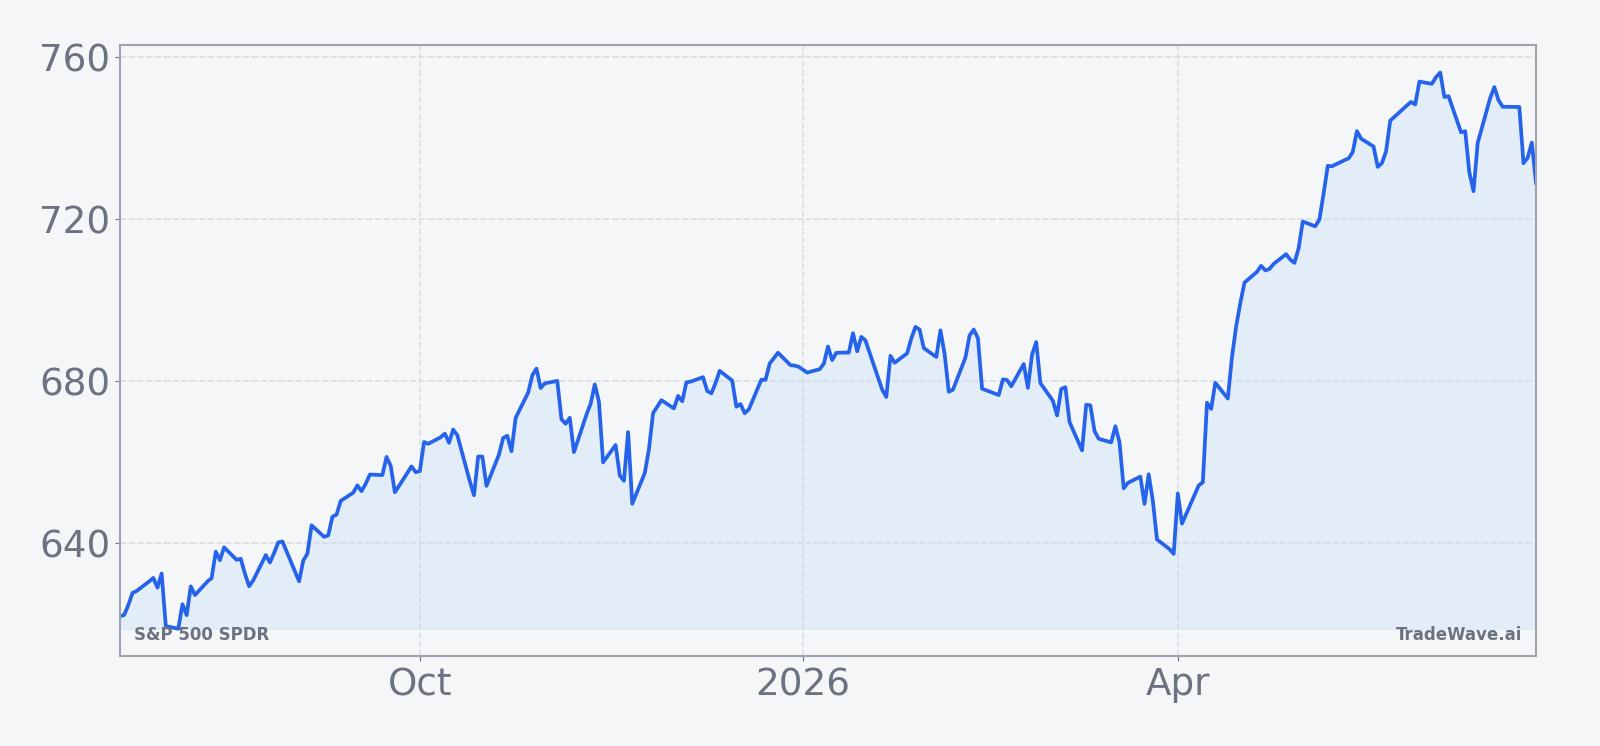
Macro-wise, the market’s attention remains locked on whether inflation can drift closer to the Fed’s target without a sharp growth slowdown, a balance that would support the kind of steady multiple expansion seen in prior midterm-to-pre-election windows.[1] For SPY, that means each PCE print and Fed communication into late summer will help determine whether the ETF enters the Jul 19 seasonal window from a position of strength or under renewed pressure.
What should traders watch as this SPY seasonal window approaches?
First, watch how SPY behaves into the Jul 19 start date: a continued shallow pullback would be consistent with prior cycles that saw early-window volatility before longer uptrends, while a sharp break lower would test the durability of the historical pattern. Second, keep an eye on the size of intraperiod swings once the window opens, since past midterm-year cycles have included adverse moves as deep as roughly 21.94% even in ultimately positive years. Third, track the macro calendar, especially Core PCE releases and Fed meetings, because a shift in the inflation or policy narrative could either reinforce or overwhelm the usual midterm-to-pre-election seasonal tailwind for SPY.[1]
Sources
About this seasonal analysis
Seasonal pattern data is sourced from TradeWave.ai, which analyzes historical price behavior across annual calendar windows going back up to 30 years. Read the full data methodology or the book The 100-Year Pattern by Afshin Moshrefi (2026 edition). Past performance of seasonal patterns does not guarantee future results. This article is for informational purposes only and does not constitute investment advice.