S&P 500 Healthcare Sector SPDR (XLV) Has Rallied in All 6 Midterm Windows, Averaging 9.18% Gains
S&P 500 Healthcare Sector SPDR is heading toward a 155-day midterm-year seasonal window that has never been negative in the last six cycles, just as healthcare leadership and options activity pick up.

What is the seasonal pattern for S&P 500 Healthcare Sector SPDR (XLV)?
S&P 500 Healthcare Sector SPDR has risen in 6 of 6 midterm-year windows during this 155-day stretch, with an average gain of 9.18% in winning years.
- 6 for 6 in this window, with XLV posting gains every time and averaging 9.18% in winning years.
- Seasonal window begins Jul 11 and runs 155 calendar days, covering the heart of the midterm election year.
- Percent Profitable is 100%, with 6 winners and 0 losers across the last six midterm election years.
- Trade Direction is long, supported by a Sharpe ratio of 3.88 and a TradeWave Ratio of 3.09, signaling strong risk-adjusted and intraperiod upside.
- Individual years have seen maximum favorable moves as high as 16.44%, but adverse swings inside the window have reached as much as -11.92% before recovering.
- Cumulative return across all six windows totals 69%, pointing to a historically persistent XLV seasonal trend in midterm years.
According to historical data from TradeWave.ai, this midterm-year stretch for XLV has behaved very differently from an average calendar period, with a clear directional bias that traders rarely see discussed.
How has S&P 500 Healthcare Sector SPDR (XLV) traded in this midterm-year window?
S&P 500 Healthcare Sector SPDR has risen in all six midterm election years during this 155-day window, averaging 9.18% gains and delivering a 69% cumulative return across those cycles. The next iteration of this seasonal window begins on Jul 11 and runs deep into the back half of the year, overlapping the typical transition from midterm election year volatility into the historically stronger pre-election backdrop. That combination of a clean win streak, double-digit-type average gains in some years, and a long regime length makes this one of the more notable healthcare seasonal patterns on the calendar.
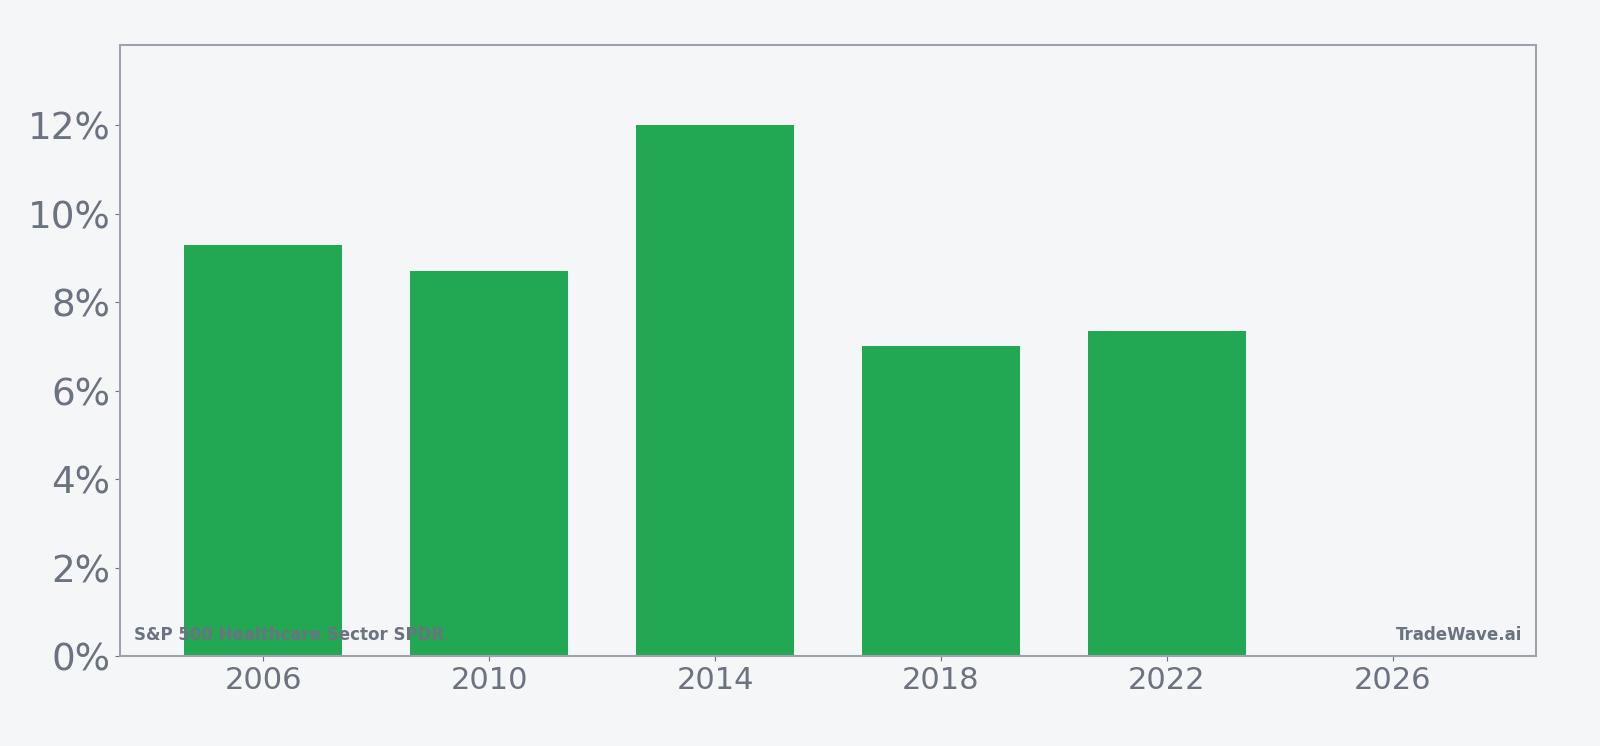
Grouping the data by the presidential election cycle matters here because healthcare policy, reimbursement expectations, and regulation tend to move with Washington’s calendar. Midterm election years often bring legislative noise and sector rotation early in the year, followed by a clearer policy path and more stable risk appetite as markets look ahead to the pre-election year. This XLV seasonal trend is built specifically on that midterm-year backdrop, not on a simple run of consecutive calendar years.
The trade direction for this pattern is long, and the track record is unusually clean: 100% Percent Profitable with 6 winners and 0 losers. Average profit across all six windows is 9.18%, with a median outcome of 9.0%, which means the typical midterm-year run has been a mid‑single to low‑double‑digit gain rather than a one-off outlier. The strongest year in the sample was 2014, when XLV gained 12.02% in the window, while the softest was 2018 with a still-positive 7.01% advance.
Intraperiod swings have been meaningful. In 2002, XLV’s best point-to-peak move inside the window reached 16.44% before settling back to a 10.72% net gain, while the worst drawdown from entry in that same year hit -11.92%. By contrast, 2018 saw a maximum favorable move of 11.77% with almost no adverse excursion, as the worst intraperiod move was a shallow 0.27% dip. That mix shows that even in a strong seasonal window, the path can range from smooth trends to sharp shakeouts before the final gain is locked in.
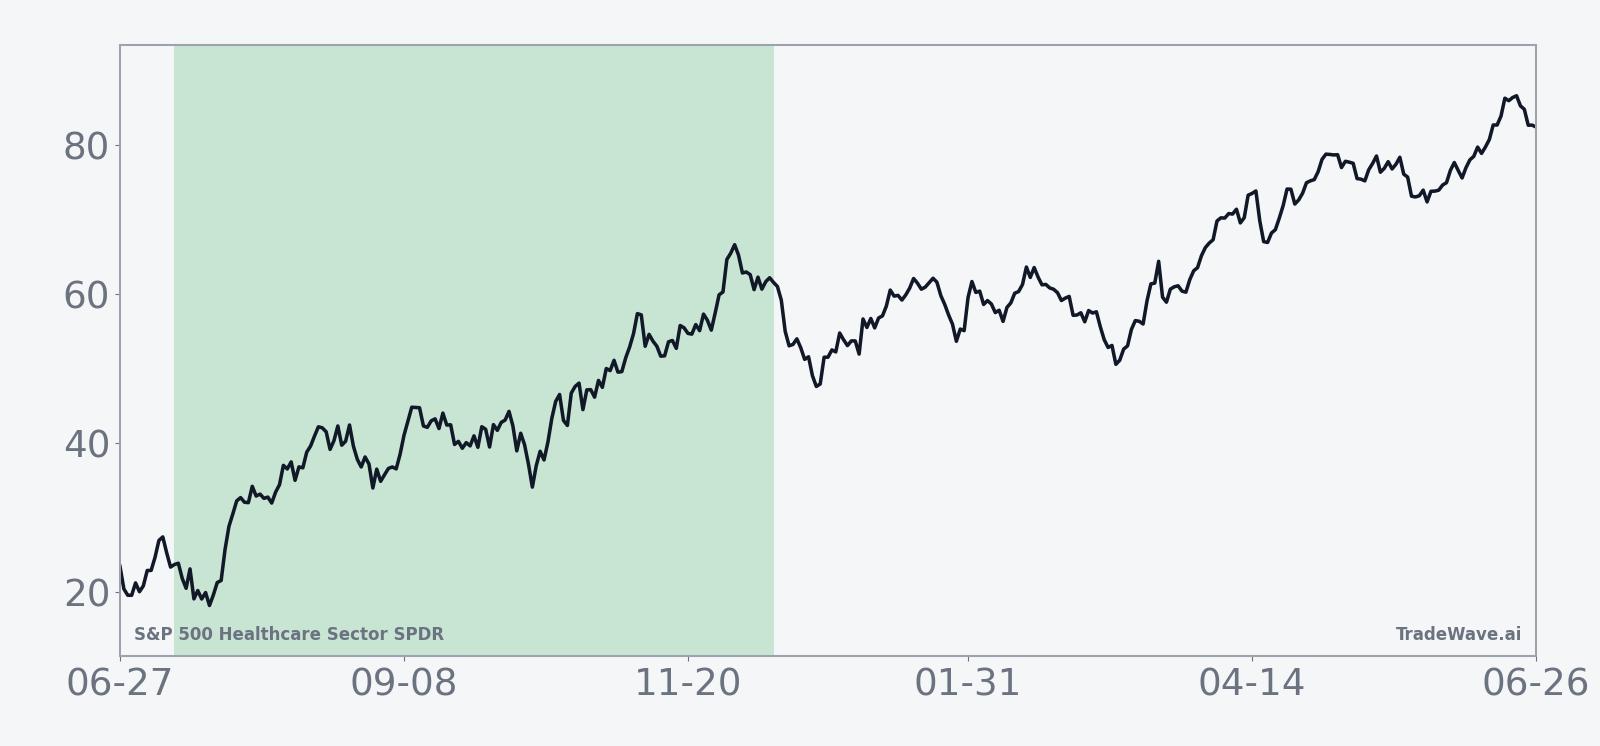
The historical seasonal trend chart for this window slopes higher for most of the 155 days, with the bulk of the average gain accruing steadily rather than in a single burst. The early part of the window tends to see a modest lift, followed by a more persistent grind higher as the calendar moves closer to year-end and the market transitions from midterm uncertainty toward the pre-election year’s typically friendlier risk tone.
Year-by-year bars with intraperiod swings show how much XLV has typically moved in both directions before finishing higher.
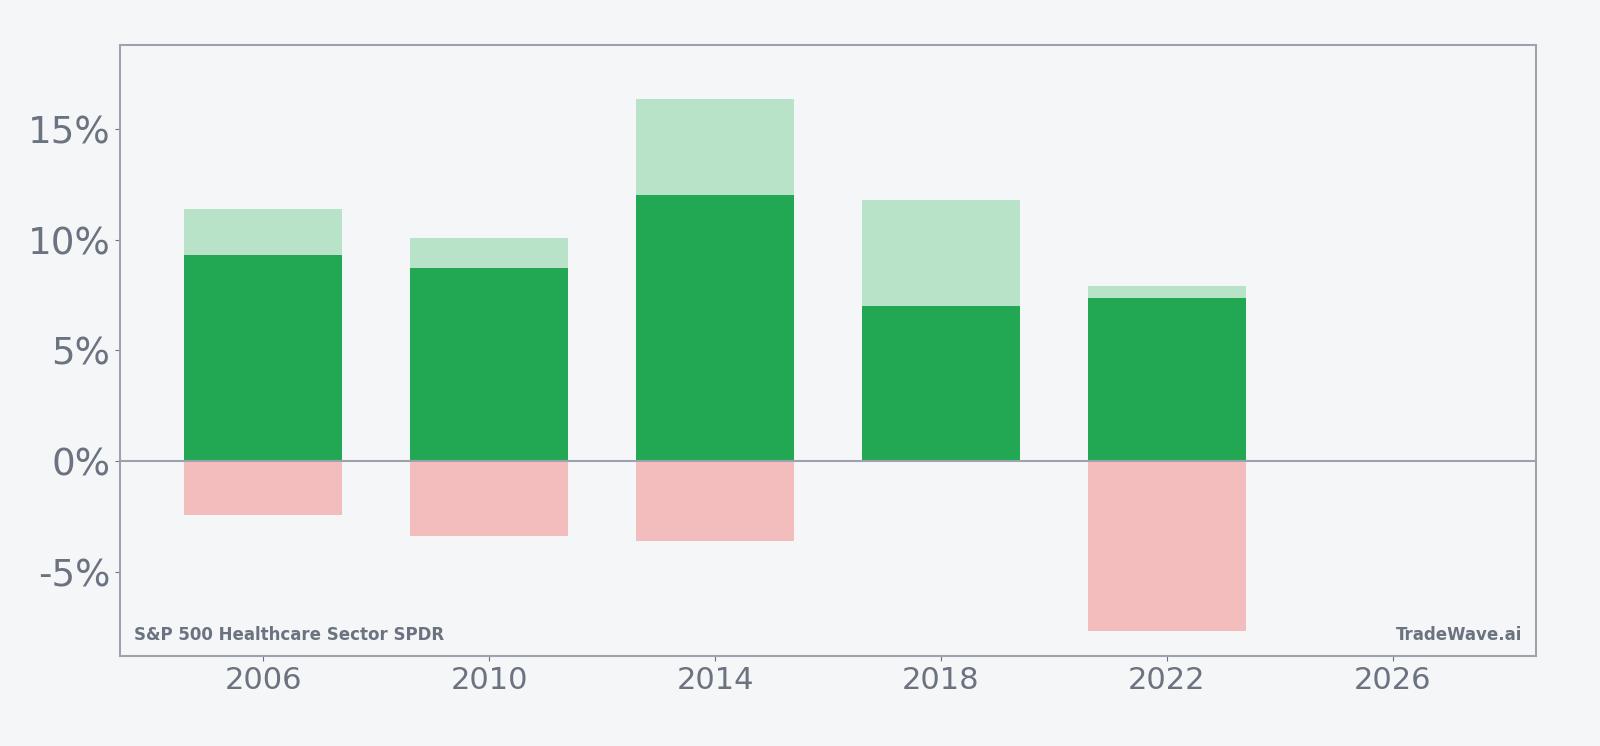
The stacked net, best-case, and worst-case bars underline that this has been a high-conviction long window historically, but not a low-volatility one. Years like 2002 and 2022 combined solid net gains with sizable adverse excursions, while 2014 and 2018 delivered cleaner trends with smaller setbacks. For traders, the message is simple: the XLV seasonal outlook in midterm years has leaned bullish, yet the ride has often included double‑digit swings in both directions.
History does not guarantee future results; adverse excursions can be large even in winning windows, and seasonal tendencies can break when macro or policy conditions change.
Why does S&P 500 Healthcare Sector SPDR (XLV) follow this seasonal pattern?
One likely driver is the way healthcare policy and reimbursement debates cluster around the midterm election year, which can depress sentiment early and then clear the air as legislative risk becomes better defined. Institutional investors also tend to rebalance toward defensive growth sectors like healthcare as the cycle matures, especially when earnings visibility improves into the pre-election year. This XLV seasonal pattern may reflect that combination of policy clarity and late‑cycle sector rotation rather than any single recurring headline.
What is driving S&P 500 Healthcare Sector SPDR (XLV) today?
XLV has been trading in a firm uptrend after forming a bottom in late September and staging roughly a 25% advance from its August low, a move that pushed the ETF back into a multi‑year uptrend and toward overbought territory on weekly charts.[1] The healthcare sector has been a top performer over one- and three-month horizons, with XLV often leading gains during broader market rallies as investors rotate toward defensive growth exposure.[1] Options flow has echoed that shift, with one notable session showing about 5,300 calls traded versus roughly 1,000 puts and an estimated $13 million in notional volume, of which around $11 million was tied to calls, signaling aggressive upside positioning in the ETF.[1]
The chart below situates the latest move in its recent multi-month context alongside a short-term seasonal projection.
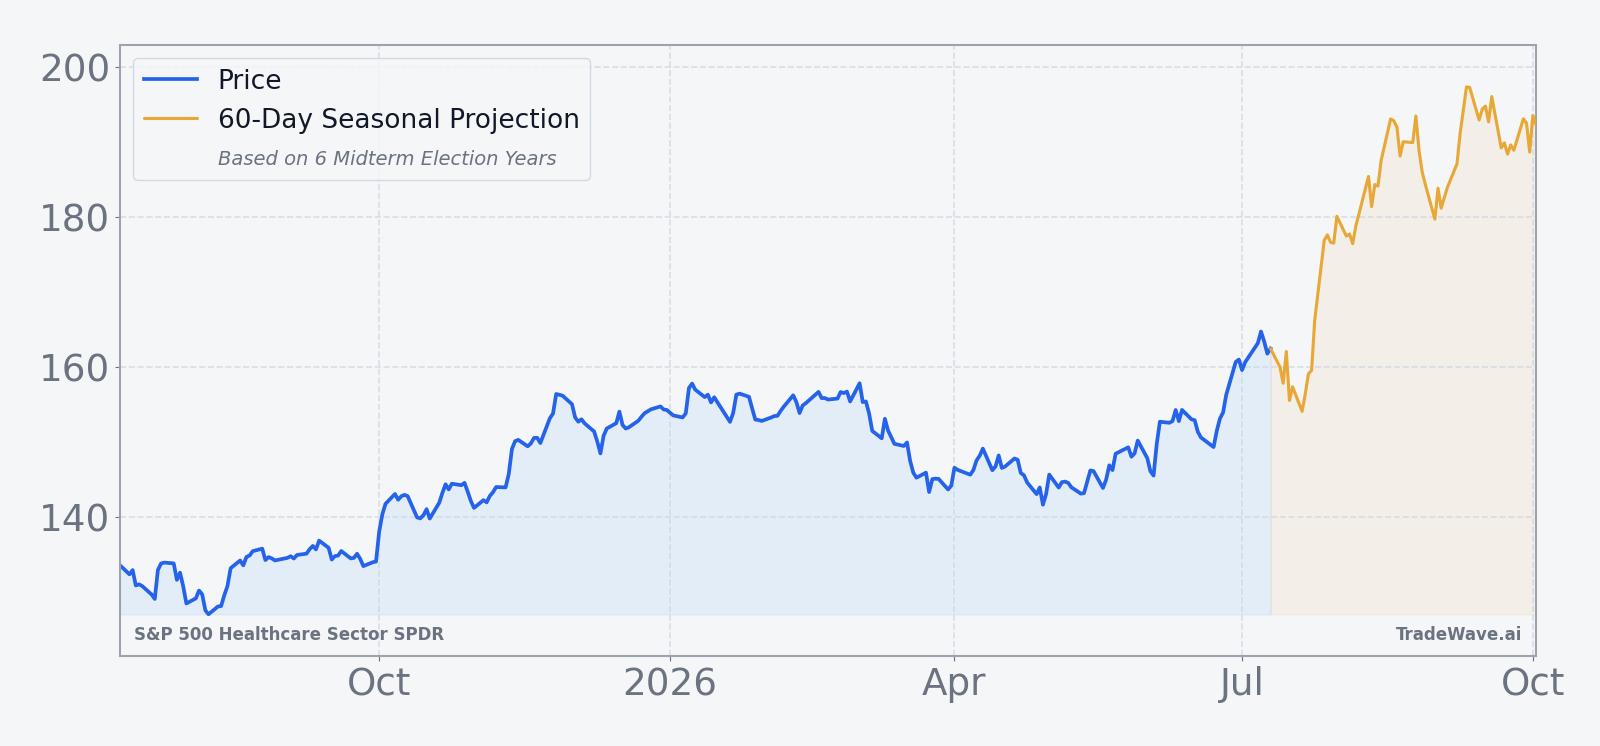
In Aug 2025, Reuters reported that healthcare stocks were among the leaders as the S&P 500 and Nasdaq hovered near record highs on expectations for a potential Federal Reserve rate cut, underscoring how the sector can benefit when investors seek quality growth with defensive characteristics.[1] That backdrop of sector leadership, combined with the current options skew toward calls and the approaching 155-day seasonal window, gives traders a clear framework: XLV is already in motion, and the calendar is about to flip into a part of the midterm year that has historically rewarded long exposure.
Sources
About this seasonal analysis
Seasonal pattern data is sourced from TradeWave.ai, which analyzes historical price behavior across annual calendar windows going back up to 30 years. Read the full data methodology or the book The 100-Year Pattern by Afshin Moshrefi (2026 edition). Past performance of seasonal patterns does not guarantee future results. This article is for informational purposes only and does not constitute investment advice.