S&P 500 Energy Sector SPDR (XLE) Has Rallied in 5 of 6 Midterm April Windows
S&P 500 Energy Sector SPDR is trading near recent highs as it moves through a 13-day midterm-year seasonal window that has often favored the bulls.

What is the seasonal pattern for S&P 500 Energy Sector SPDR (XLE)?
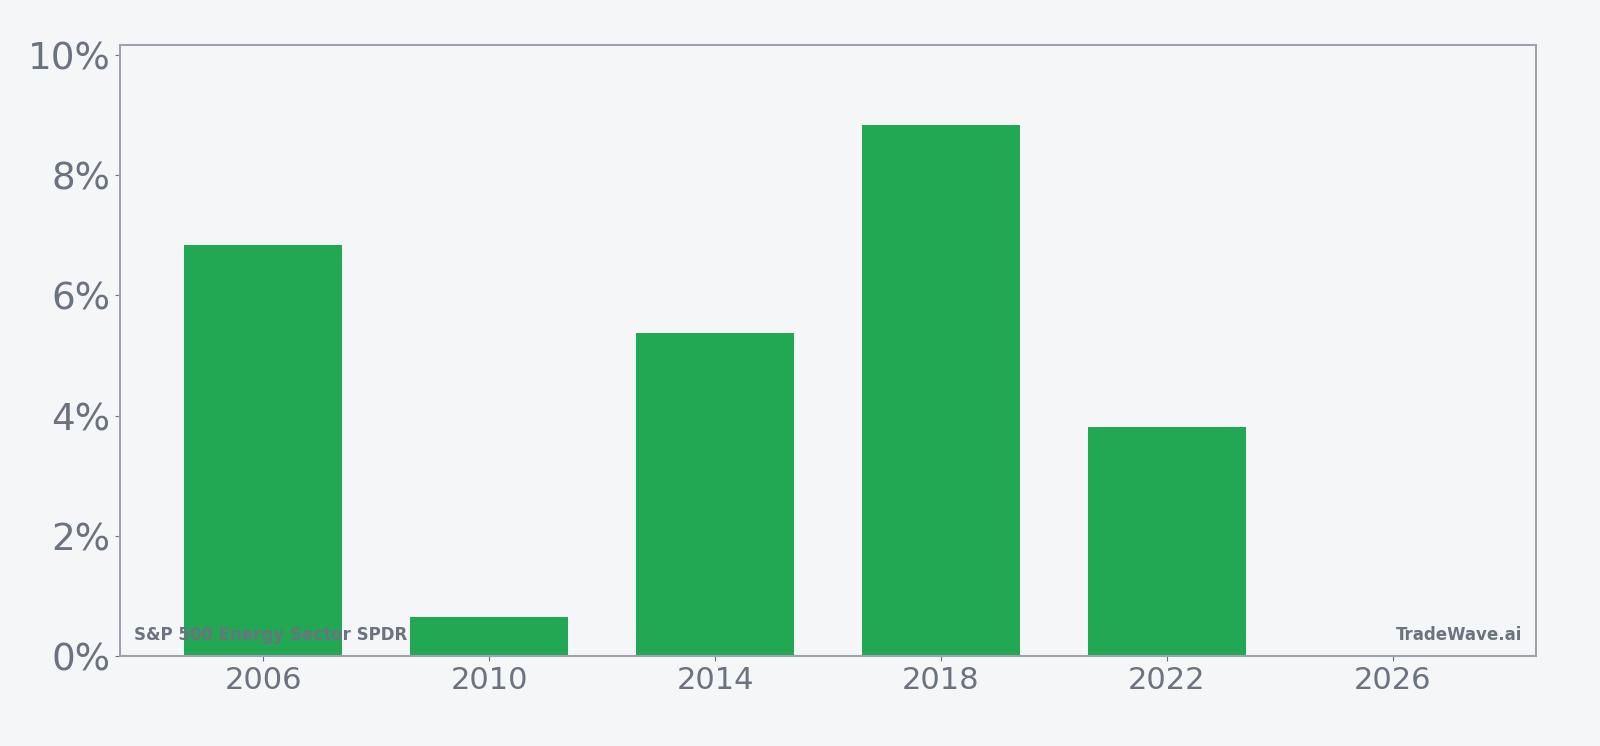
S&P 500 Energy Sector SPDR has risen in 5 of 6 midterm-year windows during this 13-day stretch starting Apr 7, with an average gain of 5.11% in winning years.
- 5 wins and 1 loss in this window across the last 6 midterm election years, with 83% of years finishing higher.
- Seasonal window runs 13 trading days from Apr 7, during which XLE’s winning years have averaged 5.11% gains, while all years together average 3%.
- Trade Direction is long, with 5 winners and 1 loser shaping a 22% cumulative return across the sample.
- Average loss in down years is -4.7%, showing that when the pattern misses, it can miss by a meaningful amount.
- Sharpe ratio of 0.69 and a TradeWave Ratio of 1.15 point to a historically favorable but not one-way seasonal edge.
- Intraperiod swings have included solid upside runs and modest drawdowns, making this a historically active trading window for XLE.
According to historical data from TradeWave.ai, this midterm-year stretch has behaved differently from an average April for energy stocks. The next section walks through how that pattern has played out for S&P 500 Energy Sector SPDR in prior cycles.
How has S&P 500 Energy Sector SPDR (XLE) traded in this midterm-year April window?
S&P 500 Energy Sector SPDR has risen in 5 of the last 6 midterm election years during this 13-day April window, with winning years averaging 5.11% gains and a 3% average across all years. The current window began on Apr 7 and finds XLE around 89, near the upper end of its past-year range and coming off a modest 0.61% gain over the last month. That combination of a historically bullish XLE seasonal trend and a market already leaning long on energy exposure raises the stakes for how this midterm-year pattern plays out.
Grouping the data by the presidential election cycle matters here because this window only looks at midterm election years, which often feature policy uncertainty, shifting regulation and volatile sector rotation. In that context, a 22% cumulative return across the last six midterm-year iterations stands out for an energy ETF that usually trades as a macro hedge rather than a calendar-driven trade.
The trade direction for this pattern is explicitly long. Across the six midterm-year samples, 83% of years finished higher, with 5 winners and just 1 loser. Average gains in the winning years came in at 5.11%, while including the lone down year pulls the all-years average to 3%, which is still a solid short-window outcome for a broad energy basket.
The per-year breakdown shows how that plays out in practice. In 2018, XLE logged an 8.84% net gain during the window, with a best intraperiod run of 9.68% from the entry price and only a 1.55% worst drawdown from that starting point. By contrast, 2010 was the softest year, with a 0.66% net gain and a maximum favorable move of 2.63% against a -1.22% worst intraperiod dip, illustrating that even the weaker outcomes have still leaned slightly positive.
The historical seasonal average trend line slopes steadily higher across the 13 trading days, with most of the typical gain accruing in the middle of the window rather than in a single burst at the start or end. That profile suggests a tendency for energy stocks to grind higher through this stretch rather than spike and fade.
A second view that layers in best and worst intraperiod swings helps frame the risk and reward inside the window.
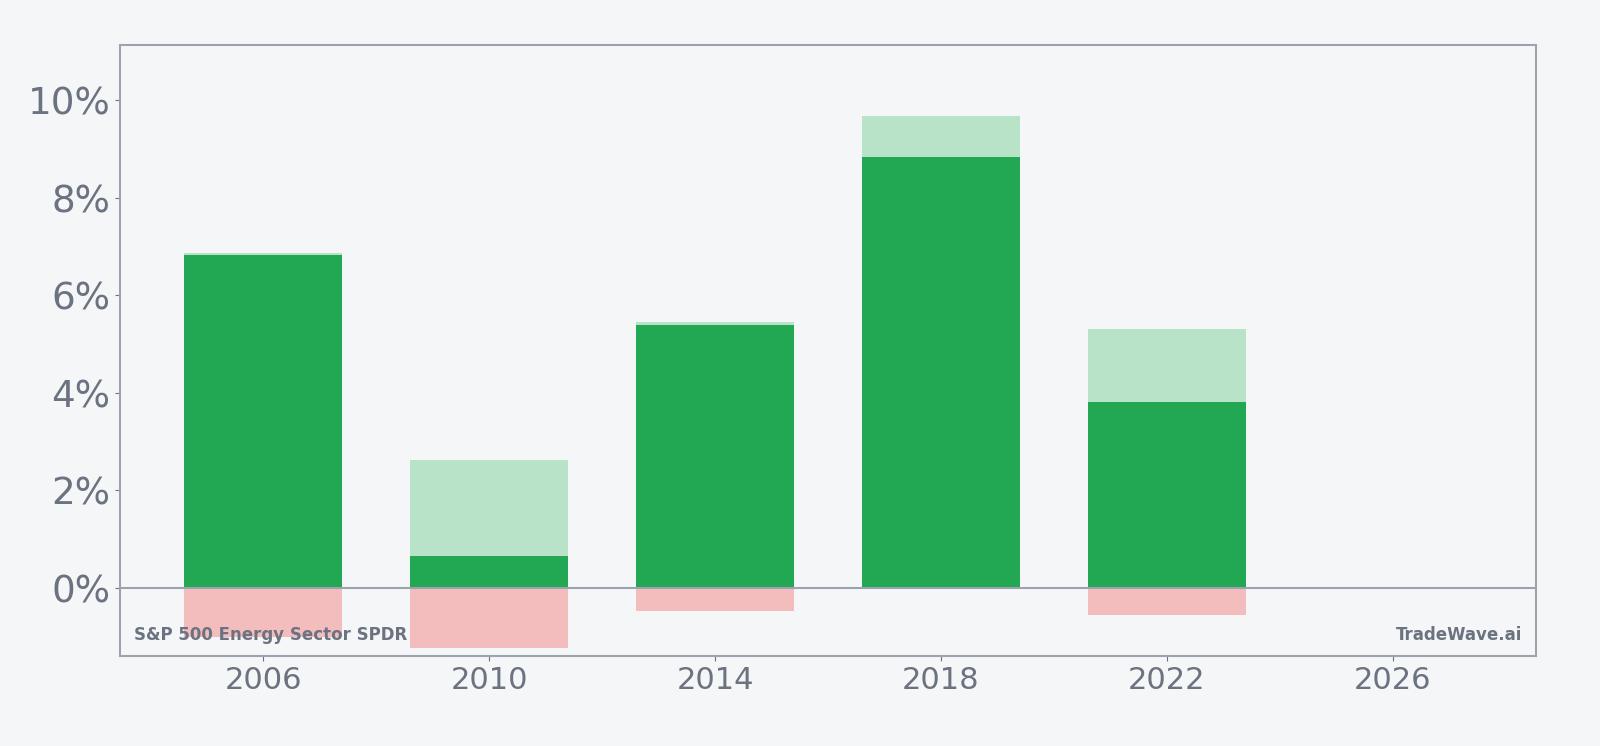
Across the sample, maximum favorable moves inside the window have typically been a bit larger than the final net gains, while maximum adverse moves have stayed relatively contained, often within a few percentage points of the entry. That mix of solid upside excursions and modest drawdowns is what underpins the 1.15 TradeWave Ratio and a Sharpe ratio of 0.69, pointing to a historically constructive but not risk-free XLE seasonal trend in midterm Aprils.
History does not guarantee future results; adverse excursions can still be meaningful even in winning windows, and a single outlier year can look very different from the average.
Why does S&P 500 Energy Sector SPDR (XLE) follow this seasonal pattern?
One likely driver is the way midterm election years cluster policy headlines and regulatory noise in the first half of the year, which can push investors toward energy as a defensive macro hedge. Analysts also point to sector rotation tied to fiscal and infrastructure debates, which often surface around this point in the political cycle and can steer flows into large integrated oil and gas names. The pattern may also reflect commodity supply and demand seasonality, as refiners and producers position ahead of the summer driving season, lifting the broader energy sector ETF during this specific April trading window.
What is driving S&P 500 Energy Sector SPDR (XLE) today?
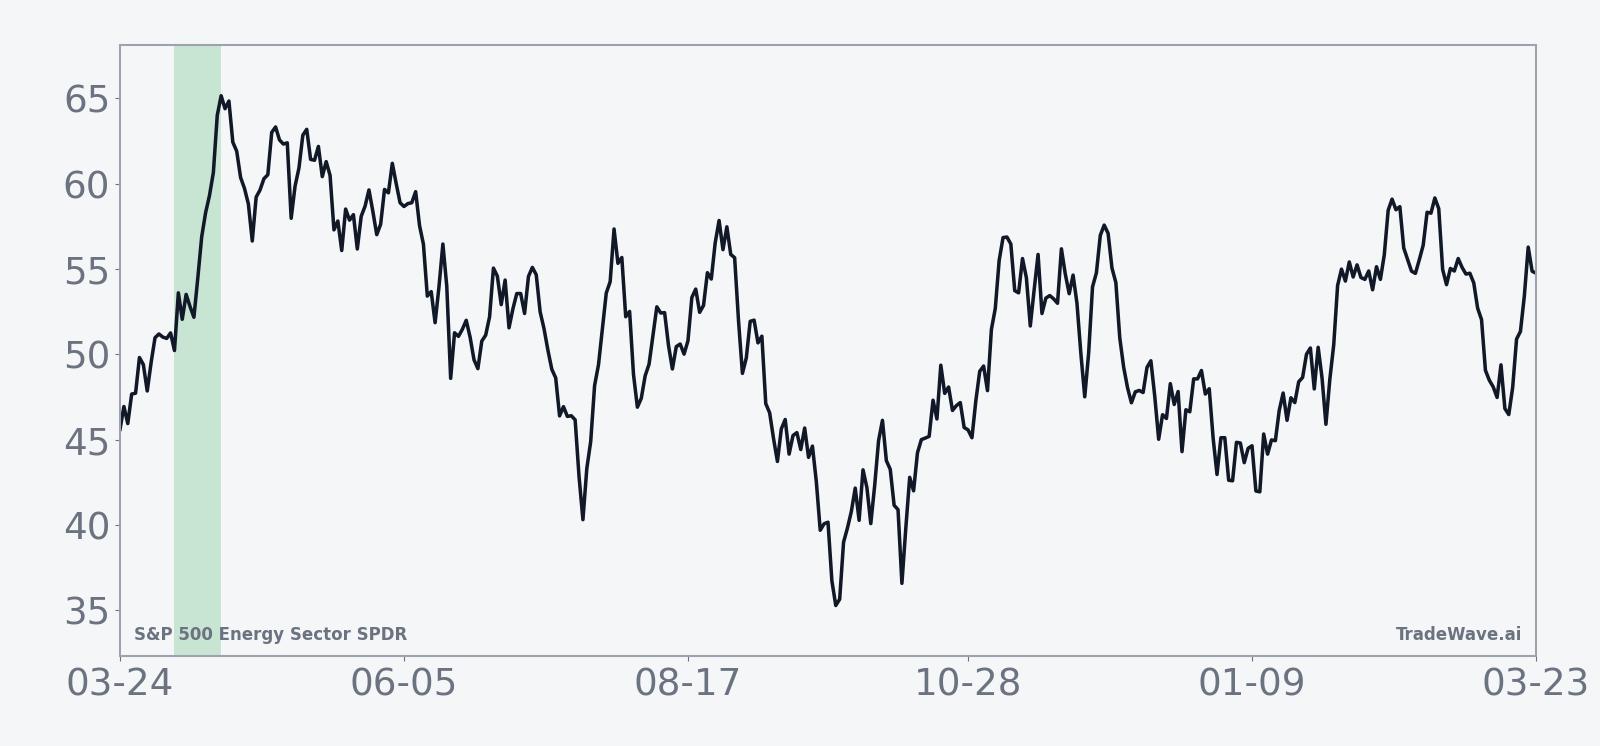
XLE is changing hands around 89, with a 0.61% gain over the past month and volumes that remain anchored by a 20-day average of roughly 58 million shares. The ETF has been pulled higher by a mix of geopolitical tension and technical optimism, as U.S. oil executives warn that disruptions tied to the Iran conflict and the Strait of Hormuz could deepen the global energy crunch and support higher crude prices over time.[1] At the same time, some strategists argue that energy stocks, including XLE, still trade at a discount and are pitching options structures that lean bullish on the sector’s next leg.[2] Retail traders have also used XLE as a hedge, with heavy buying reported in the first hour of trading during recent U.S.-Israeli strikes on Iran, underscoring how quickly flows can pivot into the ETF when geopolitical risk flares.[4]
The chart below situates the latest move in its recent multi-month context, alongside a 60-day seasonal projection path.
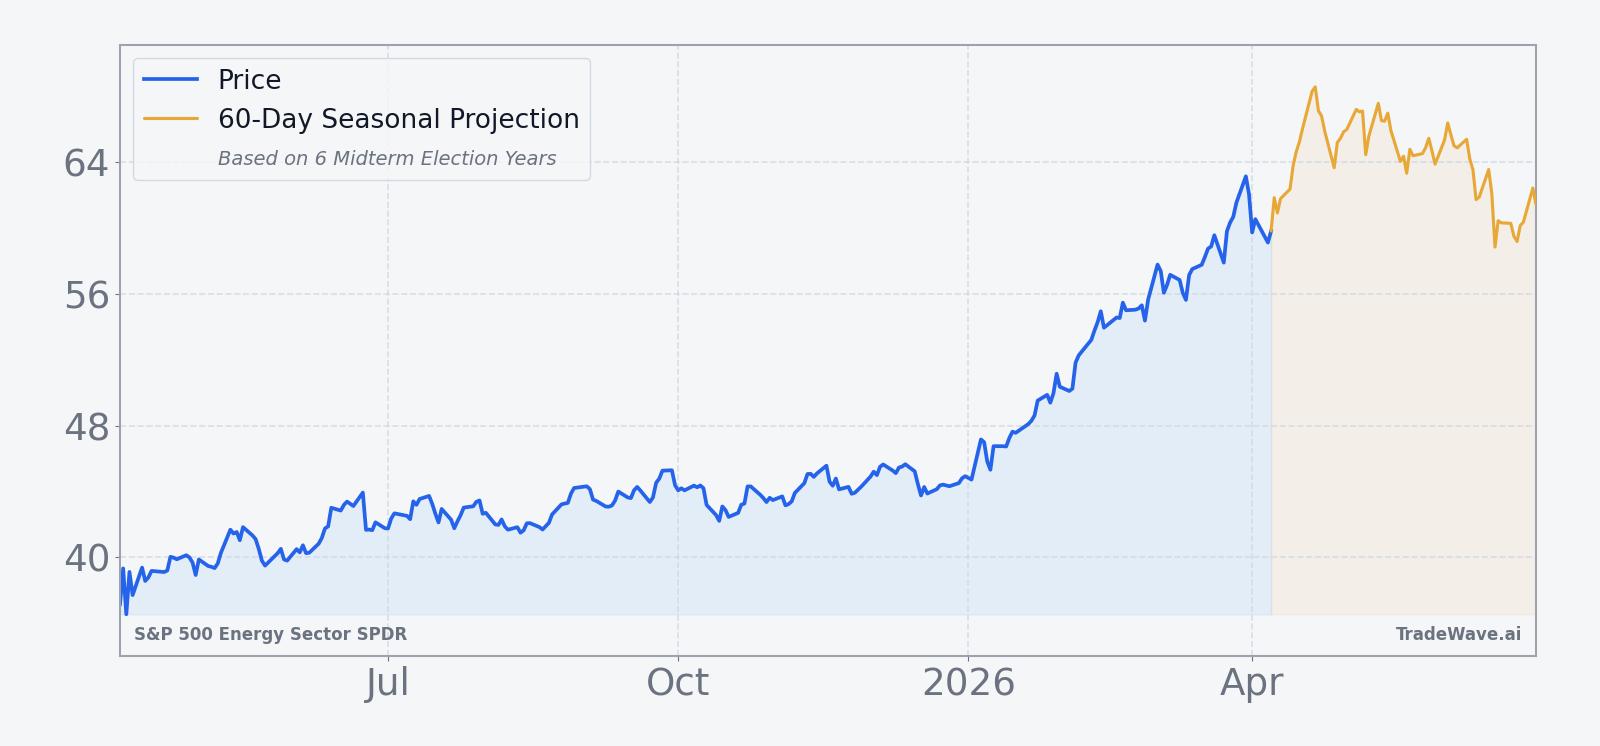
From a macro lens, the sector backdrop remains defined by supply risk and policy uncertainty. Executives have warned that any prolonged disruption in key shipping lanes could tighten crude markets further, while investors weigh how potential policy shifts on drilling, exports and emissions might affect long-term cash flows for the largest energy companies.[1] Technical analysts see XLE near an inflection point, with converging trendlines hinting at a possible breakout if buyers stay engaged.[3] Against that backdrop, the current XLE seasonal trend window adds a layer of historical context to a sector that is already front and center in the macro conversation.
What should traders watch in this XLE seasonal window?
For this 13-day stretch, the first thing to watch is whether XLE behaves like the historical pattern and grinds higher through the middle of the window rather than front-loading the move. Price action relative to the recent range matters: holding above the 50-day moving average and prior swing highs would be more consistent with the past midterm-year outcomes, while a quick break lower would mark a clear divergence from the usual XLE seasonal trend. Traders will also be watching the policy and geopolitical calendar, including any fresh headlines around Iran and the Strait of Hormuz, which could either reinforce or overwhelm the historical seasonality.[1] Finally, options positioning and retail flows bear monitoring: if bullish options structures and hedging demand in XLE continue to build, that would signal that investors are leaning into both the macro story and the seasonal window, whereas fading activity would suggest a more cautious stance despite the strong historical record.[2][4]
Sources
About this seasonal analysis
Seasonal pattern data is sourced from TradeWave.ai, which analyzes historical price behavior across annual calendar windows going back up to 30 years. Read the full data methodology or the book The 100-Year Pattern by Afshin Moshrefi (2026 edition). Past performance of seasonal patterns does not guarantee future results. This article is for informational purposes only and does not constitute investment advice.