19-for-19: S&P 500 (SPX) Enters a 297-Day Midterm Rally Window Averaging 17.78% Gains
The S&P 500 is approaching a 297-day midterm-to-pre-election seasonal window with a perfect win record, even as the index trades below record highs and navigates a tricky macro backdrop.

What is the seasonal pattern for S&P 500 (SPX)?
S&P 500 has risen in 19 of 19 midterm-to-pre-election windows during this 297-day stretch, with an average gain of 17.78% in winning years.
- 19 for 19 in this window, with winning years averaging 17.78% gains across the last 19 midterm election cycles.
- The upcoming 297-day trading window starts on Jul 10, 2026 and runs deep into the year before the presidential election.
- Percent Profitable is 100%, with 19 winners and 0 losers across the historical sample.
- Annualized return over these windows clocks in at 17.18%, with a Sharpe ratio of 1.16 on end-of-window outcomes.
- The TradeWave Ratio of 1.37 signals that price has typically traveled meaningfully in the long direction within the window, not just at the close.
- Intraperiod drawdowns have still been sharp in some years, with adverse moves exceeding 16% even in ultimately positive windows.
According to historical data from TradeWave.ai, this midterm-to-pre-election stretch has behaved very differently from an average year on the calendar, and the next iteration is now on the horizon.
How has S&P 500 (SPX) traded in this midterm-to-pre-election window?
The S&P 500 has posted gains in all 19 midterm-to-pre-election windows that match this 297-day stretch, averaging 17.78% returns for long exposure. Today the index closed at 7,405.68, down 1.41% on the session and sitting about 2.8% below its 52-week high of 7,620.90.[1]
Grouping the data by the presidential election cycle matters here because this window straddles the back half of the midterm election year and the run-up into the year before the presidential election, a phase when policy visibility tends to improve and risk appetite often rebuilds after earlier volatility. In this framework, the S&P 500 is currently in the midterm election year, with the upcoming window carrying through into the historically strong pre-election phase.
This seasonal window begins on Jul 10, 2026 and spans 297 trading days. Historically, during this period, the S&P 500 has shown a strong bullish tendency for long positions, with every midterm-to-pre-election cycle in the sample finishing higher. The trade direction is explicitly long, and the pattern has delivered a cumulative return of 1,933% across the 19 historical windows, with an annualized return of 17.18%.
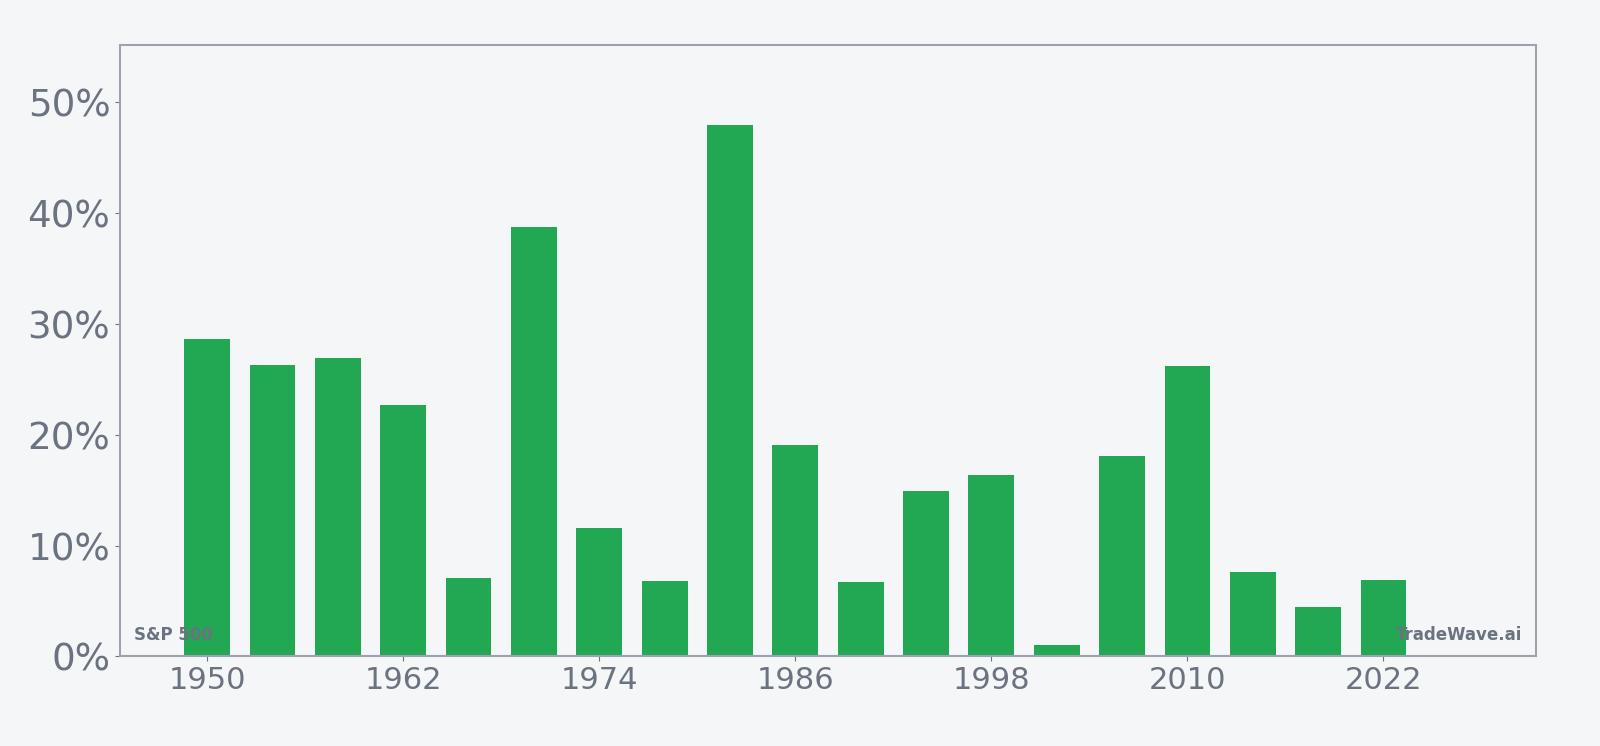
Percent Profitable sits at 100%, with 19 winners and 0 losers, which is rare for any long-duration index pattern. Average profit in winning years is 17.78%, while the median outcome of 16.34% shows that gains have not been driven by just one or two outliers. Even the softer years in this midterm election year sample, such as 2002 with a 1.04% net return, still finished in positive territory.
The intraperiod path has not been a straight line. Maximum favorable moves, or the best point-to-peak rallies within the window, have reached as high as 27.05% in 2010, while several other cycles, including 1986, 1998 and 2006, saw peak run-ups in the mid- to high-teens. On the downside, maximum adverse excursions, which capture the worst drawdown from entry during the window, have been as deep as -20.70% in 1998 and around -17% in 1990 and 2002, underscoring that even “all green” windows can involve painful pullbacks along the way.
Looking at individual years, 2010 stands out as one of the strongest executions of this pattern, with a 26.18% net gain, a 27.05% peak rally and only a -3.62% worst drawdown from the starting point. At the other end of the spectrum, 2002 delivered just 1.04% net despite a 4.84% intraperiod rally and a -16.50% drawdown, a reminder that macro stress can compress returns even inside a historically favorable seasonal regime.
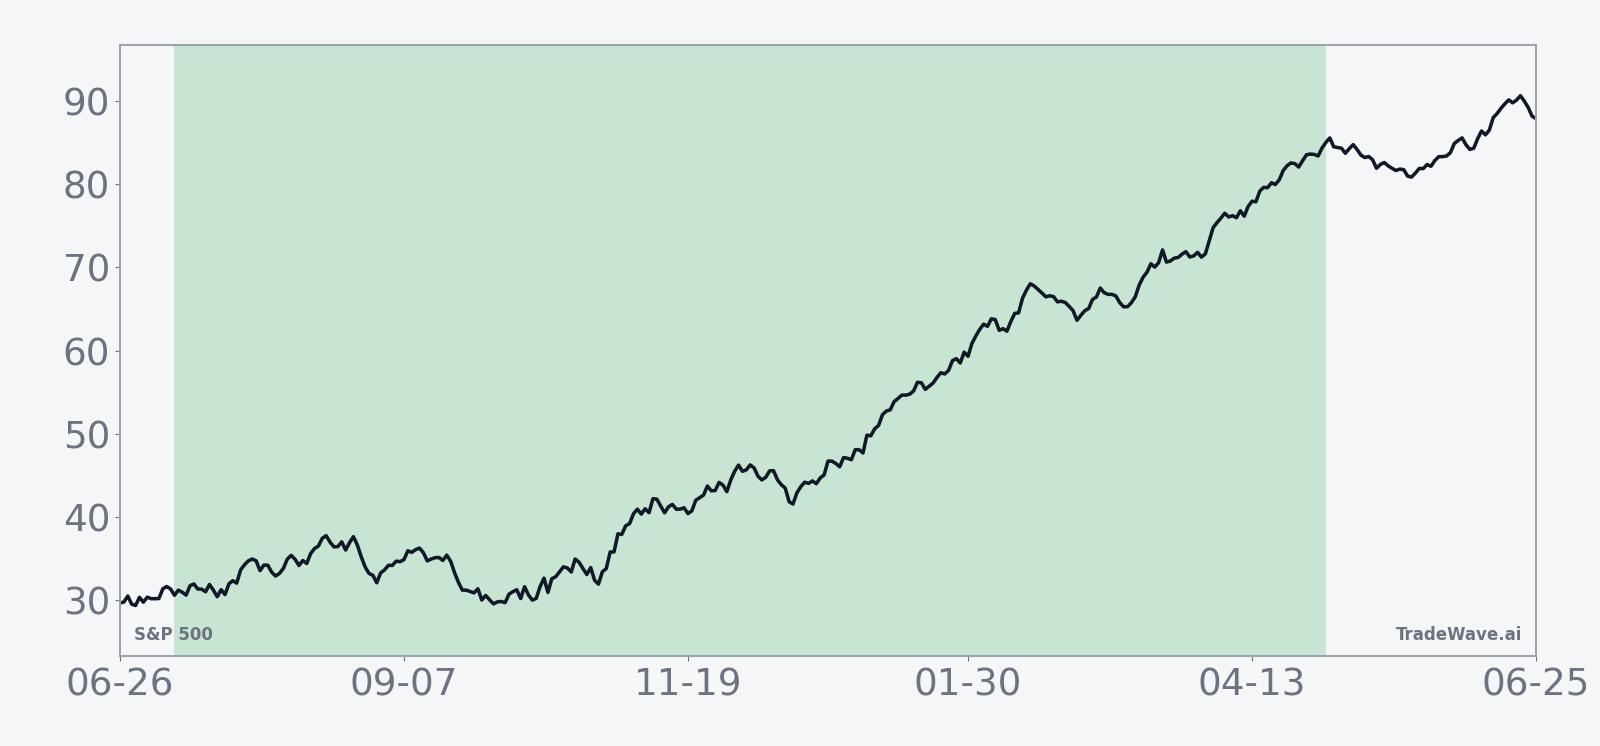
The historical seasonal average trend for this window shows a relatively steady climb rather than a single explosive burst, with gains accruing across much of the period and only modest soft spots. That profile fits the idea of a long midterm-to-pre-election regime where pullbacks have tended to be bought and rallies have had room to extend.
A closer look at yearly net returns alongside peak rallies and worst drawdowns shows how consistently the pattern has favored longs while still allowing for sizable swings.
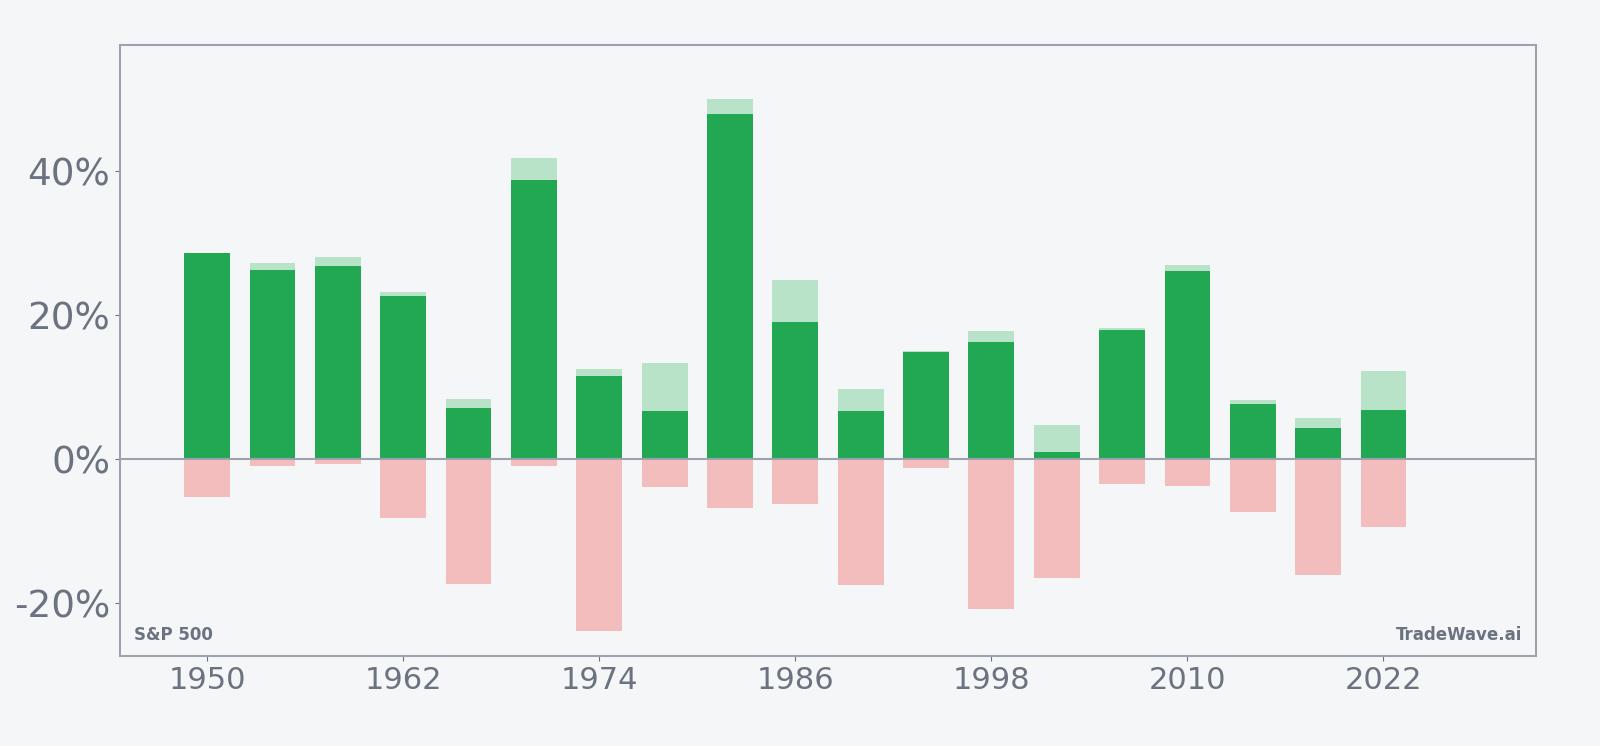
The combined net, maximum favorable and maximum adverse excursion bars highlight a key feature of this S&P 500 trading window: upside persistence has dominated final outcomes, but intraperiod volatility has often been meaningful, with several cycles showing double-digit drawdowns before finishing higher.
History does not guarantee future results; adverse excursions can be large even in winning windows, and traders should treat this pattern as context rather than a forecast.
Why does S&P 500 (SPX) follow this seasonal pattern?
This pattern may reflect a mix of earnings calendar clustering, fiscal policy and institutional positioning around the midterm and pre-election years. One likely driver is that political uncertainty often peaks earlier in the midterm cycle, with clarity on policy and spending emerging as the year progresses, which can support risk assets into the year before the presidential election. Portfolio managers also tend to rebalance and add equity exposure once midterm volatility has passed, reinforcing the historical midterm-to-pre-election seasonal trend.
What is driving S&P 500 (SPX) today?
The S&P 500 closed at 7,405.68 on Jun 18, down 1.41% on the day, leaving the index about 2.8% below its 52-week high of 7,620.90 and modestly above its 50-day moving average around 7,301.[1] The pullback comes after a stretch in which technology leadership and expectations for eventual Federal Reserve rate cuts have supported U.S. equities broadly, even as macro risks tied to war headlines, strong jobs data and oil-driven inflation have kept volatility elevated.[2][3]
The chart below situates the latest move in its recent multi-month context, alongside a short-term seasonal projection.
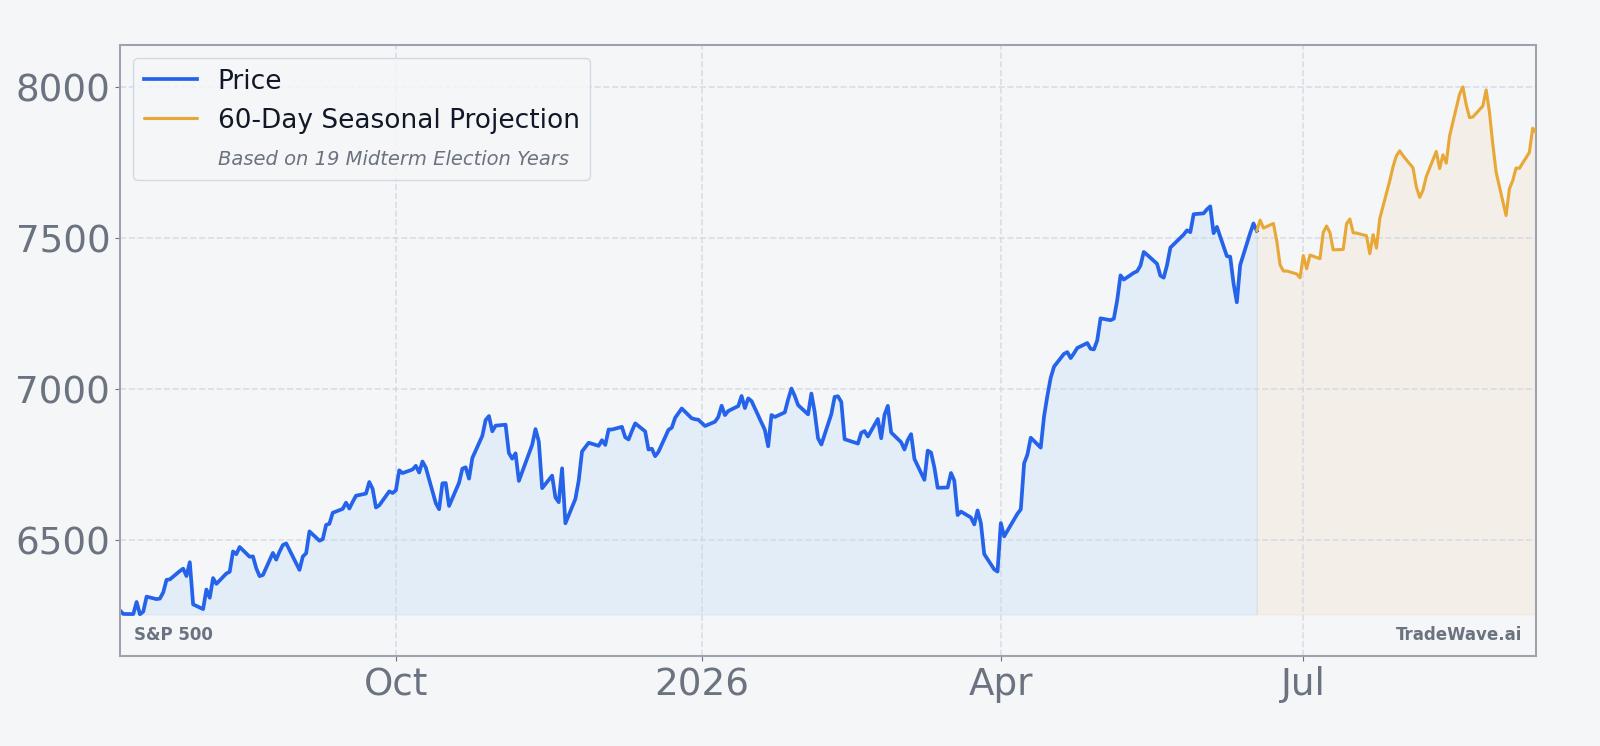
In Feb 2026, one analysis highlighted how an AI-driven shakeout in technology could trigger rotation within the S&P 500, with some high-fliers stumbling while others consolidate leadership.[4] That sector story matters because tech remains a primary driver of expected index gains, so any shift in AI sentiment or earnings delivery can quickly change the tone of SPX moves.[5] Earlier, in Apr 2026, technical work pointed to a DeMARK exhaustion signal and a short-term recovery toward resistance, but also warned that macro shocks could still drag the index toward lower support zones, a reminder that the tape has been balancing bullish momentum against late-cycle risk rather than trading in a straight line.[6]
Looking back to Jul 2025, the S&P 500 had already staged an unusually strong recovery that some technicians argued was rare over a 50-year span, with a break below key levels flagged as a sign that a blow-off phase might be ending.[7] That backdrop of powerful rallies punctuated by sharp corrections is consistent with the intraperiod swings seen in the midterm election year seasonal data, where even winning windows have included double-digit drawdowns before the trend reasserted itself.
What should traders watch as this seasonal window approaches?
First, the calendar: the next iteration of this 297-day midterm-to-pre-election window begins on Jul 10, 2026, so the coming weeks are about preparation rather than execution. Traders will be watching whether the S&P 500 holds above its 50-day moving average and whether any break of recent support resembles the deeper adverse excursions seen in weaker historical years like 1990, 1998 or 2002.
Second, the policy and data calendar will matter for how closely this cycle tracks the historical pattern. Inflation prints, labor data and any shift in the Fed’s rate-cut narrative could either reinforce the typical pre-election risk-on tone or produce a more choppy path that still ends higher, similar to the compressed 2002 outcome.[2] A backdrop of easing policy and stable growth would rhyme with many of the stronger historical windows, while renewed macro stress could increase the odds of a high-volatility but still positive result.
Third, sector leadership inside the index will be a key tell. If technology and AI-linked names continue to dominate flows and earnings, the S&P 500 could see rallies that resemble the high MFE years where upside built steadily across the window.[4][5] If leadership broadens to cyclicals or defensives instead, the index might still follow the historical seasonal trend but with a different internal mix, which matters for traders using sector ETFs or single-stock positions alongside SPX exposure.
Finally, behavior inside the window will offer a real-time check on the pattern. A familiar script would involve early volatility and occasional double-digit drawdowns that are ultimately bought, with the index grinding higher into the year before the presidential election. A sharp, persistent break that fails to recover would be a clear deviation from the last 19 cycles and a sign that macro or policy forces have overwhelmed the usual seasonal tailwind.
Sources
- [1] Seeking Alpha – “S&P 500: Prepare For Change (Technical Analysis)”, Apr 5, 2026.
- [2] Seeking Alpha – “S&P 500: Prepare For Change (Technical Analysis)”, Apr 5, 2026.
- [3] Seeking Alpha – “S&P 500: Prepare For Change (Technical Analysis)”, Apr 5, 2026.
- [4] Seeking Alpha – “AI Bubble, Tech Funeral? Who Will Fail And Who Will Double Down? (SPX)”, Feb 13, 2026.
- [5] Seeking Alpha – “AI Bubble, Tech Funeral? Who Will Fail And Who Will Double Down? (SPX)”, Feb 13, 2026.
- [6] Seeking Alpha – “S&P 500: Prepare For Change (Technical Analysis)”, Apr 5, 2026.
- [7] Seeking Alpha – “S&P 500: This Is Unusual, Week Starting 7th July (Technical Analysis)”, Jul 6, 2025.
About this seasonal analysis
Seasonal pattern data is sourced from TradeWave.ai, which analyzes historical price behavior across annual calendar windows going back up to 30 years. Read the full data methodology or the book The 100-Year Pattern by Afshin Moshrefi (2026 edition). Past performance of seasonal patterns does not guarantee future results. This article is for informational purposes only and does not constitute investment advice.