15-for-15: Nasdaq 100 (NDX) Has Rallied Every 40-Day June-July Window, Averaging 4.55% Gains
Nasdaq 100 is sliding from record territory just as it approaches a 40-day seasonal window that has never been negative in the past 15 years, putting a spotlight on tech leadership and volatility.

What is the seasonal pattern for Nasdaq 100 (NDX)?
Nasdaq 100 has risen in 15 of 15 years during this 40-day June–July window, with an average gain of 4.55% in winning years.
- 15 for 15 in this window, with Nasdaq 100 averaging 4.55% gains in winning years across the past 15 cycles.
- The upcoming 40-day window starts Jun 10, 2026 and has been a consistently bullish NDX seasonal trend for long exposure.
- Percent Profitable is 100%, with 15 winners and 0 losers over the lookback period.
- Average profit in winning years is 4.55%, contributing to a 94% cumulative return across all 15 windows.
- The TradeWave Ratio of 2.43 signals that price has typically traveled meaningfully in the long direction within the window, even as intraperiod drawdowns have appeared.
- A Sharpe ratio of 2.05 for this pattern points to unusually strong risk‑adjusted returns compared with a typical index trading window.
According to historical data from TradeWave.ai, this early-summer stretch in Nasdaq 100 has behaved very differently from an average month on the calendar. The next section walks through how that pattern has played out and where the risks have clustered inside the window.
How has Nasdaq 100 (NDX) traded in this 40-day June–July window?
Nasdaq 100 has posted gains in every single iteration of this 40-day window for 15 straight years, averaging a 4.55% rise. The next run of that pattern begins on Jun 10, 2026, with the index last closing at 28,957.60, about 6.0% below its 52-week high of 30,762.20 after a 4.8% one-day drop.[1] That combination of a clean seasonal tailwind and a sharp pullback from records gives traders a very different setup than if NDX were grinding higher into the window.
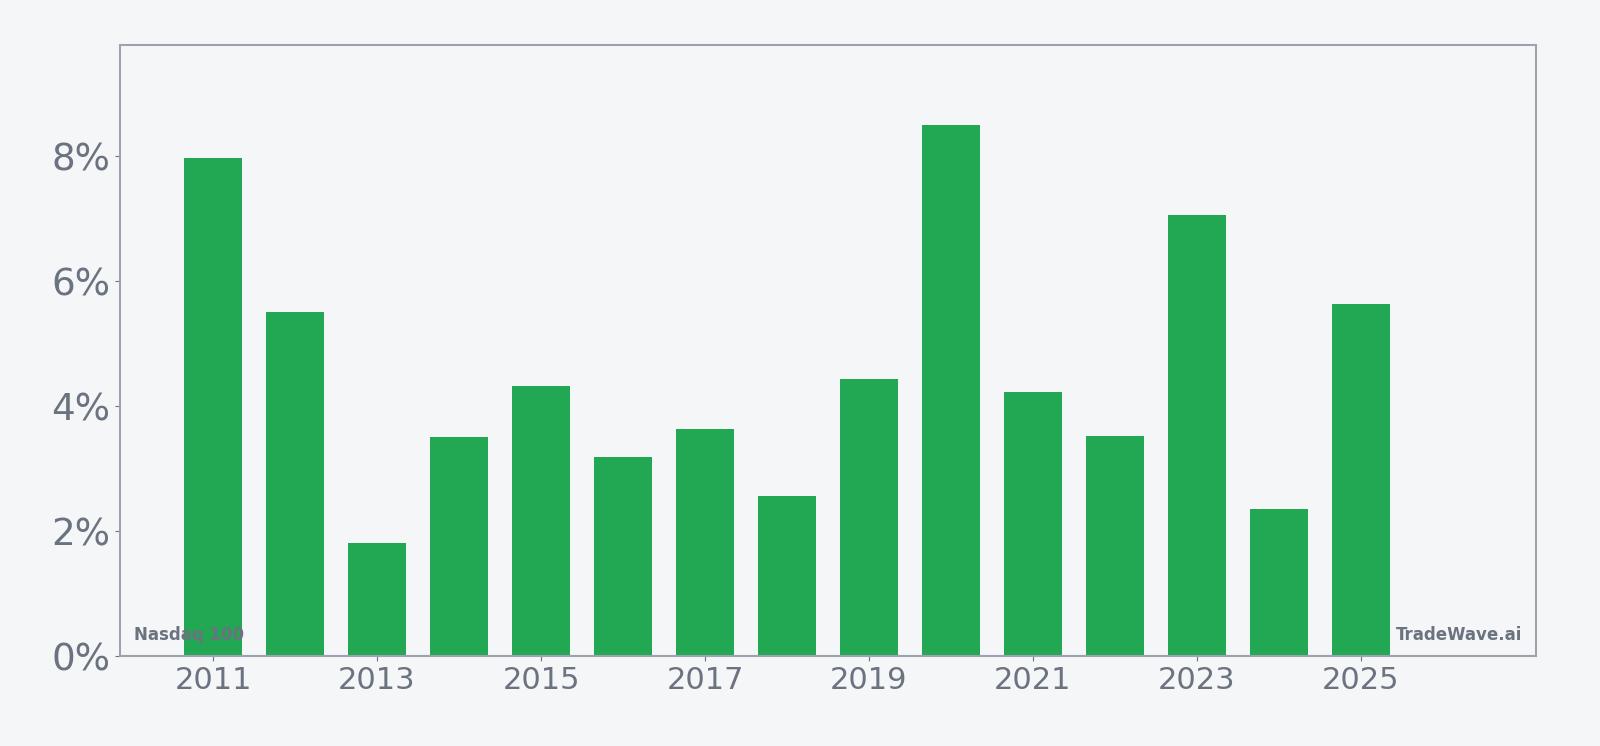
Historically this has been a long-biased Nasdaq 100 trading window. Percent Profitable sits at 100%, with 15 winners and 0 losers, and the cumulative gain across those 15 years is 94%. Average profit of 4.55% per window means the typical winning stretch has been meaningful, not just a marginal drift higher.
The per-year breakdown shows how that upside has arrived. In 2020, the index gained 8.5% in the window, with a maximum favorable move of 9.66% from entry before any giveback, while the weakest year by net outcome was 2016, which still delivered a 3.19% gain.[1] Even in softer years like 2018 and 2024, NDX finished the window higher by 2.57% and 2.35% respectively, underscoring how rarely this slice of the calendar has produced flat outcomes.
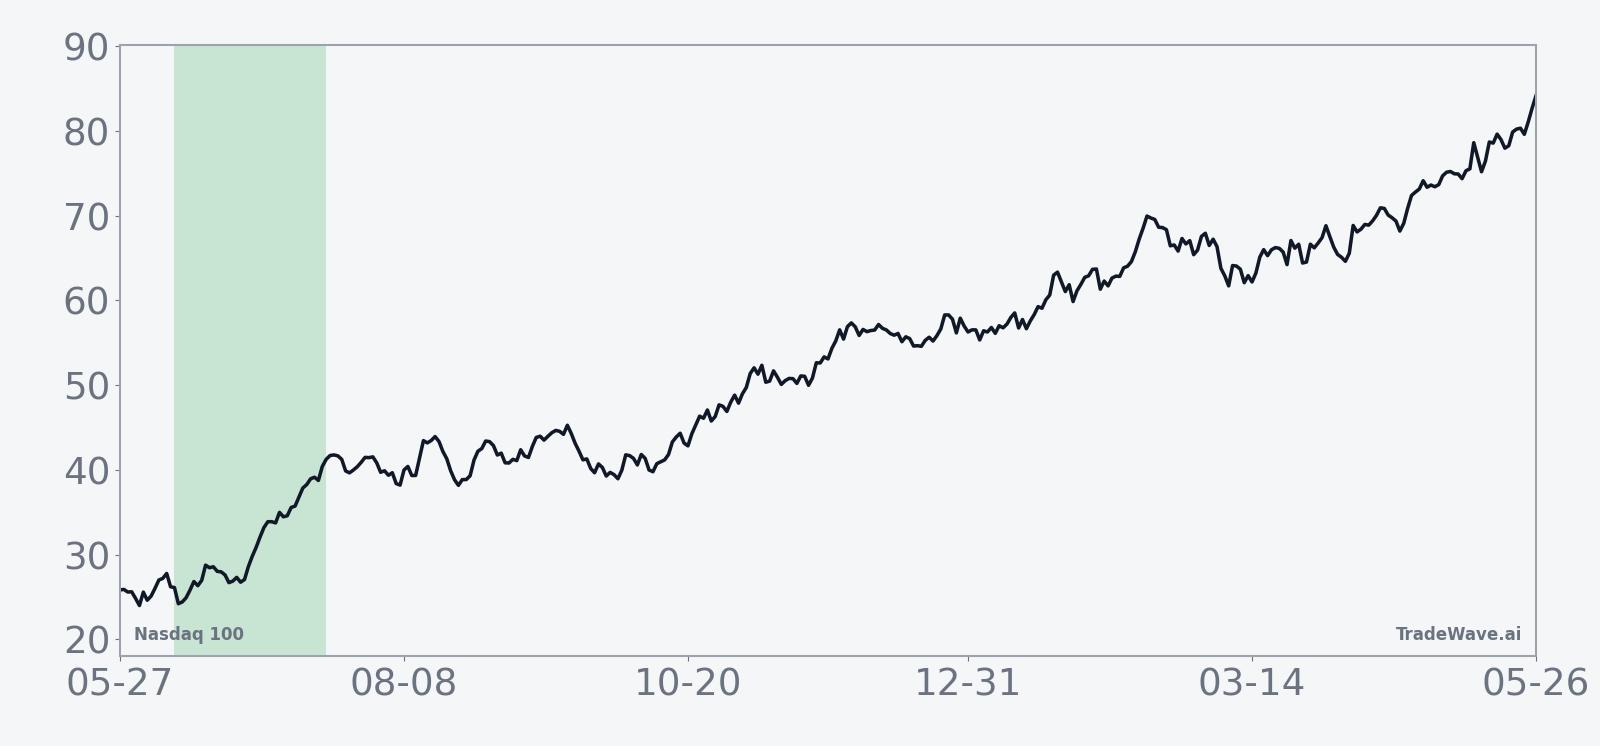
The 15-year average seasonal curve slopes higher through most of the 40 days, with gains tending to build rather than spike and fade. The pattern shows a modest acceleration in the middle of the window, then a slower grind into the end, which lines up with how large-cap tech often trades around late-quarter positioning and early Q2 earnings pre-announcements.
A second view that layers in peak rallies and worst drawdowns helps frame the risk side of this otherwise clean pattern.
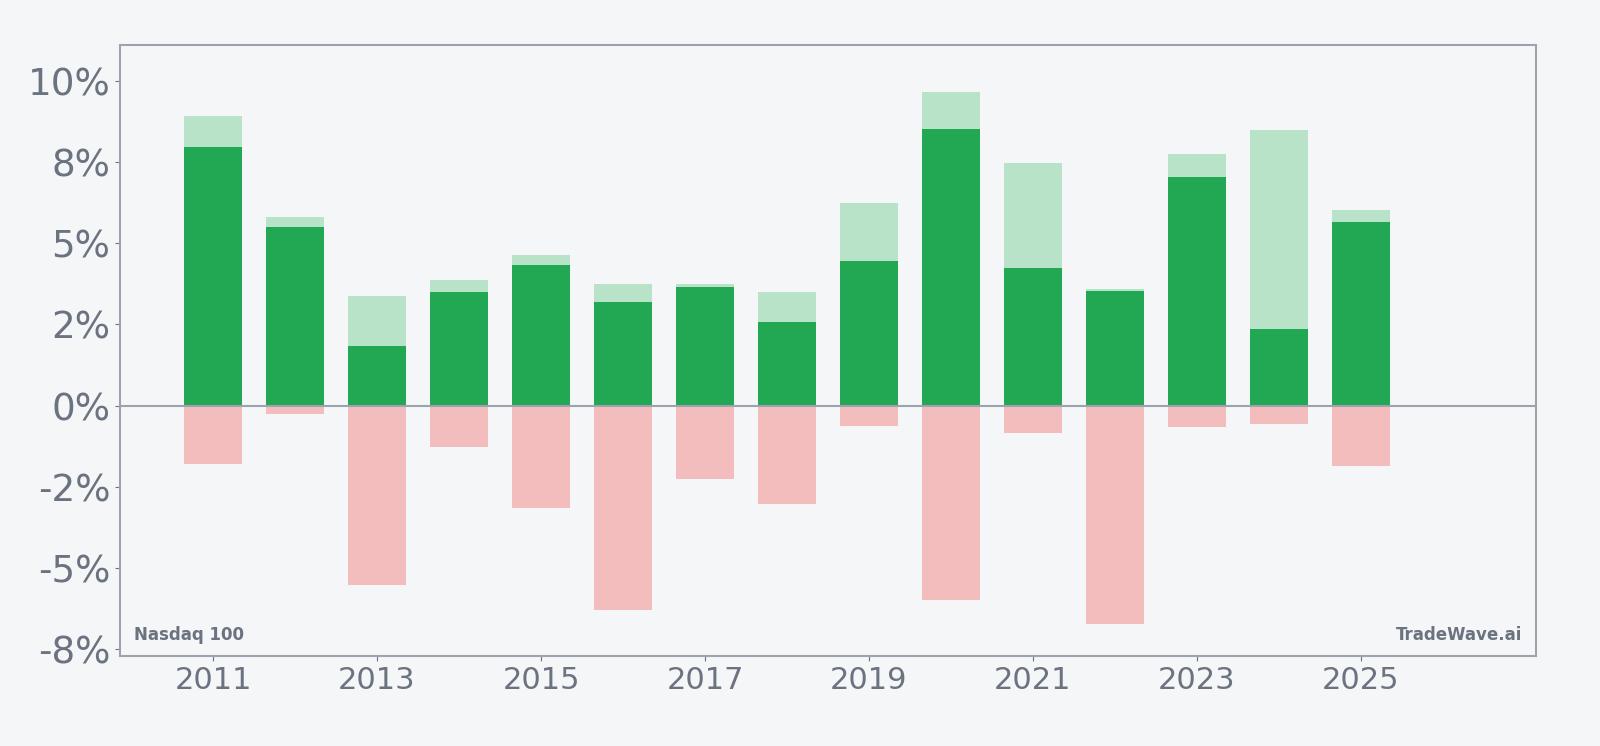
Maximum favorable moves have often stretched well beyond the final net gain, while maximum adverse moves show that even winning windows can include sharp pullbacks. In 2016 and 2022, for example, NDX still finished higher but saw worst intraperiod drawdowns of around 6% from the entry level before recovering.[1] Add it up and this has been a bullish but not low-volatility window, with a Sharpe ratio of 2.05 reflecting strong risk-adjusted returns despite those swings.
History does not guarantee future results; even in windows where every past year has finished higher, adverse excursions can be large and fast.
Why does Nasdaq 100 (NDX) follow this seasonal pattern?
One likely driver is the way institutional investors rebalance around quarter-end, often adding to winning tech and growth positions as performance pressure builds. Analysts have also pointed to the clustering of big-cap tech events and early Q2 pre-announcements in late June and July, which can pull forward demand for Nasdaq 100 exposure. The pattern may also reflect options expiration dynamics, as dealers and systematic strategies adjust hedges around large open interest in index-linked contracts.
What is driving Nasdaq 100 (NDX) today?
Nasdaq 100 closed at 28,957.60, down 4.8% on the day, after trading between 28,929.88 and 30,051.08, with volume of about 1.73 billion shares equivalent across its constituents.[1] Even after that slide, the index is only about 6.0% below its 52-week high of 30,762.20 and remains well above its 50-day moving average near 27,562.63, underscoring how strong the prior uptrend has been.[1] The pullback follows a stretch where NDX had been grinding higher on the back of mega-cap tech and growth names, which dominate the index and often dictate its day-to-day direction.[1]
Structurally, NDX is still the purest listed proxy for large-cap technology and growth exposure, housing many of the world’s biggest platform, semiconductor and cloud companies.[1] Moves in those leaders tend to ripple quickly through the broader equity market, which is why a single-session drop of nearly 5% in the index commands attention even without a specific macro headline attached. For traders focused on stock pattern analysis and sector rotation, the question is whether this is a routine shakeout in a strong tape or the start of a more durable shift in the tech sector’s seasonal outlook.
The chart below situates the latest move against the past year of trading and a 60-day seasonal projection.
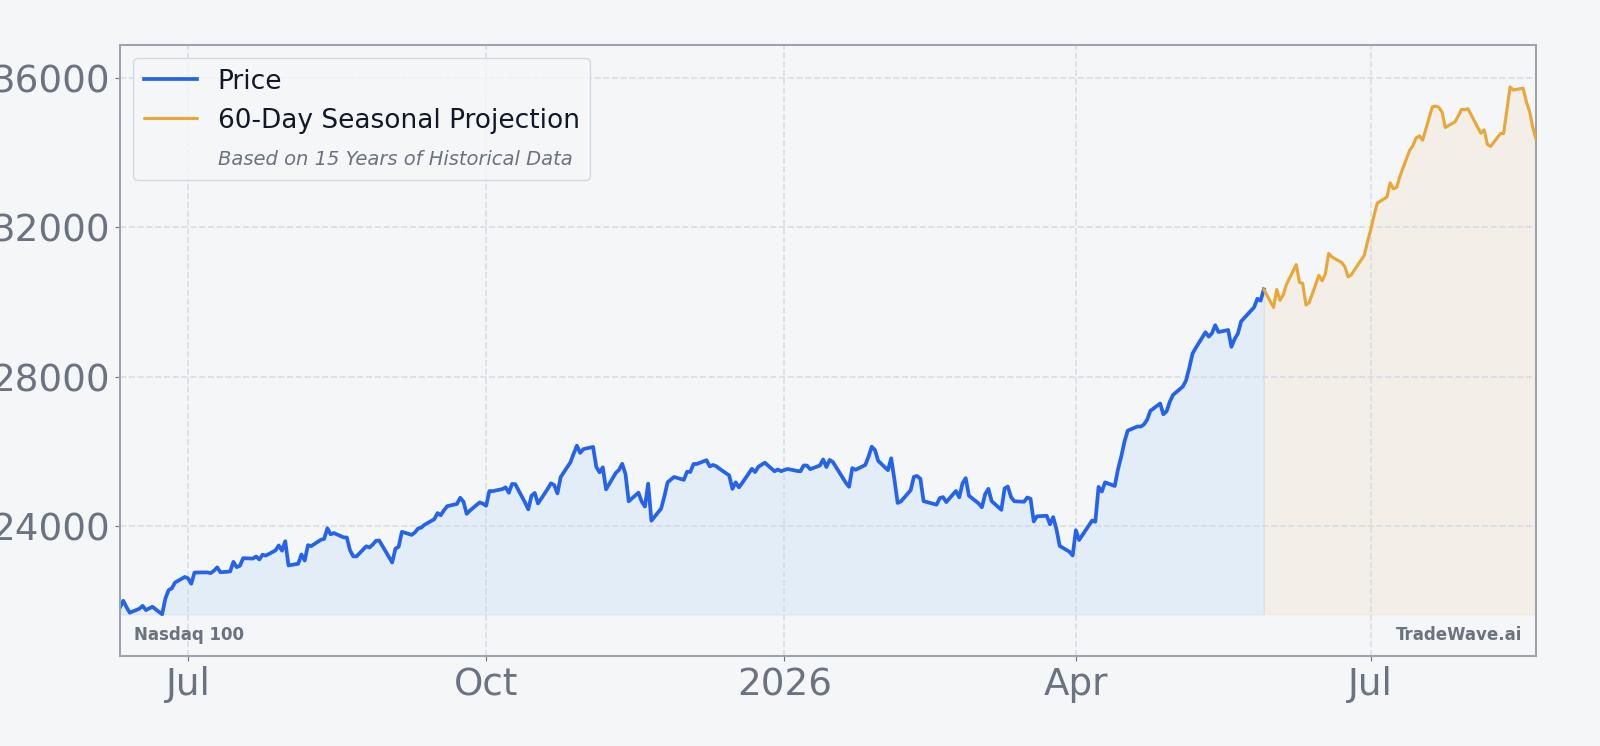
That backdrop matters because NDX is entering this historically strong early-summer window from a position of strength rather than distress. The index has gained modestly over the past month, up 0.61%, and sits comfortably above its 20-day average volume, suggesting liquidity remains deep even on volatile days.[1] If the historical NDX seasonal trend repeats, the recent dip could end up looking like a reset within a longer advance, but the intraperiod drawdowns seen in prior years are a reminder that the path has rarely been smooth.
What should traders watch in this Nasdaq 100 seasonal window?
First, watch how quickly NDX stabilizes around the 28,500 to 29,500 band relative to its 50-day moving average near 27,562. A firm base above that moving average would be more consistent with prior strong June–July windows, while a decisive break below it would mark a departure from the typical pattern.
Second, monitor leadership inside the index. Historically, this window has favored large-cap tech and growth names that dominate NDX’s weight, so continued strength in those stocks would align with the past 15 years of seasonal behavior.[1] If instead the advance narrows or rotates into more defensive pockets, that would be an early sign that the usual Nasdaq 100 trading window playbook is fraying.
Third, keep an eye on volatility inside the window, not just the end-point return. Prior cycles show that maximum adverse moves of several percent have been common even in winning years, so sharp intraday or multi-day pullbacks would not automatically contradict the historical seasonality. What would break the pattern is a sustained failure to recover those dips into higher highs before the 40 days are up.
Finally, align the calendar with upcoming macro and corporate catalysts that could intersect with this pattern. As Q2 earnings season approaches and large tech companies update guidance, any surprise that shifts the tech & growth exposure narrative could either amplify or overwhelm the usual seasonal bias.[1] For traders who track historical seasonality alongside fundamentals, the next 40 trading days in NDX will be a clean test of whether this 15-for-15 window can extend its streak.
Sources
About this seasonal analysis
Seasonal pattern data is sourced from TradeWave.ai, which analyzes historical price behavior across annual calendar windows going back up to 30 years. Read the full data methodology or the book The 100-Year Pattern by Afshin Moshrefi (2026 edition). Past performance of seasonal patterns does not guarantee future results. This article is for informational purposes only and does not constitute investment advice.