8 of 9 Midterm Runs: Adobe Inc. (ADBE) Has Averaged 21% Gains From Late June
Adobe Inc. is trading near its 52-week lows after a sharp post-earnings slide, just as a historically strong midterm-election seasonal window approaches that has often rewarded patience but punished weak hands.

What is the seasonal pattern for Adobe Inc. (ADBE)?
Adobe Inc. has risen in 8 of 9 midterm-election-year windows starting around Jun 30, with an average gain of 24.24% in winning years.
- 8 wins and 1 loss in this window, with winning years averaging 24.24% gains and a 21% average when all years are included.
- The seasonal window begins on Jun 30 and runs for 264 trading days, covering the back half of the midterm election year and into the following phase.
- Percent Profitable stands at 89%, with 8 winners and 1 loser across the last 9 midterm election years.
- Avg Profit reflects winners only at 24.24%, while Avg Profit - All is 21%, showing that the lone losing year was relatively modest at -0.87%.
- Intraperiod swings have been large, with some years showing deep drawdowns even as the final result ended positive, underscoring the need to respect downside risk.
- The pattern is long-biased, with a Trade Direction of long and a Sharpe ratio of 1.32, pointing to historically strong risk-adjusted returns in this Adobe Inc. trading window.
According to historical data from TradeWave.ai, this midterm-election stretch for Adobe Inc. has behaved very differently from an average year on the calendar. The next section walks through how that pattern has played out in prior cycles and what it means for the upcoming window.
How has Adobe Inc. (ADBE) traded in past midterm-year windows starting in late June?
Adobe Inc. has risen in 8 of the last 9 midterm-election-year windows that start around Jun 30 and run for 264 trading days, posting a 21% average gain across all years. Shares finished Thursday at $197.45, down 4.8% on the day and 37.48% lower year to date, leaving the stock about 50.6% below its 52-week high of $399.67.[1]
The presidential election cycle matters here because this pattern only looks at midterm election years, a phase that often brings policy uncertainty, regulatory noise and shifting risk appetite before the historically stronger pre-election year. For a megacap software name like Adobe, that has meant a consistent tendency for the stock to grind higher across this specific midterm-year stretch even when the broader tape was choppy.
Historically, the trade direction for this Adobe Inc. seasonal trend is long. Percent Profitable is 89%, with 8 winners and just 1 loser across the last 9 midterm election years, and the all-years average gain of 21% shows that the lone down year did not erase the strong upside in the others. The median outcome sits at 23.65%, which lines up closely with the 24.24% average profit in winning years and suggests that the typical positive cycle has delivered a mid‑20s return rather than being skewed by one outlier.
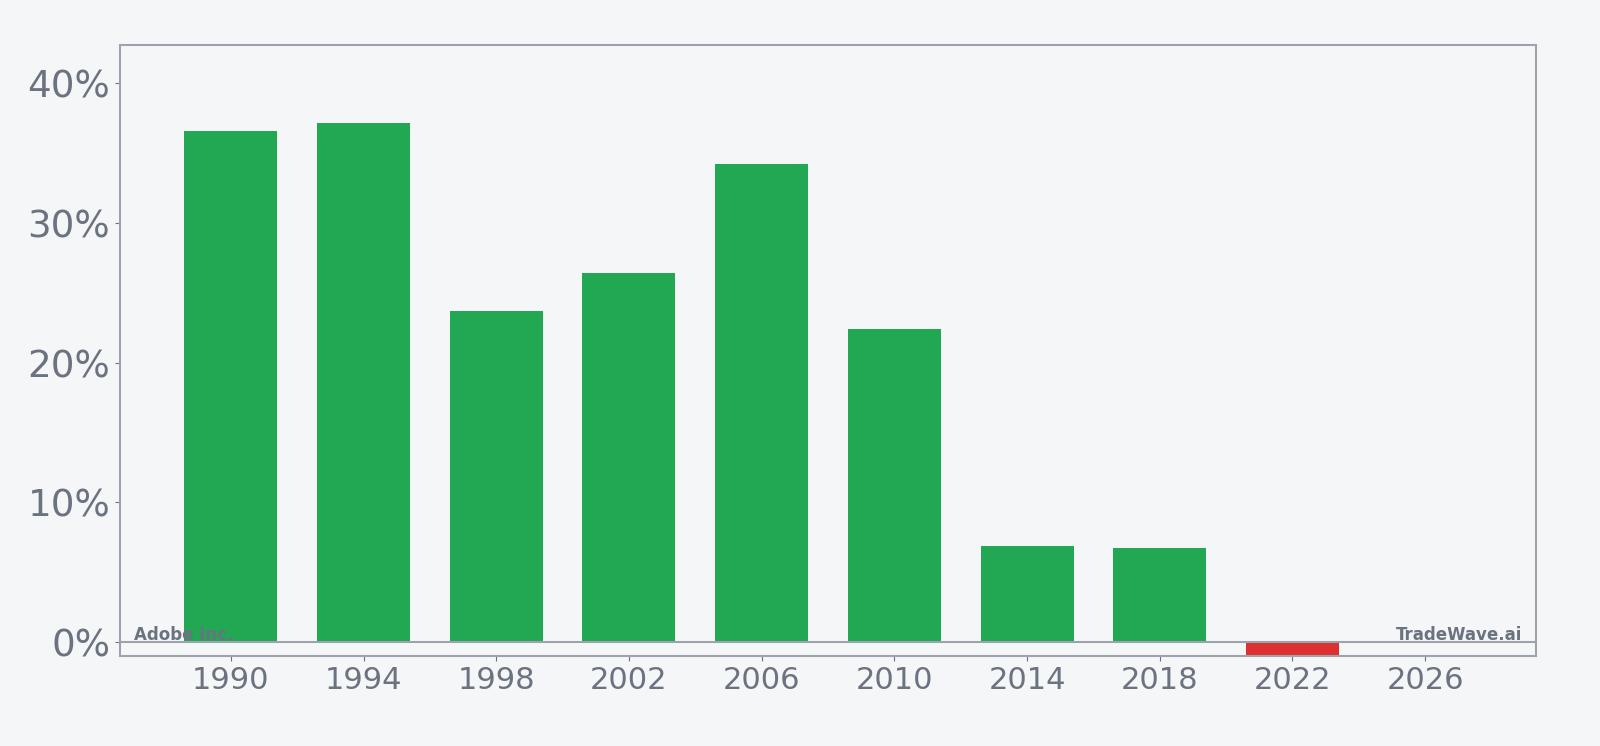
The per-year table shows how that has played out in practice. Strong years like 1994 and 2006 delivered net returns of 37.13% and 34.19% respectively, while even softer cycles such as 2014 and 2018 still finished up 6.91% and 6.77%. The only losing instance in 2022 saw Adobe slip just 0.87% over the full window, a relatively small decline compared with the double‑digit gains in most other midterm-year runs.
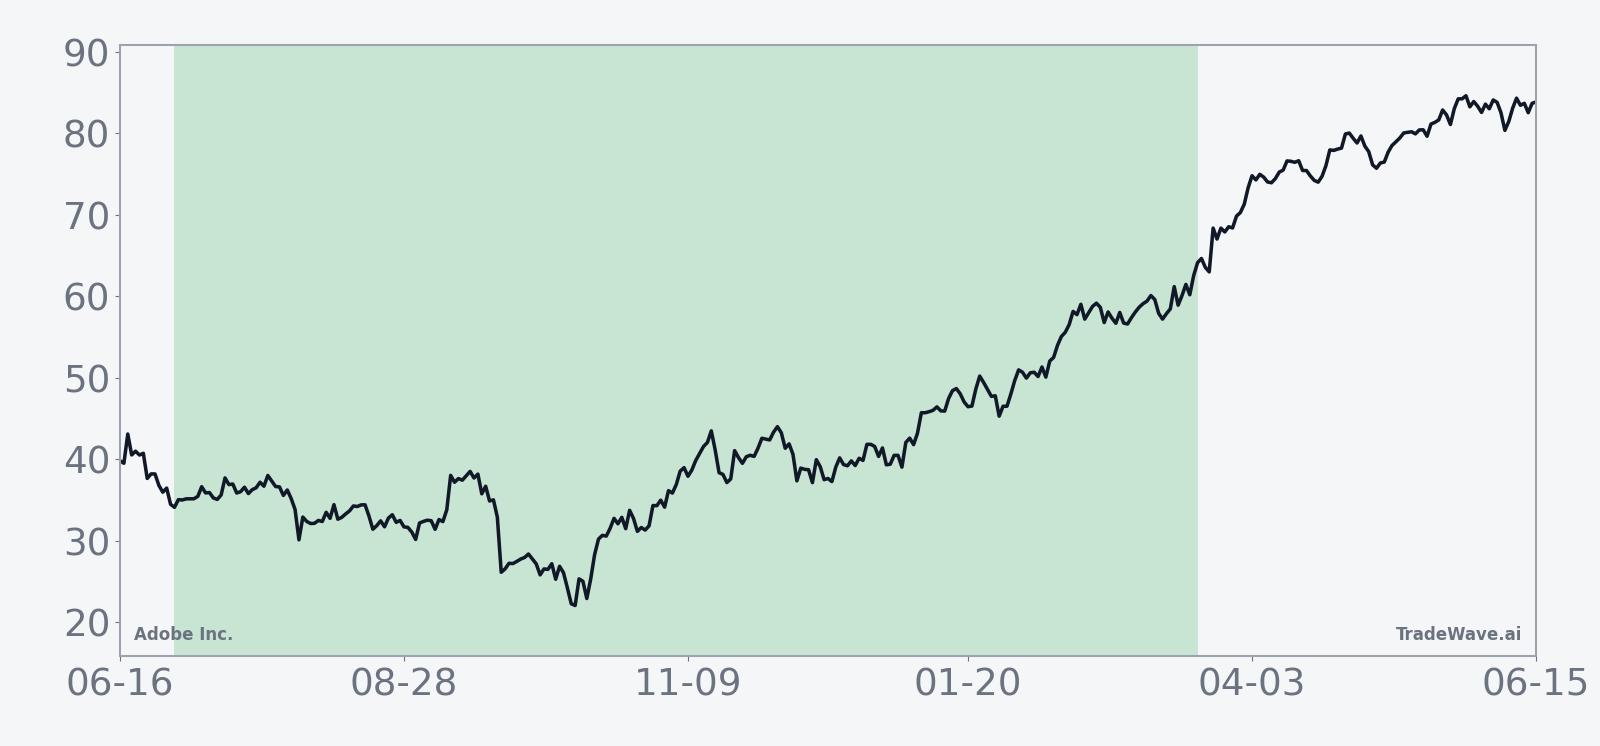
The historical seasonal average suggests that gains tend to accrue steadily rather than in a single burst. In several cycles, the strongest part of the move has come after the first few months of the window, which fits with the broader pattern of midterm-year volatility giving way to a more constructive backdrop as policy uncertainty clears and investors look ahead to the pre-election year.
The next view combines yearly net results with the best and worst intraperiod swings to show how far Adobe has tended to travel inside the window.
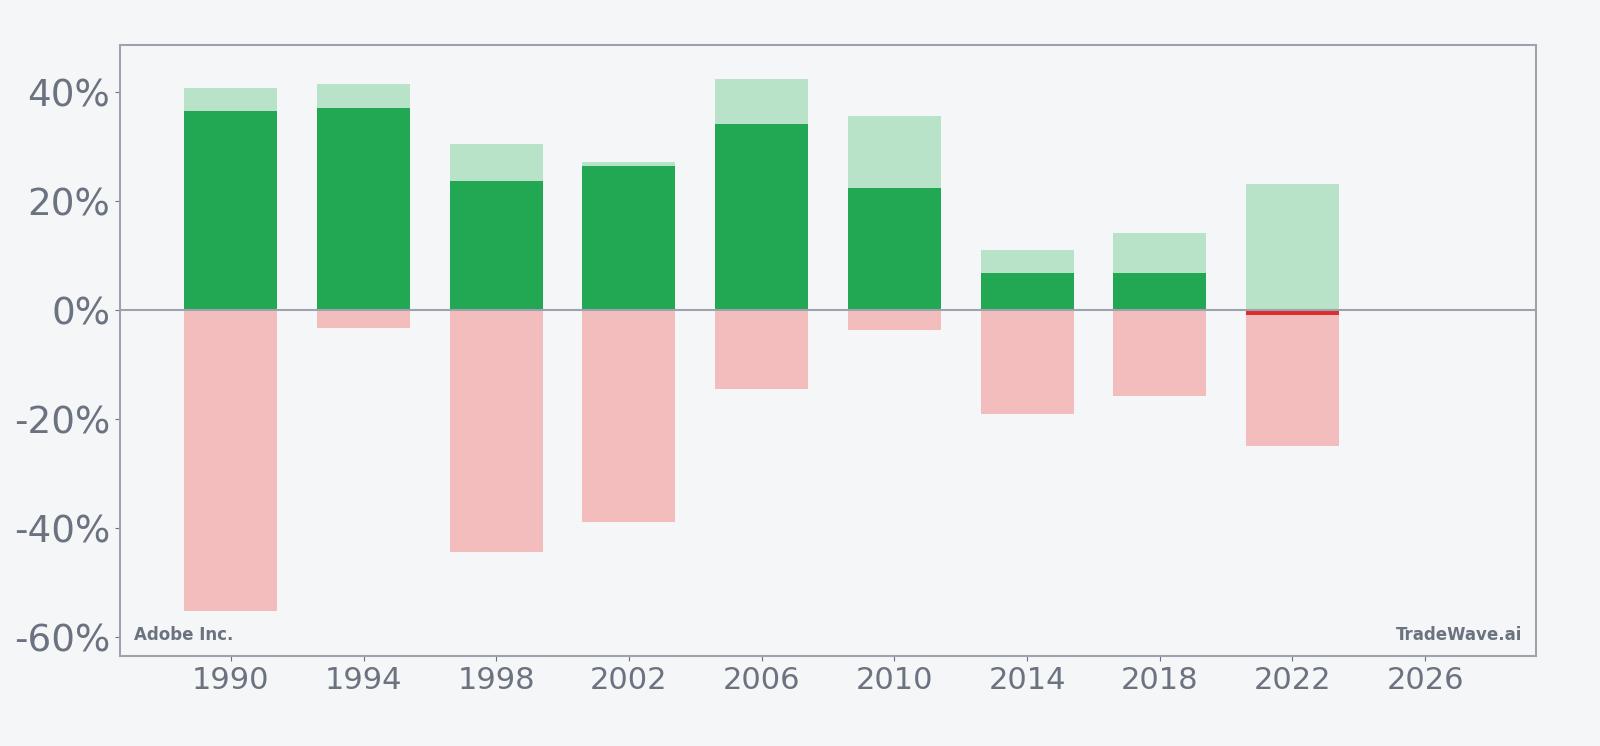
The MFE and MAE profile shows that even winning years have not been smooth. In 1990 and 1998, for example, Adobe ultimately finished the window up 36.55% and 23.65%, but at some point during those stretches the stock was down as much as 55.26% and 44.31% from the entry level. Other years such as 1994 and 2010 saw much shallower worst drawdowns of around 3% to 4%, paired with strong maximum favorable moves above 30%, illustrating that this window has alternated between grind‑higher behavior and more violent shakeouts before recovering.
History does not guarantee future results; adverse excursions (MAE) can be large even in winning windows.
Why does Adobe Inc. (ADBE) follow this seasonal pattern?
One likely driver is the way Adobe’s fiscal calendar and product cycle line up with the broader presidential election cycle. Midterm years often bring bouts of volatility early on, followed by a friendlier backdrop as policy paths become clearer and corporate IT budgets reset, which can support design and marketing software spending. Analysts have also pointed to institutional portfolio repositioning into quality growth names ahead of the historically strong pre-election year, a flow that may help explain why this Adobe Inc. seasonal trend has been so consistently positive in past midterm cycles.
What is driving Adobe Inc. (ADBE) today?
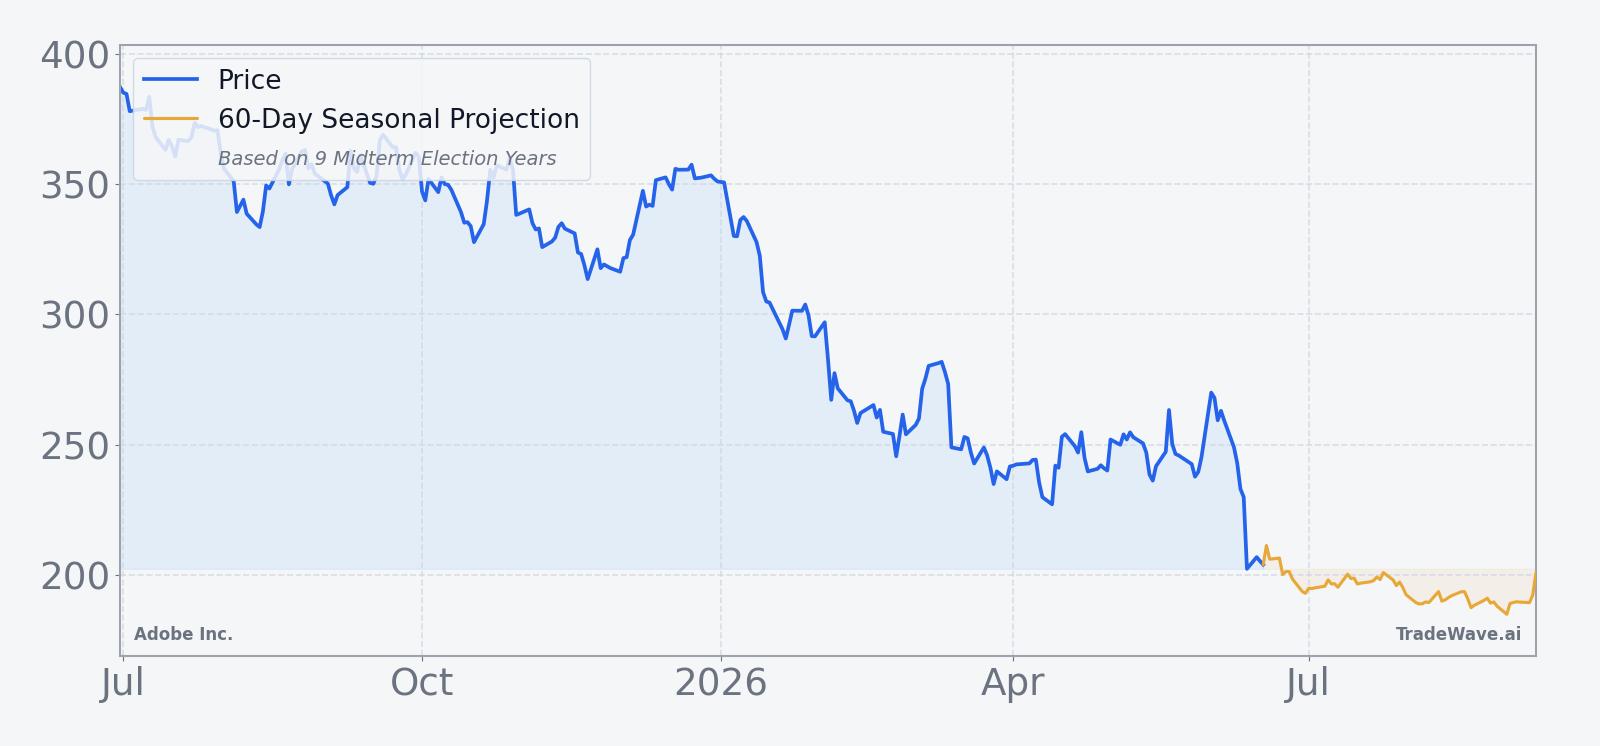
Adobe shares closed at $197.45 on Jun 18, down 4.8% on the day and 37.48% year to date, leaving the stock just above its 52-week low of $195.64 and far below the $399.67 high set earlier in the year.[1] The latest leg lower followed Q2 FY2026 results on Jun 11 that beat on revenue and earnings and came with a higher full-year outlook, but investors focused on unchanged annual recurring revenue growth guidance and a one-week drop of 15.33% as leadership changes, including the exit of CFO Dan Durn and the appointment of Steve Day as interim CFO, added uncertainty around the growth strategy.[1][2][3][4]
The chart below situates the latest move in its recent multi-month context alongside a short-term seasonal projection.
Fundamentally, Adobe is still leaning hard into generative AI, reporting that AI-first ARR has tripled year over year and that Firefly and other AI products have pushed AI-related ARR past $500 million, even as investors debate how quickly that momentum can offset slower legacy growth.[2][3][4] Sector commentary continues to flag competition from Figma, Canva and a wave of AI-native design tools as a key risk to Adobe’s long-term dominance, which helps explain why the stock’s sharp de-rating has persisted despite strong cash generation and raised guidance.[3][4]
Against that backdrop, the upcoming seasonal window is notable because it collides with a period when macro and policy narratives often shift. Midterm election years can see regulatory headlines around data privacy, AI governance and digital advertising, all of which touch Adobe’s ecosystem, and any change in tone on those fronts could either reinforce or challenge the historical pattern of strength that has followed late June in prior cycles.
What should traders watch as this Adobe Inc. seasonal window approaches?
First, the calendar: the 264-day Adobe Inc. trading window tied to midterm election years begins on Jun 30 and runs deep into 2027, overlapping the transition into the pre-election year that has often been supportive for growth stocks. Traders will be watching whether the stock can stabilize above the recent 52-week low near $195.64 or whether another break lower resets the starting point for this cycle.[1]
Second, earnings and guidance: with Q2 FY2026 in the rearview mirror, the next update on ARR growth, AI-first ARR and Firefly monetization will be critical in determining whether the market continues to discount Adobe’s long-term story or begins to re-rate the name closer to the fundamentals that drove the recent beat and raised outlook.[1][2][3][4] Any shift in management tone on AI adoption, competitive pressure or pricing power during this window would either reinforce the historical pattern of strong midterm-year performance or mark a break from it.
Third, macro and policy: as the midterm election year progresses, investors will track developments around AI regulation, digital content rights and enterprise software budgets, all of which can influence sentiment toward design and marketing software providers. If risk appetite improves into the pre-election year as it has in past cycles, Adobe’s long-biased seasonal trend could again align with a broader tech rebound; if policy or macro shocks keep volatility elevated, the large MAE readings seen in some prior windows are a reminder that even historically strong patterns can involve deep drawdowns along the way.
Finally, price behavior inside the window will be the real test. History says this midterm-year stretch has usually rewarded long exposure in Adobe Inc., but the path has sometimes been rough, with big swings before the eventual outcome. How the stock trades around key support levels, reacts to the next earnings print and digests any new competitive headlines will show whether this cycle rhymes with the past or writes a different script.
Sources
- [1] Yahoo Finance: Adobe Beats Expectations and Raises Outlook, but Shares Fall on ARR Concerns (ADBE) (Jun 12, 2026).
- [2] Yahoo Finance (GuruFocus): Adobe Inc (ADBE) Q2 2026 Earnings Call Highlights (Jun 12, 2026).
- [3] Yahoo Finance (24/7 Wall St.): Adobe Stock Set for 46% Gain After Earnings Beat (Jun 15, 2026).
- [4] Reuters: Adobe raises annual forecasts, CFO exit fans uncertainty over growth strategy (Jun 11, 2026).
- [5] Forbes: Adobe Stock: High Cash, Higher Upside? (Jan 29, 2026).
About this seasonal analysis
Seasonal pattern data is sourced from TradeWave.ai, which analyzes historical price behavior across annual calendar windows going back up to 30 years. Read the full data methodology or the book The 100-Year Pattern by Afshin Moshrefi (2026 edition). Past performance of seasonal patterns does not guarantee future results. This article is for informational purposes only and does not constitute investment advice.