Oracle Corporation (ORCL) Has Rallied in 8 of 8 Midterm Windows Starting Jun 20
Oracle Corporation is approaching a 328-day midterm-election-year seasonal window that has never been negative in the last eight cycles, just as shares trade near record highs and options activity stays elevated.

What is the seasonal pattern for Oracle Corporation (ORCL)?
Oracle Corporation has risen in 8 of 8 midterm-election-year windows starting around Jun 20, with an average gain of 37.43% in winning years.
- 8 for 8 in this window, with Oracle Corporation averaging 37.43% gains across all winning years.
- Seasonal window begins Jun 20 and runs for 328 trading days, covering the back half of the midterm election year into the following summer.
- Percent Profitable is 100%, with 8 winners and 0 losers across the last eight midterm-election-year cycles.
- Median profit of 42.26% and cumulative return of 1,121% highlight how strong this ORCL seasonal trend has been.
- Maximum favorable moves have reached as high as 155.29% in a single year, while adverse excursions have still dipped more than 20% at times.
- Trade Direction is long, with a Sharpe ratio of 2.36 and a TradeWave Ratio of 1.24, pointing to historically strong risk-adjusted performance in this Oracle Corporation trading window.
According to historical data from TradeWave.ai, this upcoming stretch for Oracle has behaved very differently from an average year on the calendar. The next section walks through how that election-cycle pattern has played out in prior midterm years.
How has Oracle Corporation (ORCL) traded in this midterm-year seasonal window?
Oracle Corporation has risen in all eight midterm-election-year windows that start around Jun 20 and run for 328 trading days, averaging 37.43% gains with a 1,121% cumulative return across those cycles. Shares last closed at 183.25, down 2.7% on the day and sitting about 46.1% below their 52-week high of 340.33.[1] The combination of a clean 8-for-8 historical record and a stock that has already run hard into the AI and cloud narrative makes this next seasonal regime hard for traders to ignore.
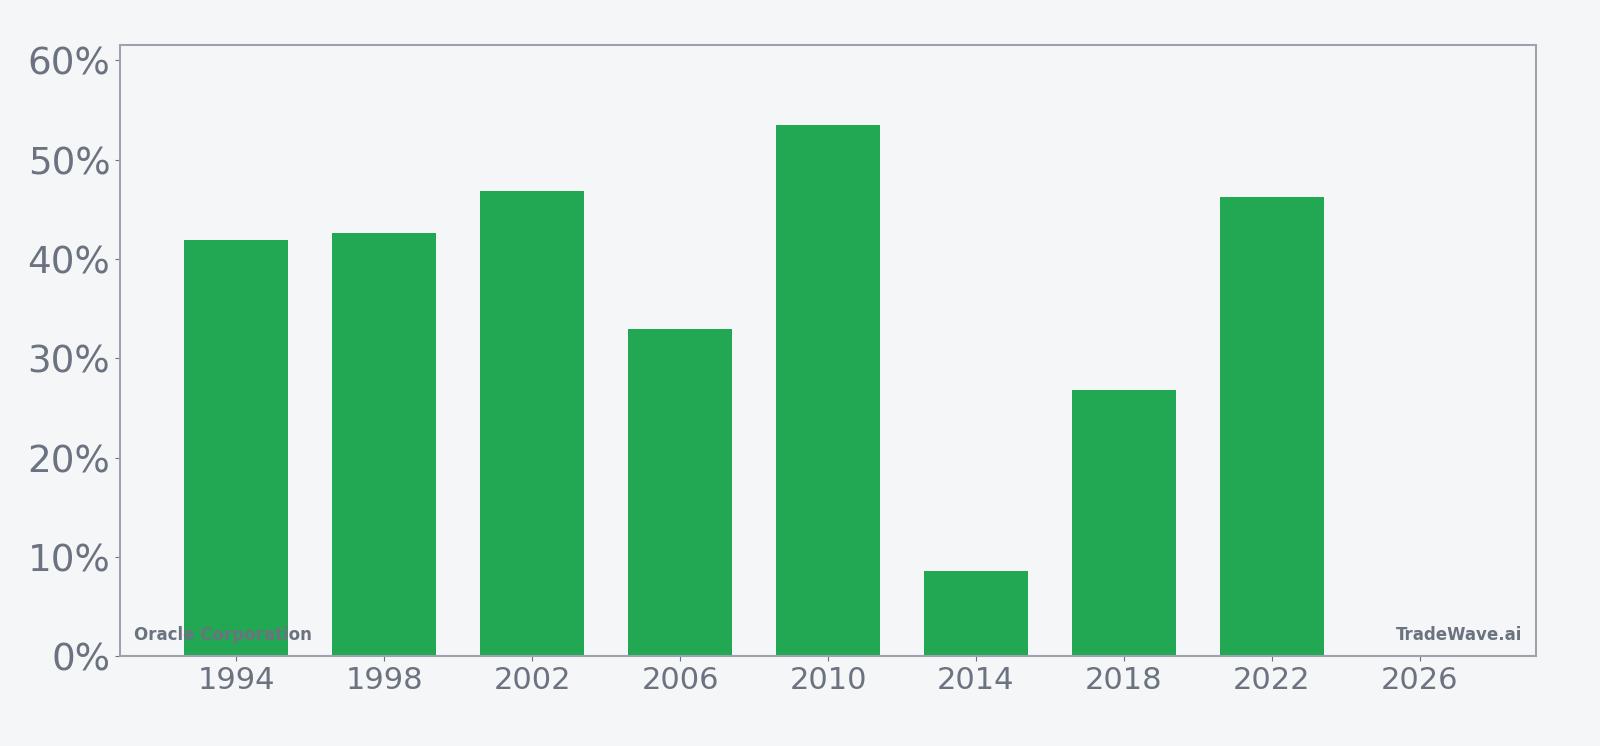
Grouping the data by the presidential election cycle matters here because this window always runs from the back half of a midterm election year into the following pre-election year, a phase that has often coincided with clearer policy visibility and stronger risk appetite in large-cap tech. For Oracle, the last eight midterm-election-year iterations of this 328-day stretch have all been positive, even when the broader market backdrop was choppy.
Across those eight cycles, the median profit for Oracle in this window is 42.26%, slightly above the average, which suggests the gains have not been driven by a single outlier year. The weakest outcome was still an 8.59% advance in 2014, while the strongest was a 53.53% gain in 2010. Add it up and the cumulative return across all eight windows is 1,121%, a striking record for a single recurring slice of the calendar.
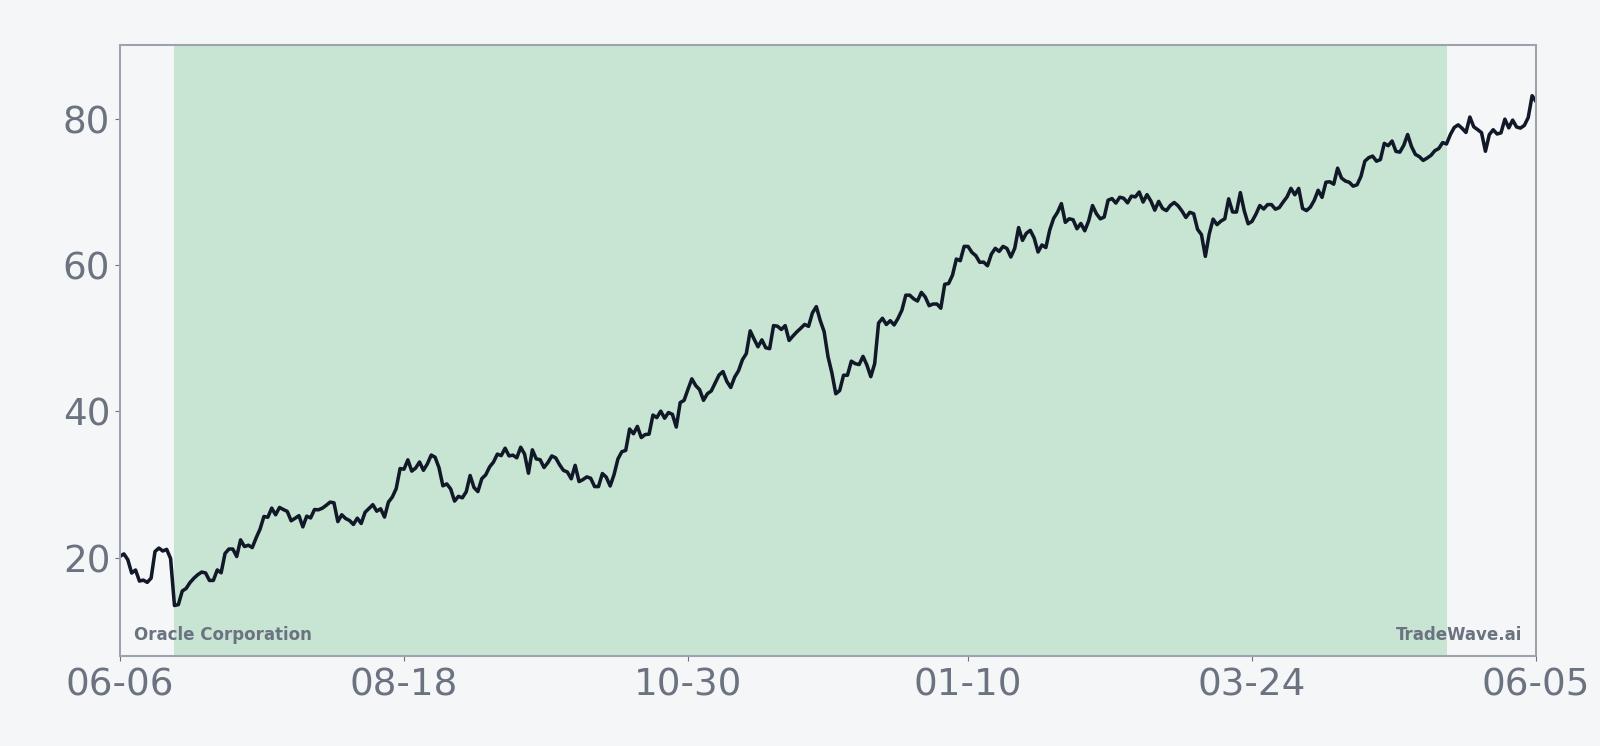
The historical seasonal trend line for this Oracle Corporation trading window slopes higher for most of the period, with only modest pauses, which fits a long-bias pattern rather than a volatile mean-reversion setup. Early in the window, returns have often started to build quickly, then continued to accrue into the following summer as the pre-election year gets underway.
A closer look at yearly net returns and intraperiod swings shows how much room ORCL has historically had to run and how deep the drawdowns have been along the way.
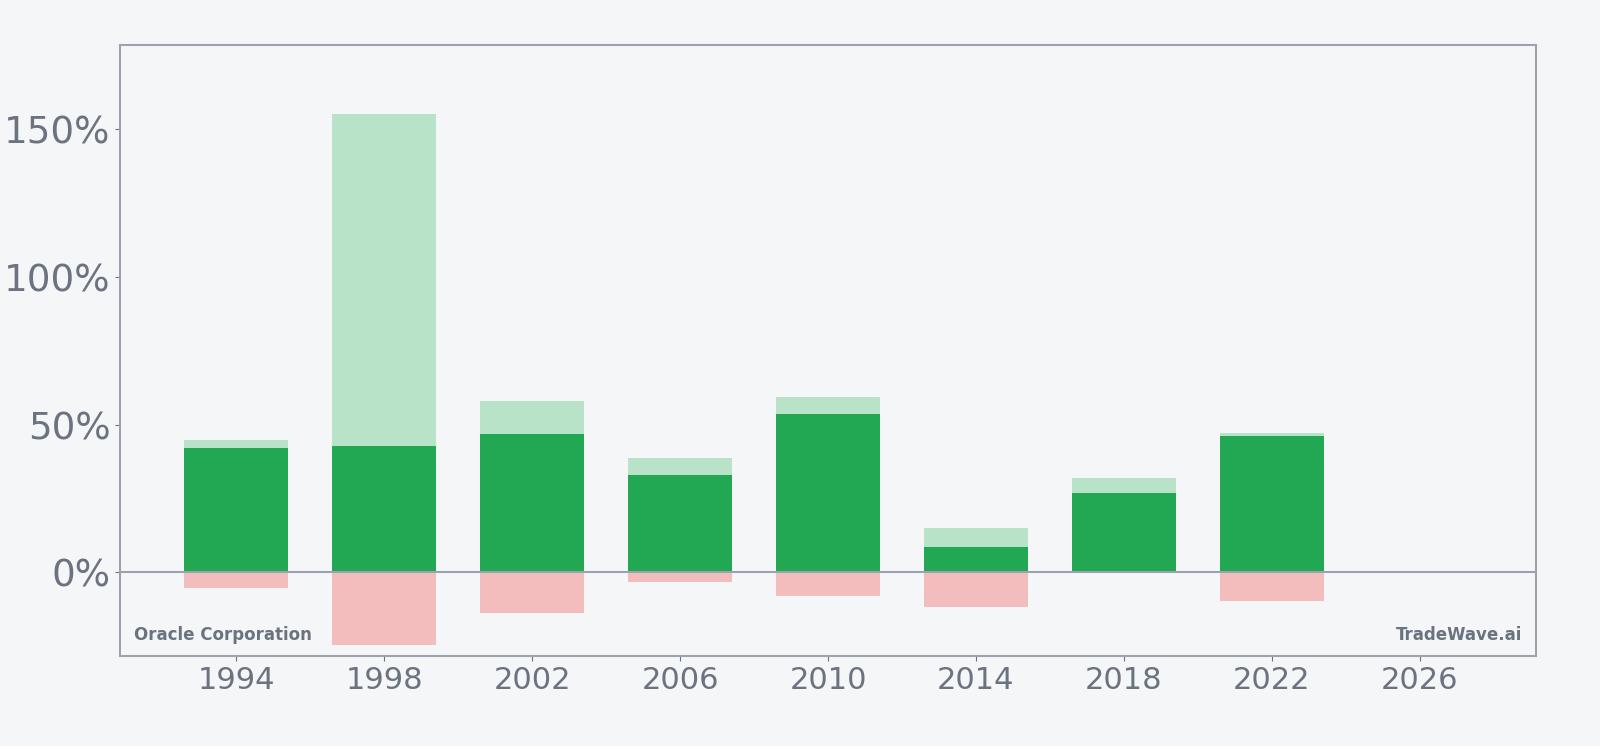
Maximum favorable moves in this window have been large, including a 155.29% peak run-up in 1998 and several years with peak gains above 50%, which lines up with the long Trade Direction and high TradeWave Ratio. At the same time, maximum adverse excursions have reached as deep as -24.81% in 1998 and around -13% to -12% in several other years, reminding traders that even a strong historical seasonality can involve sharp pullbacks before the window closes higher.
History does not guarantee future results; adverse excursions can be large even in winning windows, so traders using this pattern still need to manage risk around drawdowns.
Why does Oracle Corporation (ORCL) follow this seasonal pattern?
One likely driver is the way Oracle’s fiscal calendar and big cloud and AI spending updates tend to cluster around the midterm and pre-election years, when policy visibility and enterprise IT budgets often improve. Analysts have also pointed to institutional portfolio repositioning into large-cap tech during pre-election years, which can favor names like Oracle that are tied to AI infrastructure and cloud growth.[5] This pattern may also reflect broader sector rotation into software and cloud as investors look past midterm uncertainty and toward the next phase of the economic and policy cycle.
What is driving Oracle Corporation (ORCL) today?
Oracle closed at 183.25 on Jun 18, down 2.7% on the day, with the stock still well below its 52-week high after a powerful run tied to AI and cloud enthusiasm.[1] The latest move comes in the wake of mixed fiscal fourth-quarter results on Jun 10, where investors weighed strong cloud momentum against questions about software growth and heavy AI infrastructure spending.[5] Ahead of that report, options pricing implied an 11.04% post-earnings move based on the at-the-money straddle, and trading desks flagged unusually heavy put activity and robust overall options volume, underscoring how crowded and tactical positioning around Oracle has become.[1]
In March, Oracle’s fiscal third-quarter report delivered a clean beat on revenue and earnings and included a raised 2027 revenue outlook to $90 billion, which helped cement the stock’s role as a key AI infrastructure and cloud proxy even as skeptics focused on valuation and capex intensity.[3] More recent coverage of the fiscal fourth quarter has highlighted the same tension: cloud revenue growth remains strong, but the market is debating how much of that upside is already priced in given the company’s massive data center investments and the broader AI infrastructure spending cycle.[5] Against that backdrop, the upcoming midterm-year seasonal window adds another layer for traders trying to balance near-term volatility with longer-term historical tendencies in ORCL’s stock pattern analysis.
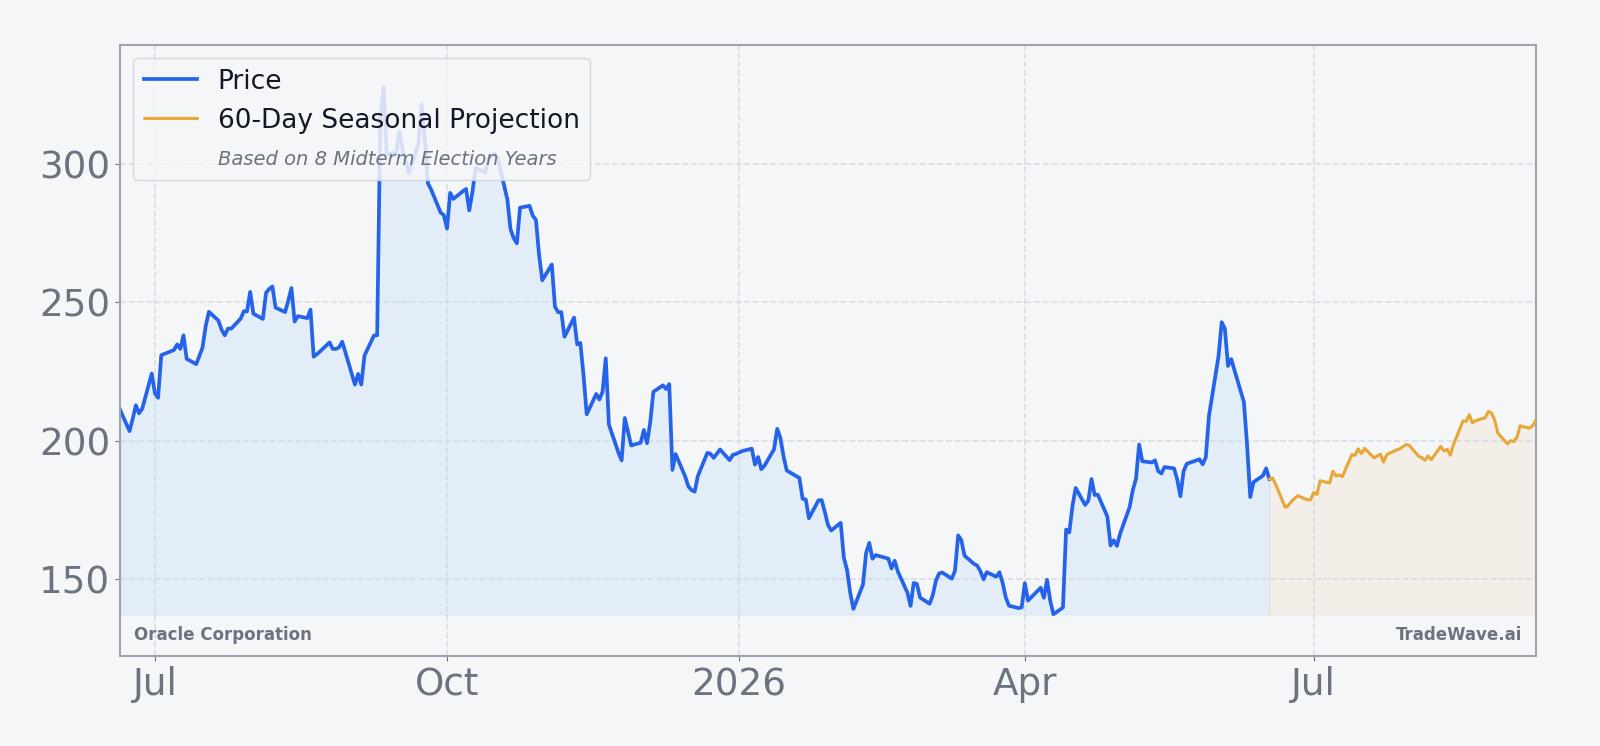
The chart below shows Oracle’s recent price path alongside a short-term seasonal projection, putting the latest pullback in context.
What should traders watch as this Oracle seasonal window opens?
First, the calendar: the 328-day midterm-election-year window begins on Jun 20, so any sustained move from here will unfold inside a slice of history that has been 8 for 8 on the upside. Traders will be watching whether Oracle can hold above the mid-180s and then build a base that resembles prior cycles where gains tended to compound into the following pre-election year.
Second, volatility and drawdowns: past windows have included intraperiod drops of 10% to 25% even in winning years, so how Oracle behaves on sharp down days will matter as much as the eventual direction. A pattern where pullbacks are bought and the stock quickly recovers would rhyme with the historical MFE and MAE profile; a break that fails to bounce would be an early sign that this cycle might diverge from the usual ORCL seasonal trend.
Third, options and positioning: the recent 11.04% implied move around earnings and heavy put trading show that derivatives markets are already a major driver of short-term swings.[1] If options volume and skew stay elevated as the seasonal window progresses, it would suggest that tactical traders are leaning into the pattern and using options to express views on AI infrastructure spending, while a sharp drop-off in activity could signal fading conviction in both the macro story and the historical seasonality.
Finally, the macro and policy calendar: as the midterm election year moves toward its back half and investors start to focus on the coming pre-election year, any shifts in AI regulation, cloud spending by large enterprises, or fiscal policy could either reinforce or challenge the historical pattern that has favored Oracle in this phase.[5] For traders tracking this specific Oracle Corporation trading window, the key tell will be whether the stock can convert that backdrop into another year that keeps the 8-for-8 streak alive.
Sources
- [1] Barchart, "Ahead of Oracle Earnings, Here's What Barchart Data Says Comes Next for ORCL Stock" (Jun 8, 2026).
- [2] Forbes, "How Oracle's Earnings Impacts Its 2026 Forecast" (Mar 11, 2026).
- [3] Yahoo Finance, "Oracle stock rockets higher on Q3 earnings beat, 2027 revenue outlook" (Mar 11, 2026).
- [4] Forbes, "Oracle Earnings: Shares Pop After Tech Giant Beats Revenue Expectations" (Mar 10, 2026).
- [5] Barron's, "Oracle Reports Earnings Amid a Rapid Cloud Transformation" (Jun 10, 2026).
- [6] Reuters, "Oracle rallies as strong revenue forecast eases concerns over massive AI bets" (Mar 11, 2026).
- [7] Financial Times, "Morgan Stanley thinks you should short Oracle" (Nov 27, 2025).
- [8] Seeking Alpha, "\"Big Short\" Michael Burry bets against Oracle (ORCL:NYSE)" (Jan 10, 2026).
About this seasonal analysis
Seasonal pattern data is sourced from TradeWave.ai, which analyzes historical price behavior across annual calendar windows going back up to 30 years. Read the full data methodology or the book The 100-Year Pattern by Afshin Moshrefi (2026 edition). Past performance of seasonal patterns does not guarantee future results. This article is for informational purposes only and does not constitute investment advice.