S&P 500 (SPX) Has Rallied in 10 of 10 Midterm-to-Pre-Election Runs, Averaging 12.85% Gains
The S&P 500 is nearing a 275-day midterm election year trading window that has never posted a loss in the last 10 cycles, even as the index hovers just below record territory and macro risks stay loud.

What is the seasonal pattern for S&P 500 (SPX)?
S&P 500 has risen in 10 of 10 midterm-to-pre-election year windows starting around Jul 23, with an average gain of 12.85% in winning years.
- 10-for-10 record in this 275-day window across the last 10 midterm election years, with average gains of 12.85% in winning years.
- Seasonal bias is bullish: Trade Direction is long, with 100% Percent Profitable, 10 Winners and 0 Losers in the sample.
- The upcoming window begins Jul 23, 2026 and runs roughly through late April 2027, bridging the midterm election year into the historically strong pre-election year.
- Individual years have ranged from about 4% to just over 21% net gains, showing upside consistency but varied paths along the way.
- Intraperiod swings have included double-digit drawdowns in some cycles, so even winning years have featured meaningful volatility.
- Sharpe ratio of 1.47 and a TradeWave Ratio of 1.63 point to a historically favorable risk-adjusted profile for long exposure in this specific S&P 500 trading window.
According to historical data from TradeWave.ai, this midterm-to-pre-election stretch has behaved very differently from an average year on the S&P 500 calendar, and the next iteration is less than two weeks away.
How has S&P 500 (SPX) traded in this midterm-to-pre-election window?
S&P 500 has not logged a single losing year in this 275-day midterm-to-pre-election window across the last 10 cycles, averaging 12.85% gains for long positions. The next window opens on Jul 23, 2026, with the index sitting about 10.3% below its 52-week high of 7,620.90 and roughly 10.2% above its 52-week low of 6,201.59. That combination of a strong historical seasonal trend and a market still within striking distance of record levels gives this upcoming regime unusual weight for portfolio builders.
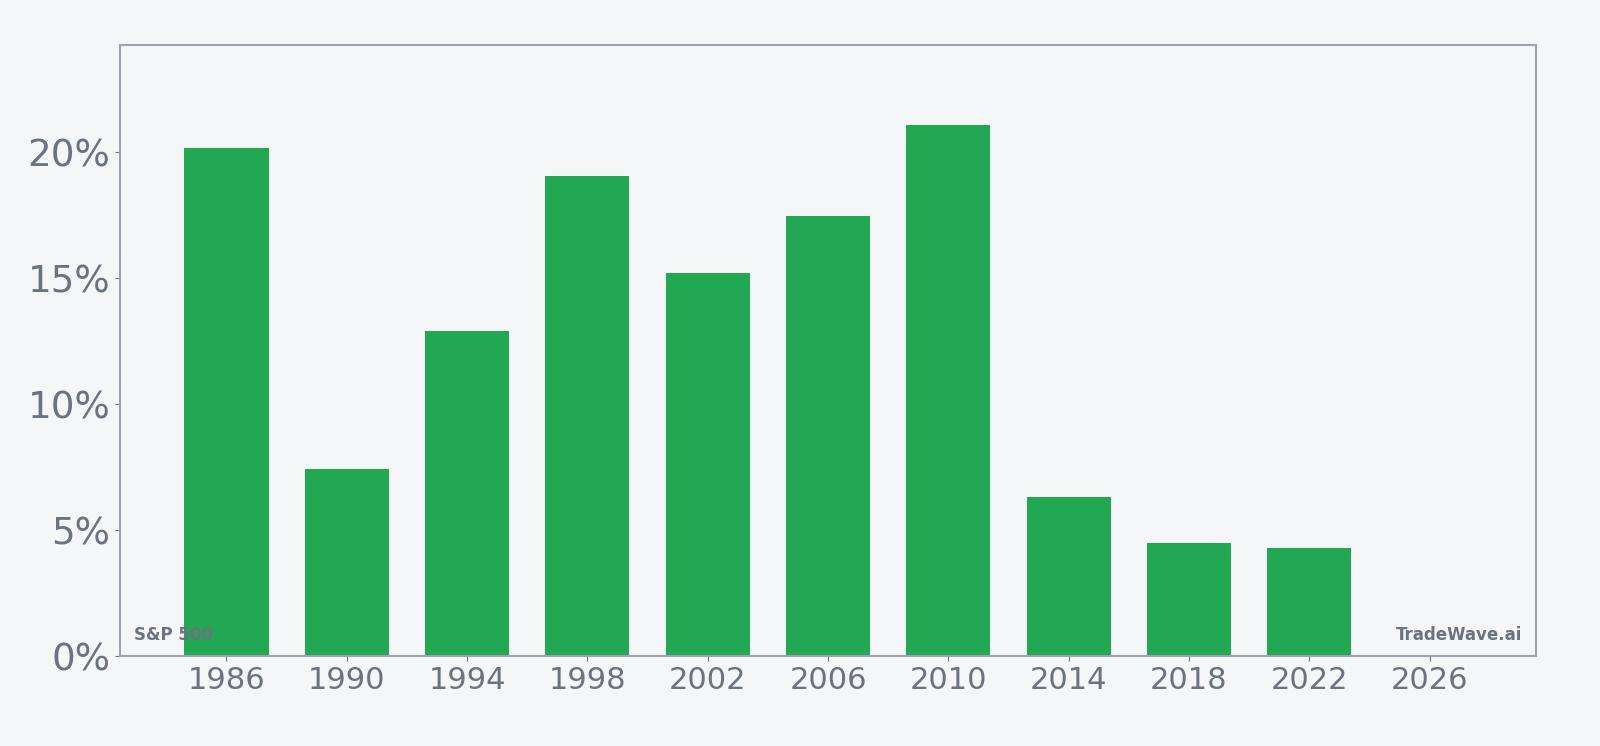
The presidential election cycle matters here because this window is defined specifically by midterm election years, then runs deep into the following pre-election year. Historically, that combination has lined up with a friendlier policy tone, more predictable fiscal settings and a tendency for risk assets to grind higher as Washington gridlock limits surprise legislation.
Across the 10 midterm election years in this sample, every single iteration of this S&P 500 trading window finished positive for a long stance. The strongest outcome came in 2010, with a 21.09% net gain from entry to exit, while the softest still delivered a 4.29% rise in 2022. Add it up and the cumulative return across all 10 cycles is 229%, with a 12.67% annualized pace that would look robust even in a classic bull market environment.
The path to those gains has not been smooth. In 1998, for example, the index ultimately gained 19.05% in the window, but at one point it was down 18.99% from the entry level before recovering. In 2018, a 4.51% net gain masked a worst intraperiod drawdown of 16.40%. Those episodes show how the maximum adverse move inside the window can be far larger than the final result, even in years that end up in the win column.
On the upside, several cycles saw the S&P 500 push well beyond the final net gain at some point during the window. The 1986 pattern delivered a 20.17% net return with a peak run-up of 27.23%, while 2002 posted a 15.21% gain after a maximum favorable move of 20.97%. That gap between the best intraperiod rally and the final close is what the TradeWave Ratio is designed to capture, and a reading of 1.63 signals that price has typically traveled meaningfully in the trade direction before the window ends.
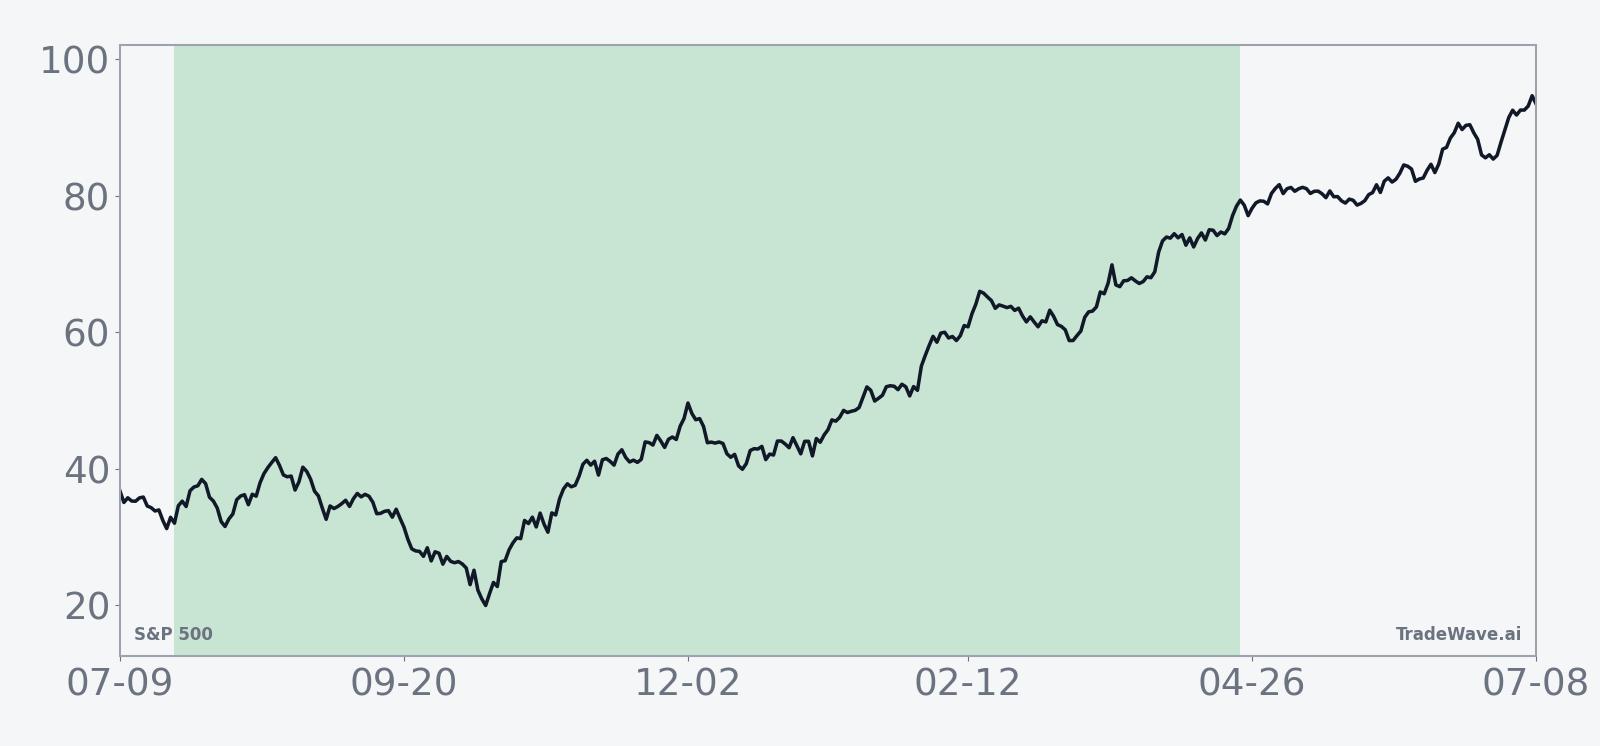
The historical seasonal trend chart for this window shows a relatively steady upward slope rather than a single explosive burst. Gains tend to accrue over the full 275 calendar days, with only brief pauses or shallow pullbacks in the average path. That fits the idea of a long midterm-to-pre-election “regime” where the index grinds higher as macro and policy noise gradually fades into the background.
A second view stacks net results with the best and worst intraperiod swings to show how far the index has tended to travel inside the window.
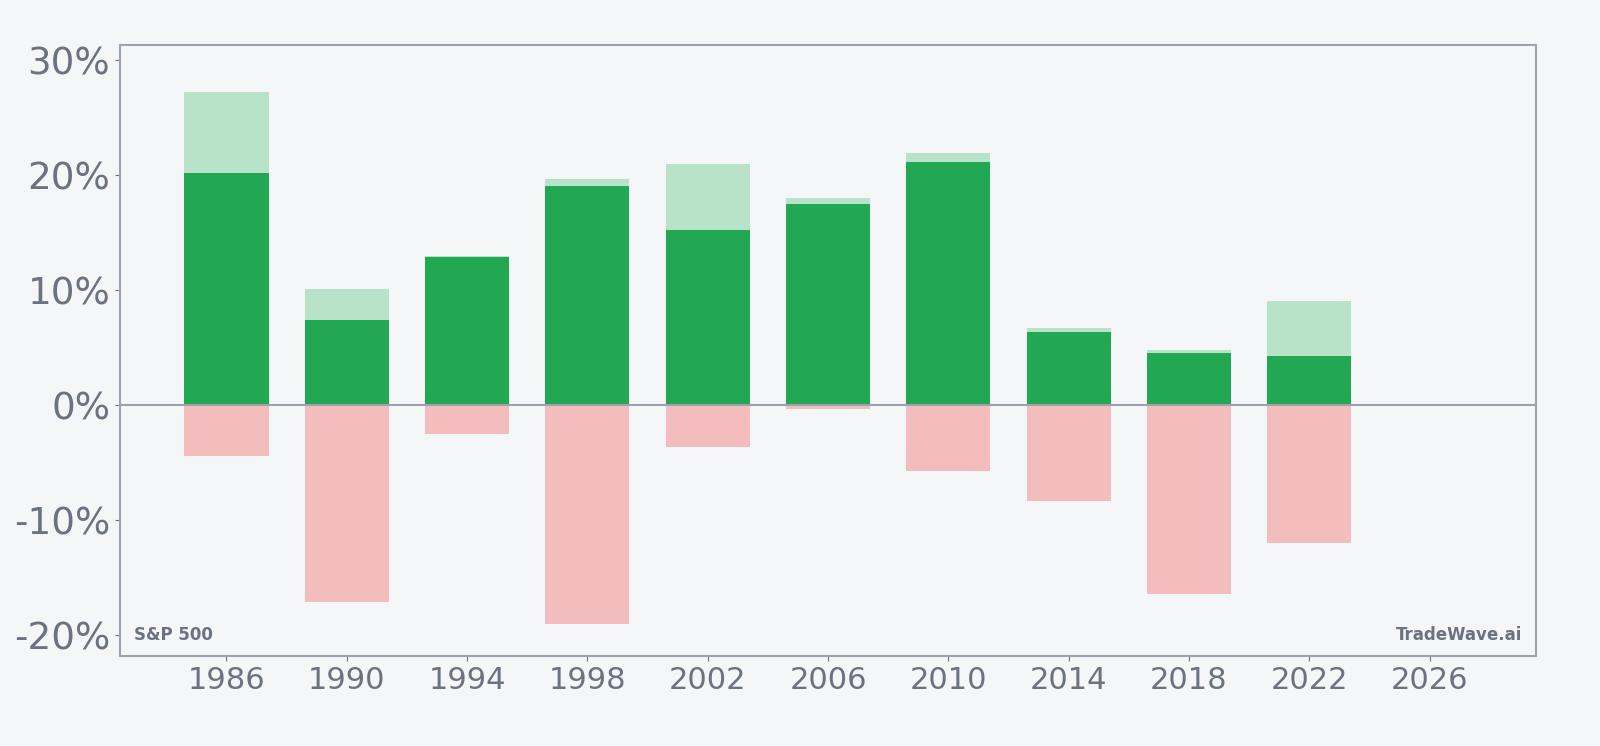
Viewed through that lens, the pattern looks like a high-conviction but still volatile bullish regime. Every bar ends above zero, yet several years show double-digit downside excursions before finishing higher, while others show sizable rallies that later gave back some ground. The key takeaway is simple: this window has historically favored long exposure in the S&P 500, but the ride has often included sharp swings in both directions.
History does not guarantee future results; adverse excursions can be large even in winning windows, and traders should treat this seasonal pattern as context rather than a forecast.
Why does S&P 500 (SPX) follow this seasonal pattern?
One likely driver is the way the policy calendar lines up around midterm elections, with uncertainty peaking earlier in the year and then fading as results lock in divided government and more predictable fiscal paths. Analysts have also pointed to institutional portfolio rebalancing and sector rotation as money shifts toward equities ahead of the historically strong pre-election year. This pattern may also reflect the earnings calendar, as companies guide more confidently once the mid-cycle policy picture is clearer, encouraging steady risk-on behavior across the index.
What is driving S&P 500 (SPX) today?
The S&P 500 last closed at 6,836.17, edging up 0.05% in the prior session while holding between its 52-week low of 6,201.59 and high of 7,620.90. That leaves the index about 10.3% below its 52-week peak and roughly 10.2% above its 52-week floor, a wide band that reflects both the powerful run to all-time highs and the pullback that followed as technical signals turned more mixed.[1]
In April 2026, one widely followed technical analysis noted that the S&P 500 had pushed to new highs even as momentum indicators flashed fatigue, with leadership rotating from high-beta growth toward value and yield plays.[1] The same work flagged the risk that war-related headlines, stubbornly strong jobs data and oil-driven inflation could inject more volatility into the index by complicating the Federal Reserve’s path to rate cuts.[2] Those macro crosscurrents remain central to how traders frame any upcoming seasonal tailwind.
Rate expectations are still the main macro hinge. A backdrop where the Fed can ease without reigniting inflation has historically been friendly to equities, but strong labor prints or renewed energy price spikes could delay that script and pressure valuations.[2] Sector-wise, flows have swung between mega-cap technology, energy and more defensive value names, with some reports highlighting intermittent rotation into foreign equities as investors look for diversification away from crowded U.S. growth trades.[3] Against that shifting leadership, the S&P 500’s broad-based seasonal pattern takes on added importance as a potential anchor for index-level positioning.
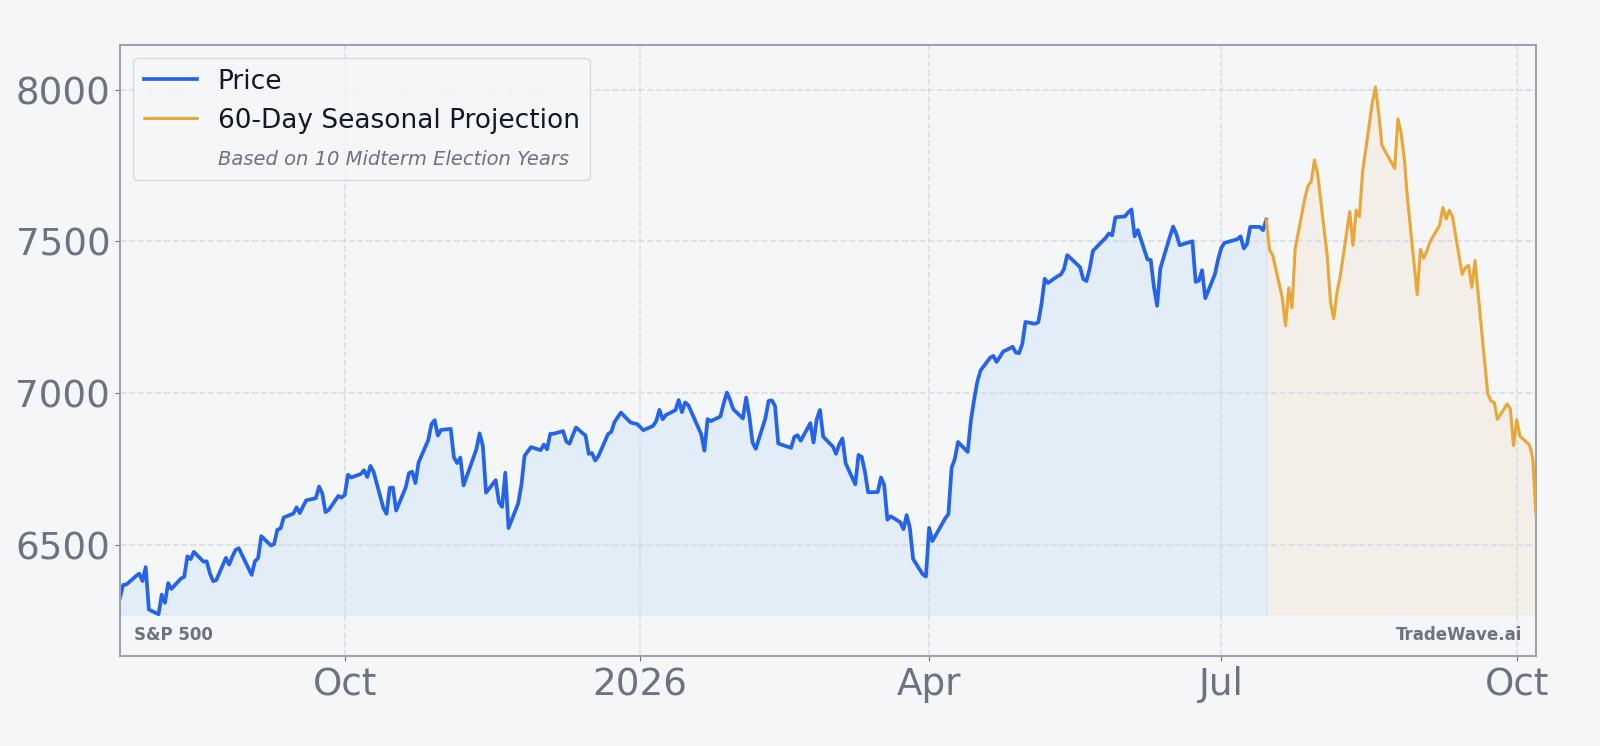
The chart below situates the latest move in its recent multi-month context and overlays a short-term seasonal projection.
What should traders watch as this S&P 500 seasonal window approaches?
First, the calendar. The new 275-day window begins on Jul 23, 2026, so the next two weeks are about preparation rather than reaction. Traders will be watching whether the index stabilizes above its recent lows and starts to build a base, or whether macro shocks drag SPX closer to the lower end of its 52-week range before the seasonal regime even starts.
Second, the policy and data tape. Upcoming inflation prints, labor-market reports and any fresh guidance from the Federal Reserve will shape how much room equities have to run if the historical midterm-to-pre-election pattern reasserts itself.[2] A backdrop of gradually easing inflation and credible rate-cut prospects would rhyme with prior strong cycles, while a renewed inflation scare or hawkish pivot would be a clear test of the pattern’s resilience.
Third, leadership inside the index. Prior midterm-to-pre-election windows have often seen a broadening of participation beyond a handful of mega-cap growth names, with value, industrials and cyclicals contributing more to index-level gains.[3] If the next window opens and only a narrow slice of tech is working, that would be a subtle warning that the historical “all-boats-lifted” behavior may be weaker this time.
Finally, volatility itself will be a tell. The historical record shows that even winning years have included double-digit drawdowns inside the window, so traders will be monitoring whether early pullbacks stay within that historical band or break meaningfully below it. If SPX sells off hard into the start of the window but then snaps back in line with the typical seasonal trend, that would fit the pattern. A sustained breakdown that fails to recover would be the clearest sign that this cycle is diverging from the last 10.
Sources
About this seasonal analysis
Seasonal pattern data is sourced from TradeWave.ai, which analyzes historical price behavior across annual calendar windows going back up to 30 years. Read the full data methodology or the book The 100-Year Pattern by Afshin Moshrefi (2026 edition). Past performance of seasonal patterns does not guarantee future results. This article is for informational purposes only and does not constitute investment advice.