CBOE Volatility Index (VIX) Has Dropped in 7 of 8 Midterm Windows Starting Aug. 1
CBOE Volatility Index is trading in the mid-teens ahead of an August seasonal window that has usually seen implied volatility grind lower across midterm election years.
Price as of Jul 1, 2026: $16.59 (last close).

What is the seasonal pattern for CBOE Volatility Index (VIX)?
CBOE Volatility Index has fallen in 7 of 8 midterm-year windows starting Aug. 1 and lasting 255 calendar days, with average gains of 19.05% in winning years for the short-volatility trade.
- 7 wins and 1 loss in this window, with the short-volatility side averaging 19.05% gains in winning years.
- The upcoming pattern runs from Aug. 1 for 255 calendar days across the last 8 midterm election years.
- Percent Profitable is 88%, with 7 winners and 1 loser for the short-volatility setup in this VIX seasonal window.
- Avg Profit in winning years is 19.05%, while Avg Profit - All, including the lone losing year, is still a strong 16%.
- Maximum favorable moves have reached as high as 175.29% intraperiod, while adverse excursions have stretched to -37.62%, underscoring sizable swings in both directions.
- A Sharpe ratio of 1.03 and a TradeWave Ratio of 2.31 point to a historically attractive but volatile short-volatility regime.
According to historical data from TradeWave.ai, this midterm-year stretch has behaved very differently from an average VIX year, with a distinct bias toward lower implied volatility once August begins.
How does CBOE Volatility Index (VIX) usually trade in this midterm-year window?
The seasonal window beginning Aug. 1 and running 255 calendar days has historically been a bearish stretch for VIX itself, favoring short-volatility positions in 7 of the last 8 midterm election years. Today the index closed at 16.59, leaving it well below its 52-week high of 35.30 and modestly above the 52-week low of 13.38, a zone where volatility sellers often start to debate how much further calm can extend.
Because this pattern is grouped by the presidential election cycle, it captures how volatility tends to behave in the heart of the midterm election year, when policy noise is high but actual legislative outcomes often stall. That combination has often coincided with equity markets grinding higher and implied volatility bleeding lower, even when headlines feel tense.
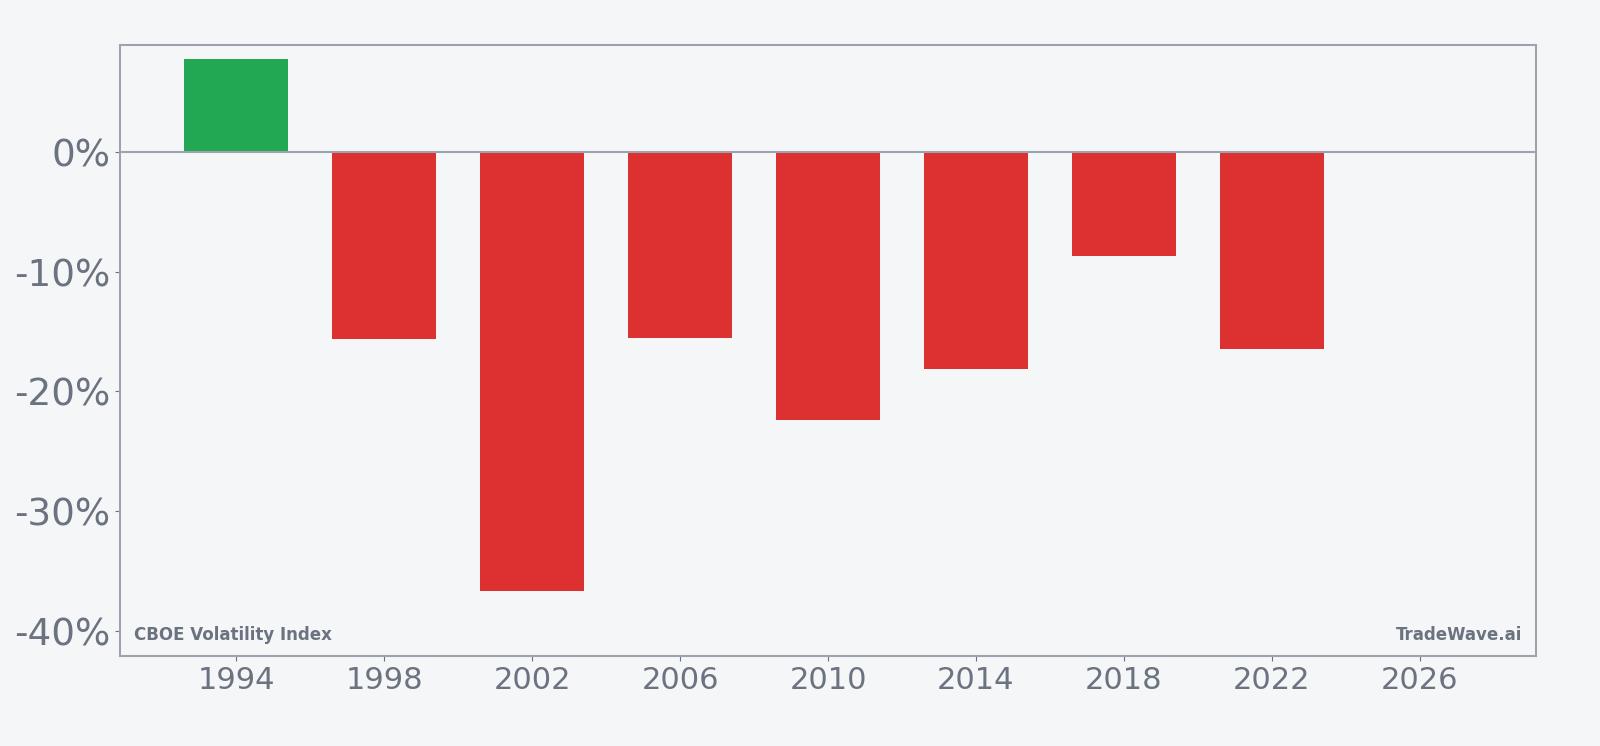
Across the last eight midterm election years in this window, the short-volatility side has been profitable 88% of the time, with 7 winners and just 1 loser. Average profit in winning years is 19.05%, while the all-years average, including the losing year, still comes in at 16%, which is unusually strong for a volatility pattern that spans most of a year.
The per-year table shows how that plays out in practice. In 2002, for example, VIX fell 36.64% from entry to exit, with the worst intraperiod drawdown for the short side reaching -37.62% before the trade finished solidly ahead. In 2018, the net return for the short-volatility stance was a more modest 8.67%, but the maximum favorable move inside the window reached 175.29%, reflecting how deeply volatility eventually collapsed from its entry level.
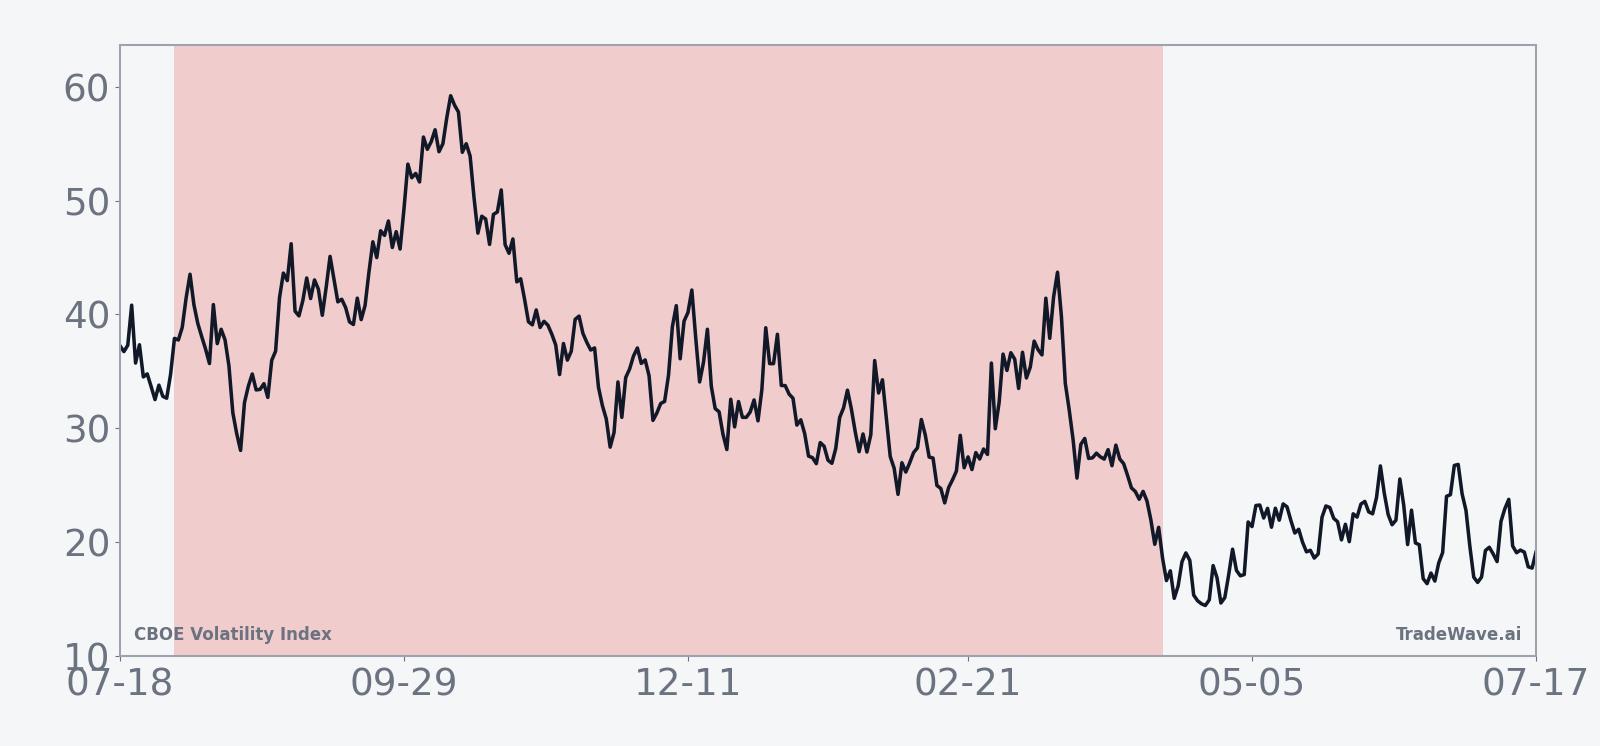
The historical seasonal trend chart suggests that, in many cycles, VIX tends to stay elevated or choppy early in the window before grinding lower as the midterm year gives way to the pre-election year. That fits the broader pattern of equities stabilizing after midyear policy scares, with implied volatility gradually leaking out of the system.
The combined net, best-case and worst-case moves by year show how powerful the swings inside this window can be, even when the final outcome favors the short side.
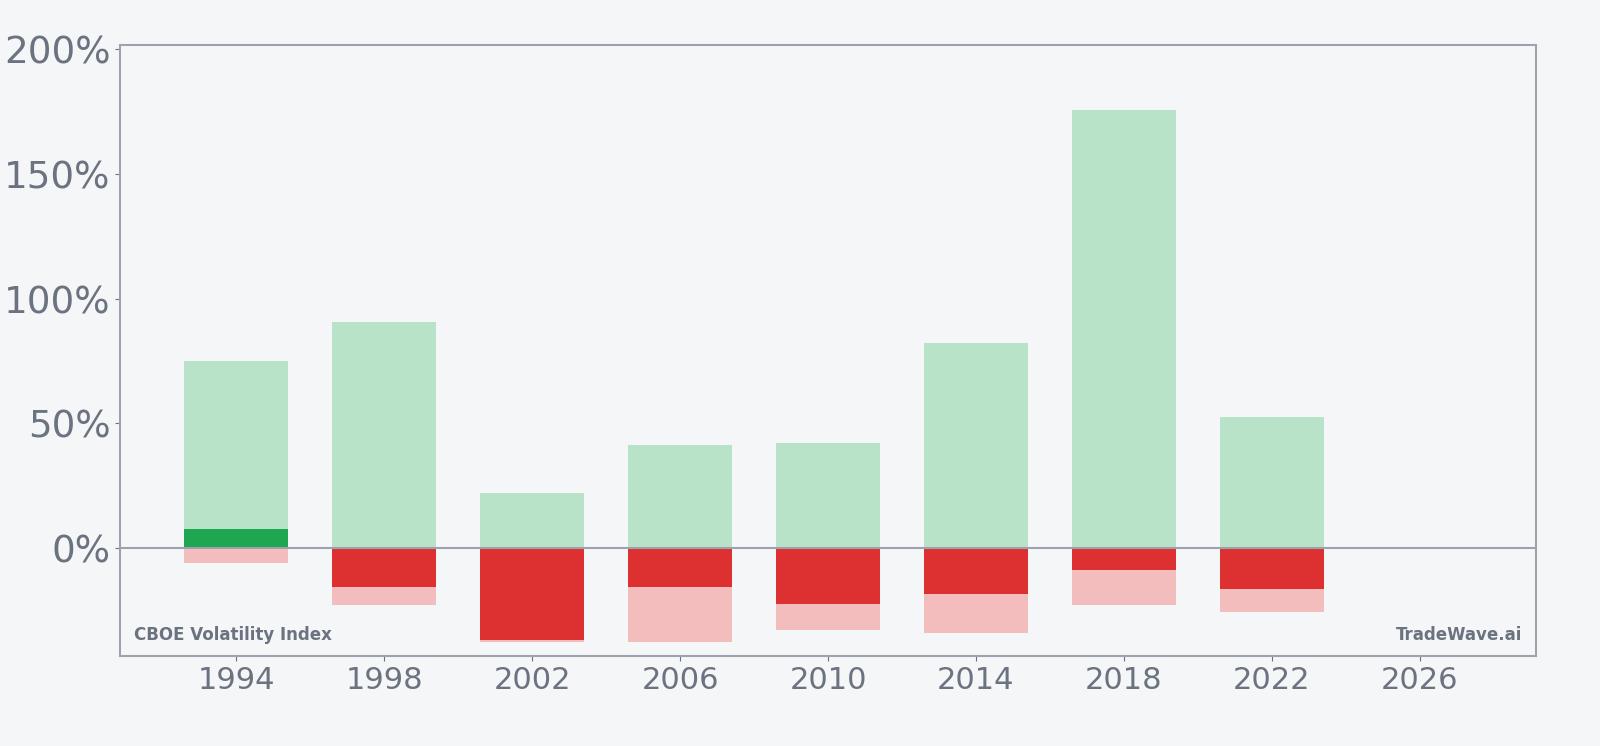
The bars with MFE and MAE make the trade-off clear. In strong years for the short-volatility pattern, VIX has often spiked sharply early in the window before rolling over, which shows up as large adverse excursions for shorts even when the final net is positive. The lone losing year, 1998, combined a 90.65% maximum favorable move for shorts with a -22.71% worst drawdown, and still finished with a 15.59% loss for the short side, a reminder that timing matters as much as direction in volatility trading.
History does not guarantee future results; adverse excursions (MAE) can be large even in winning windows.
Why does CBOE Volatility Index (VIX) follow this seasonal pattern?
One likely driver is the way the policy and earnings calendar clusters in midterm election years. Political noise tends to peak earlier in the year, while by late summer and into the following spring, investors have more clarity on fiscal and regulatory paths, which can support steadier equity markets and lower implied volatility. Analysts also point to systematic options-selling strategies and year-end portfolio rebalancing, which can reinforce a grind lower in VIX once the biggest macro shocks of the midterm year are behind the market.
What is driving CBOE Volatility Index (VIX) today?
CBOE Volatility Index ended the prior session at 16.59, up 0.14 points or 0.85% on the day, after trading between 15.97 and 17.30. That leaves VIX about 53.0% below its 52-week high of 35.30 and roughly 24.0% above its 52-week low of 13.38, a middle-of-the-range level that reflects neither outright complacency nor crisis pricing in equity options.
Recent macro shocks have shown how quickly that balance can change. In March 2026, a flare-up in Middle East conflict pushed VIX to 23.42 as investors scrambled for downside protection, a reminder that geopolitical risk can override calm seasonal tendencies when headlines escalate.[1] Earlier episodes tied to U.S.-China trade tensions and Federal Reserve uncertainty in 2025 produced similar spikes, with volatility jumping to multi-month highs before easing back as policy paths became clearer.[2][3] The pattern is familiar: when equity markets wobble on macro news, implied volatility jumps first and asks questions later.
The chart below situates the latest move in its recent multi-month context alongside a short-term seasonal projection.
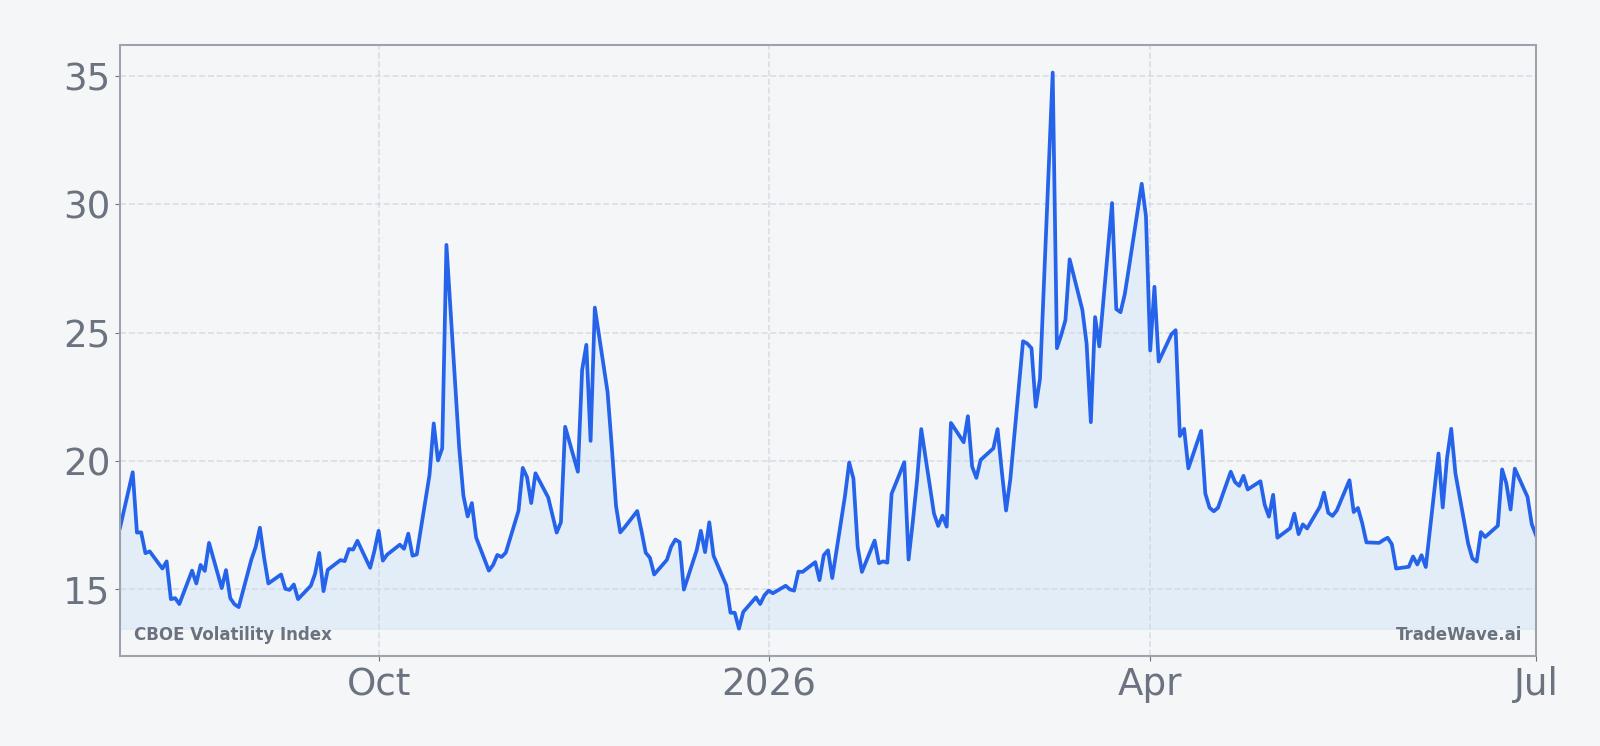
For equity traders, the takeaway is straightforward. VIX is sitting in the middle of its one-year range as the market approaches a midterm-year window that has historically rewarded short-volatility exposure, but the same history shows that intraperiod spikes can be violent. Calm stretches tied to policy gridlock and steady earnings have often been punctuated by sharp, news-driven jumps in implied volatility, especially around geopolitical shocks and surprise shifts in the Federal Reserve narrative.[1][3]
What should traders watch as this VIX seasonal window approaches?
First, the calendar. The upcoming August start date means this window will run deep into the pre-election year, a phase that has often been friendlier to risk assets as fiscal and regulatory paths become clearer. If equities hold their footing into late summer and macro shocks stay contained, the historical pattern of VIX grinding lower would be consistent with that backdrop.
Second, levels. On the upside, the 20–25 zone has repeatedly marked stress episodes in the past two years; a sustained break above that band during the window would contradict the typical short-volatility bias and signal that macro risk is overwhelming seasonality.[1] On the downside, traders will watch whether VIX can revisit or undercut the 13–14 area that has defined the recent floor, which would align with prior midterm-year windows where implied volatility bled toward cycle lows.
Third, catalysts. Key checkpoints include any escalation in geopolitical tensions, fresh surprises from the Federal Reserve, and inflection points in U.S.-China relations, all of which have triggered abrupt VIX spikes in prior years.[1][2][3] If those shocks stay muted, the historical midterm-year seasonal trend argues for a bias toward lower volatility over the bulk of the 255-day window, albeit with the understanding that intraperiod MFE and MAE swings have been large enough to punish traders who ignore risk management.
Sources
About this seasonal analysis
Seasonal pattern data is sourced from TradeWave.ai, which analyzes historical price behavior across annual calendar windows going back up to 30 years. Read the full data methodology or the book The 100-Year Pattern by Afshin Moshrefi (2026 edition). Past performance of seasonal patterns does not guarantee future results. This article is for informational purposes only and does not constitute investment advice.