Nasdaq QQQ Invesco ETF (QQQ) Enters 348-Day Midterm Window With 6 of 6 Prior Gains
Nasdaq QQQ Invesco ETF is about to enter a 348-day midterm-election seasonal window that has never posted a loss in the last six cycles, giving traders a structured lens on tech-heavy index risk and opportunity into mid-2027.

What is the seasonal pattern for Nasdaq QQQ Invesco ETF (QQQ)?
Nasdaq QQQ Invesco ETF has risen in 6 of 6 midterm-election-year windows starting around Jul 11 and lasting 348 calendar days, with an average gain of 20.37% in winning years.
- 6 for 6 in this window, with winning years averaging 20.37% gains across the last six midterm election years.
- Seasonal window begins Jul 11, 2026 and runs for 348 calendar days, spanning the back half of the midterm year into the pre-election year.
- Percent Profitable is 100%, with 6 winners and 0 losers in the TradeWave sample.
- Annualized return across the window is 20.19%, with a Sharpe ratio of 2.33 on end-of-window outcomes.
- The TradeWave Ratio of 2.27 indicates that price has typically traveled meaningfully in the long direction within the window, not just at the close.
- Individual years have still seen sizable intraperiod drawdowns, including adverse moves of more than 18% before finishing higher.
According to historical data from TradeWave.ai, this upcoming stretch for QQQ behaves very differently from an average year, with a distinct midterm-to-pre-election profile that most investors never see quantified.
How has Nasdaq QQQ Invesco ETF (QQQ) traded in this midterm-year window?
Nasdaq QQQ Invesco ETF has posted gains in all six prior midterm-election-year windows that start around Jul 11 and run for 348 calendar days, averaging 20.37% in those winning years. The next iteration of that window opens on Jul 11, 2026, catching QQQ near the upper half of its 52-week range between roughly 545.82 and 747.00 even after a modest 0.43% pullback over the past month.
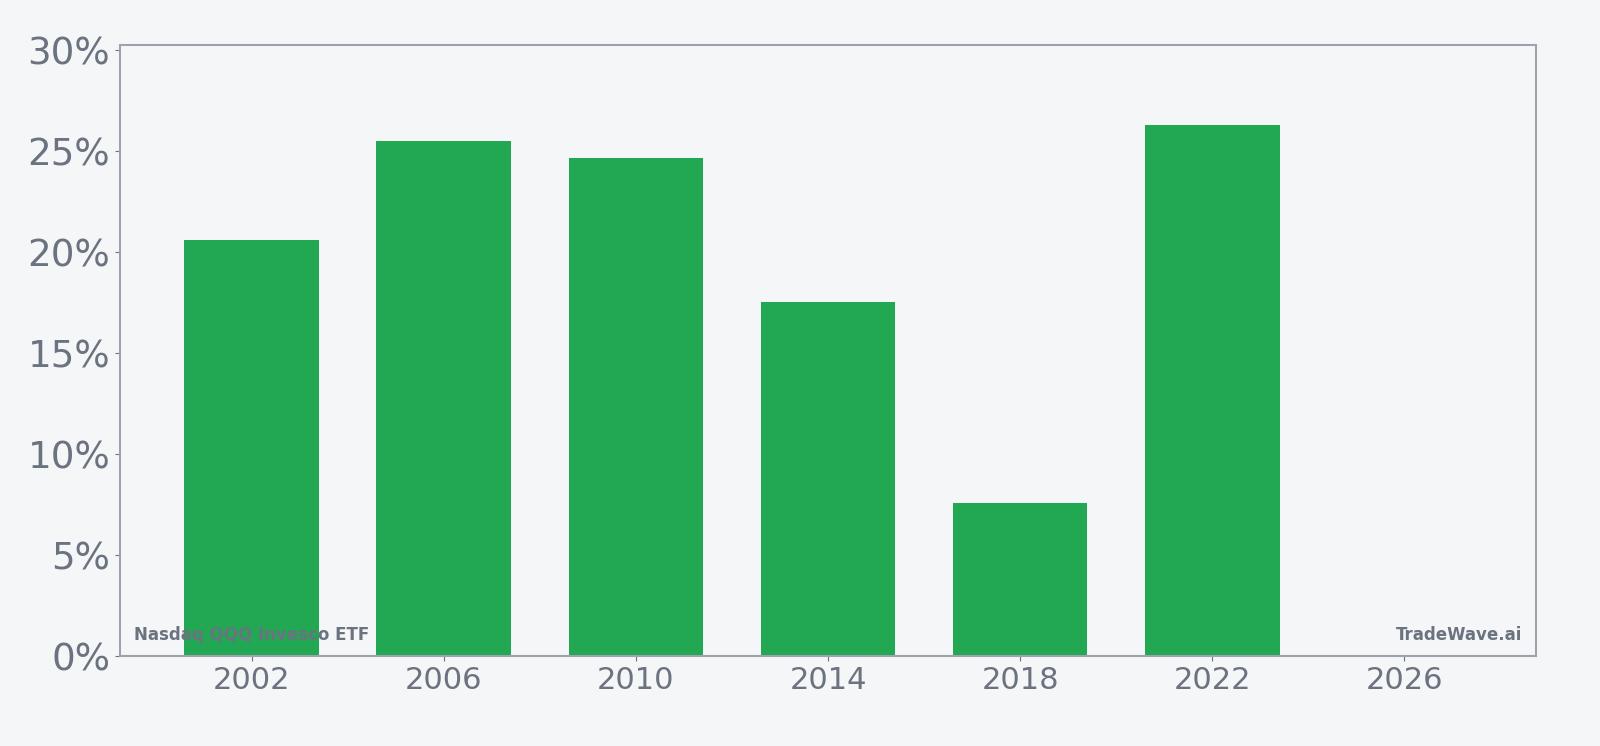
The presidential election cycle matters here because this pattern is built only from midterm election years, a phase that has historically seen policy uncertainty fade and risk appetite rebuild as markets look ahead to the year before the presidential election. Grouping QQQ’s behavior this way isolates how the tech-heavy Nasdaq leadership has tended to trade once the midterm vote is behind it and fiscal and regulatory paths are clearer.
Across the six midterm years in the sample, the trade direction is explicitly long, and every instance finished higher over the 348-day span. The weakest outcome was a 7.58% gain in 2018, while the strongest was a 26.32% rise in 2022, with other cycles like 2006, 2010 and 2014 landing in the high teens to mid-20s. Add it up and the cumulative return across all six windows is 201%, with an annualized pace of 20.19% and a Sharpe ratio of 2.33 based on end-of-window results.
Those smooth finishes mask some rough rides inside the window. Maximum favorable excursions, the best point-to-peak moves within each year, ranged from 9.15% in 2018 to 33.36% in 2010, showing that strong years often saw sizable rallies before the final close. Maximum adverse excursions, the worst drawdowns from entry, were more uneven: QQQ dropped as much as 20.32% at one point in 2002 and 18.30% in 2018 before recovering to finish positive, while other years saw more contained setbacks of roughly 4% to 12%.
The per-year table shows that 2002 and 2018 were the most stressful paths for longs, with deep intraperiod losses despite respectable final gains of 20.61% and 7.58% respectively. By contrast, 2010 and 2022 combined strong net returns of 24.65% and 26.32% with large maximum favorable moves of 33.36% and 29.74%, and more moderate drawdowns of 3.98% and 11.88%. That mix suggests a window where upside has often come in bursts, but where investors have also had to sit through double-digit pullbacks in some cycles.
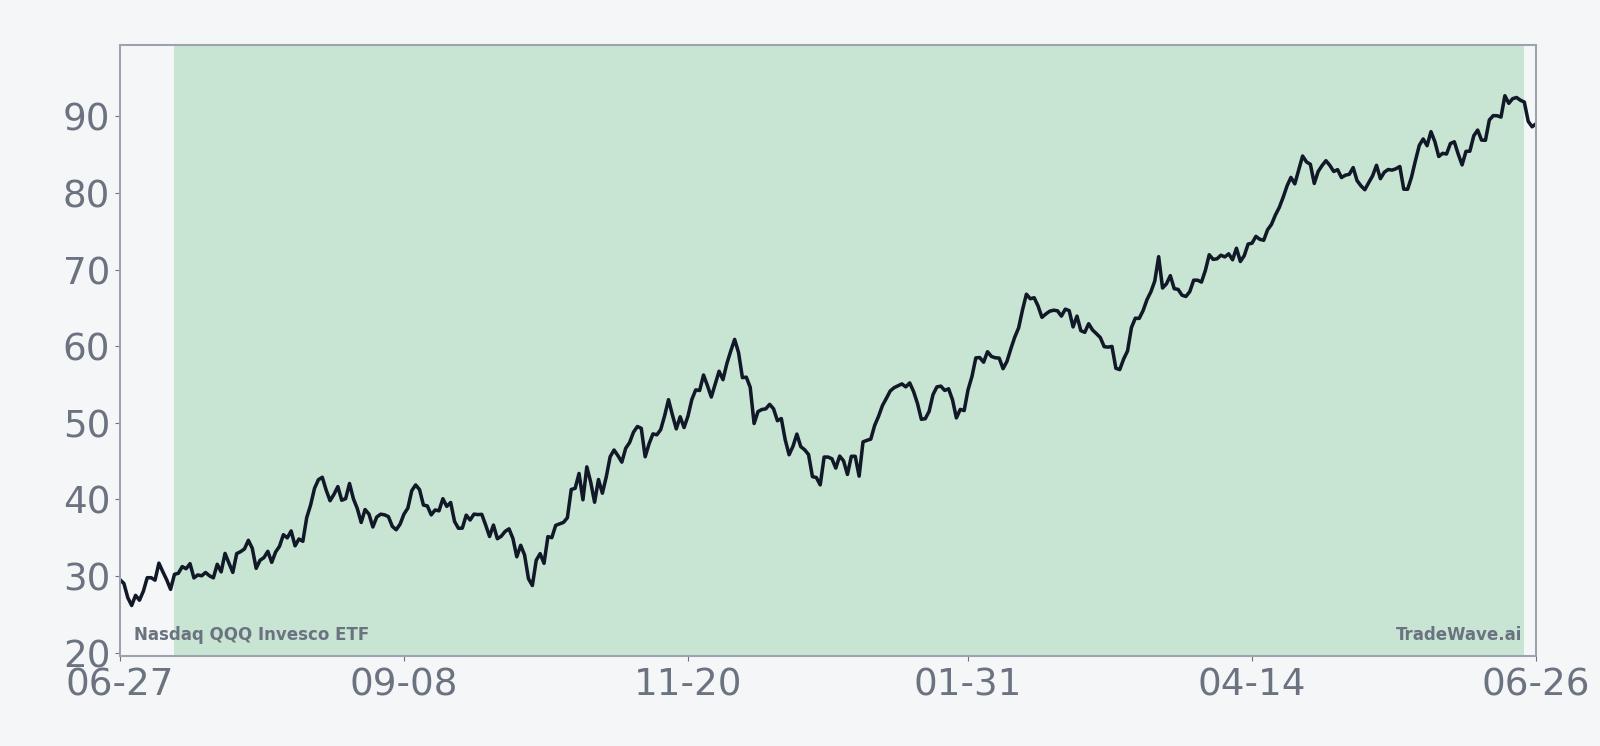
The historical seasonal average trend line slopes steadily higher across the window, with much of the cumulative gain accruing after the first few months. That profile fits the broader election-cycle narrative, where markets often consolidate around the midterm vote and then grind higher as the pre-election year begins and policy risk recedes.
A closer look at yearly net returns alongside best and worst intraperiod swings shows how that upside has coexisted with meaningful volatility.
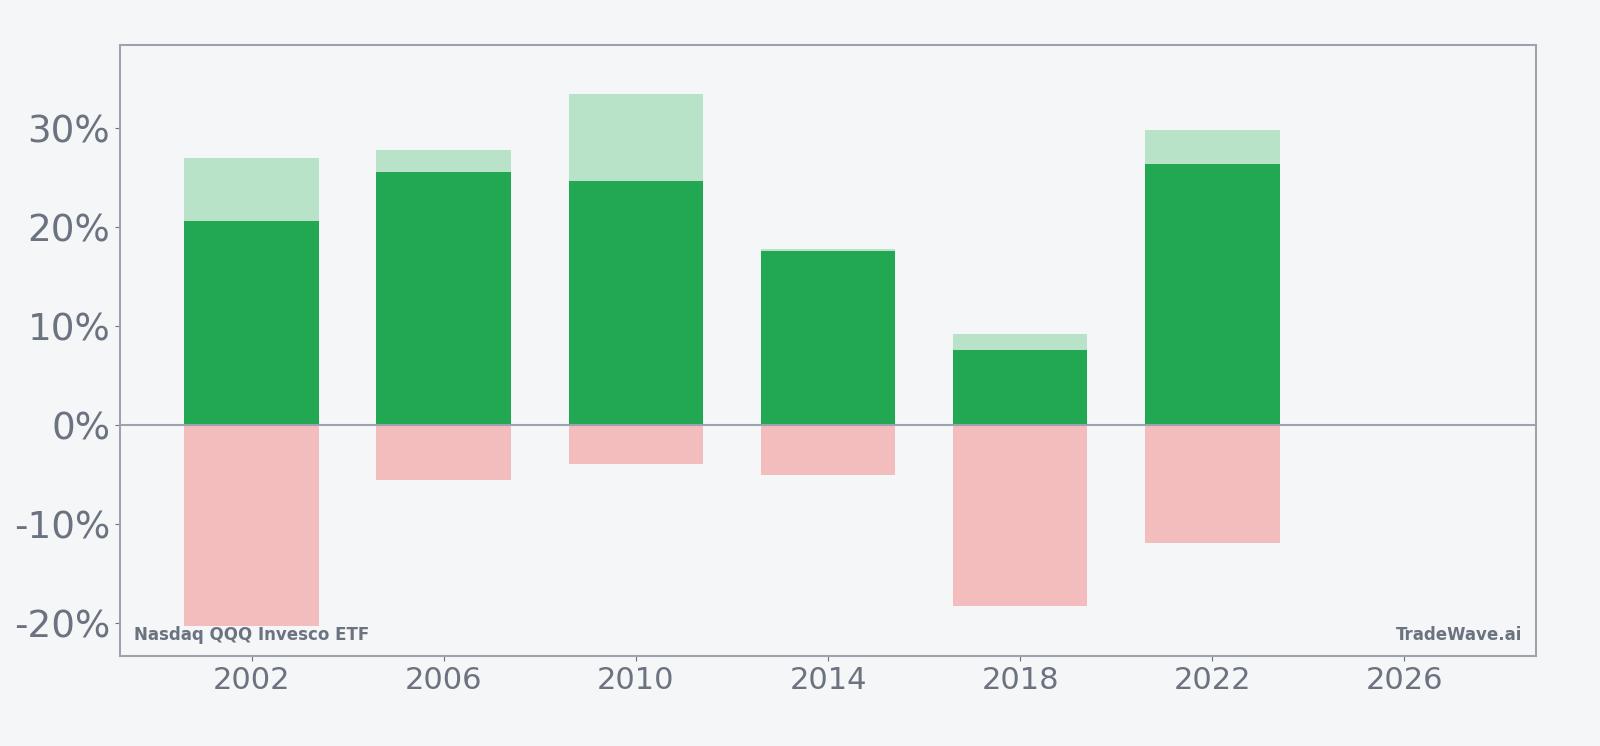
The stacked net, MFE and MAE bars make the trade-off clear: every year finished green, but several saw adverse moves in the mid-teens or worse before recovering, while favorable excursions often pushed into the high teens or 20s. For traders, that combination means the window has historically rewarded staying with the long direction, but only for those prepared for sizable swings along the way.
History does not guarantee future results; adverse excursions can be large even in winning windows, and past midterm-year behavior may not repeat in the next cycle.
Why does Nasdaq QQQ Invesco ETF (QQQ) follow this seasonal pattern?
One likely driver is the way the earnings calendar and policy cycle line up in the back half of a midterm year and the following pre-election year, when tech and growth companies often guide more confidently and political risk tends to ease. Analysts have also pointed to institutional portfolio repositioning after the midterm vote, as large managers rotate back into higher-beta growth and technology exposure once fiscal and regulatory paths look more stable. This pattern may also reflect the broader tendency for the year before the presidential election to be one of the stronger phases for risk assets, with QQQ capturing that tilt in concentrated form.
What is driving Nasdaq QQQ Invesco ETF (QQQ) today?
QQQ’s latest quote has been appearing in intraday market headers, with recent snapshots showing the ETF trading in the mid-600s and modest daily percentage moves, but without a single dominant catalyst tied specifically to the fund. Instead, the tech-heavy ETF continues to function as a real-time barometer for large-cap growth sentiment, with traders watching its distance from the 52-week band between roughly 545.82 and 747.00 and its slight 0.43% one-month dip as a gauge of whether the long-running uptrend is pausing or simply catching its breath.[1]
The chart below situates that consolidation against the past year’s rally and a short-term seasonal projection.
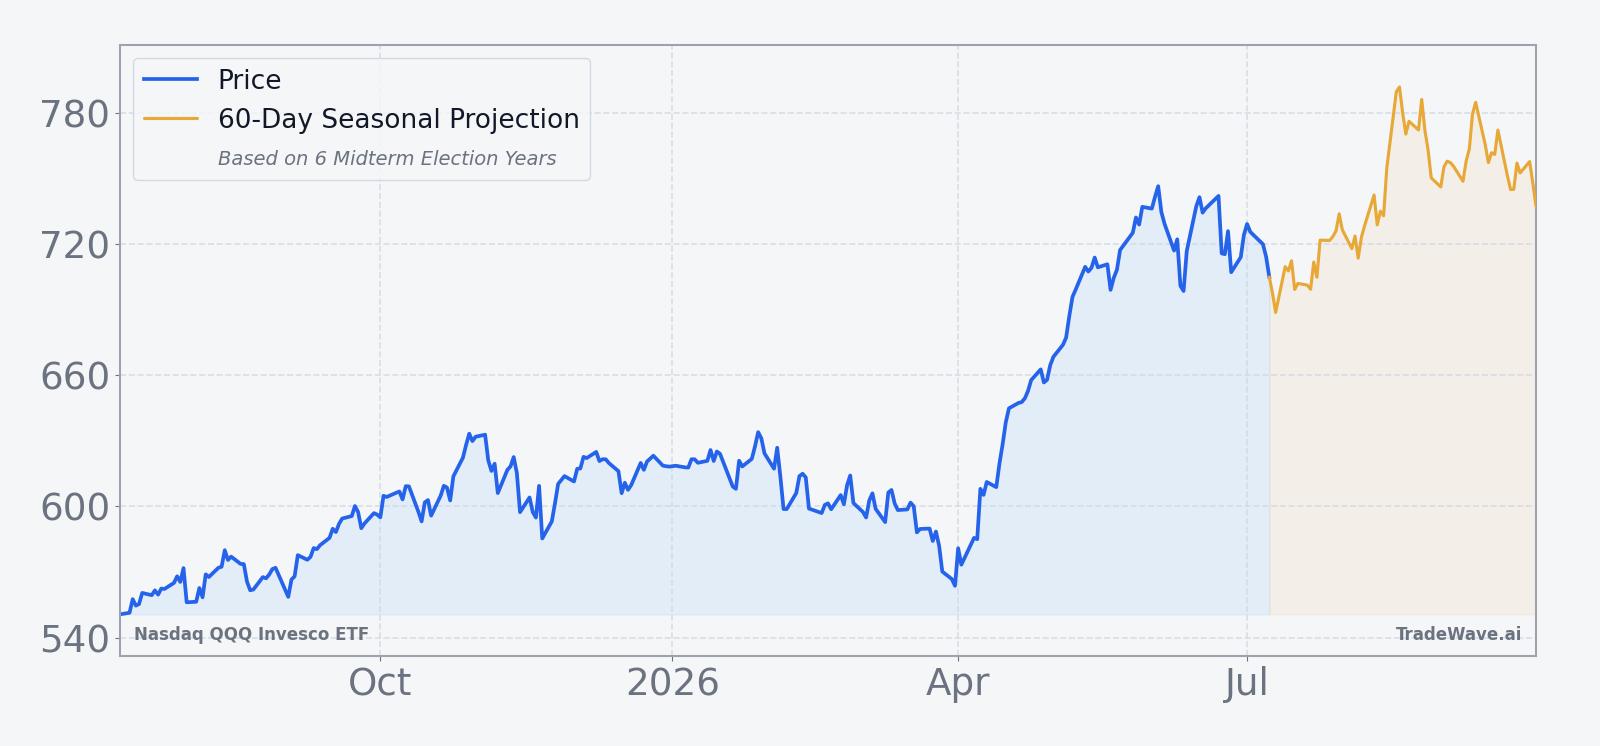
With no single earnings report or policy headline driving QQQ on Jul 10, the focus for many traders is how this consolidation phase will intersect with the much longer 348-day seasonal regime that begins on Jul 11. The ETF’s role as a proxy for mega-cap tech and growth means any renewed momentum or deeper pullback from here is likely to ripple across broader U.S. equity benchmarks, especially as investors weigh the historical midterm-to-pre-election tailwind against current valuations and macro uncertainty.
What should traders watch as this QQQ seasonal window opens?
The first marker is how QQQ behaves in the opening months of the window compared with its historical pattern, which has often featured some early chop before a more persistent grind higher. If the ETF holds above the lower half of its 52-week range and begins to push back toward the prior high near 747.00, that would be broadly consistent with the long-biased seasonal trend. A deeper break toward the lower end of the band, especially if accompanied by heavier volume, would signal that this cycle is diverging from the last six midterm-year windows.
Macro and policy catalysts will matter as well. The back half of a midterm year and the run-up to the presidential election year typically bring a dense calendar of central bank decisions, fiscal debates and regulatory headlines that can swing large-cap tech sentiment. Traders will be watching how QQQ reacts around those events relative to its historical seasonal tendency to absorb volatility and finish the window higher.
Finally, intraperiod volatility deserves close attention. Past windows have seen maximum adverse excursions as deep as roughly 18% to 20% even in years that ultimately finished with double-digit gains, so a sharp drawdown inside the window would not be unprecedented. The key tell will be whether any such setback is followed by a recovery that rebuilds maximum favorable excursion in line with prior cycles, or whether weakness persists and breaks the six-for-six streak that has defined this pattern so far.
Sources
About this seasonal analysis
Seasonal pattern data is sourced from TradeWave.ai, which analyzes historical price behavior across annual calendar windows going back up to 30 years. Read the full data methodology or the book The 100-Year Pattern by Afshin Moshrefi (2026 edition). Past performance of seasonal patterns does not guarantee future results. This article is for informational purposes only and does not constitute investment advice.