Amphenol (APH) Buys Trexon in $1 Billion Defense Deal as Historical Midterm Run Begins
Amphenol is about to enter a long midterm-election-year seasonal window that has never lost in the past, just as shares trade near record territory on AI and connectivity demand.

Price as of Jul 9, 2026: $162.24 (last close).
What is the seasonal pattern for Amphenol (APH)?
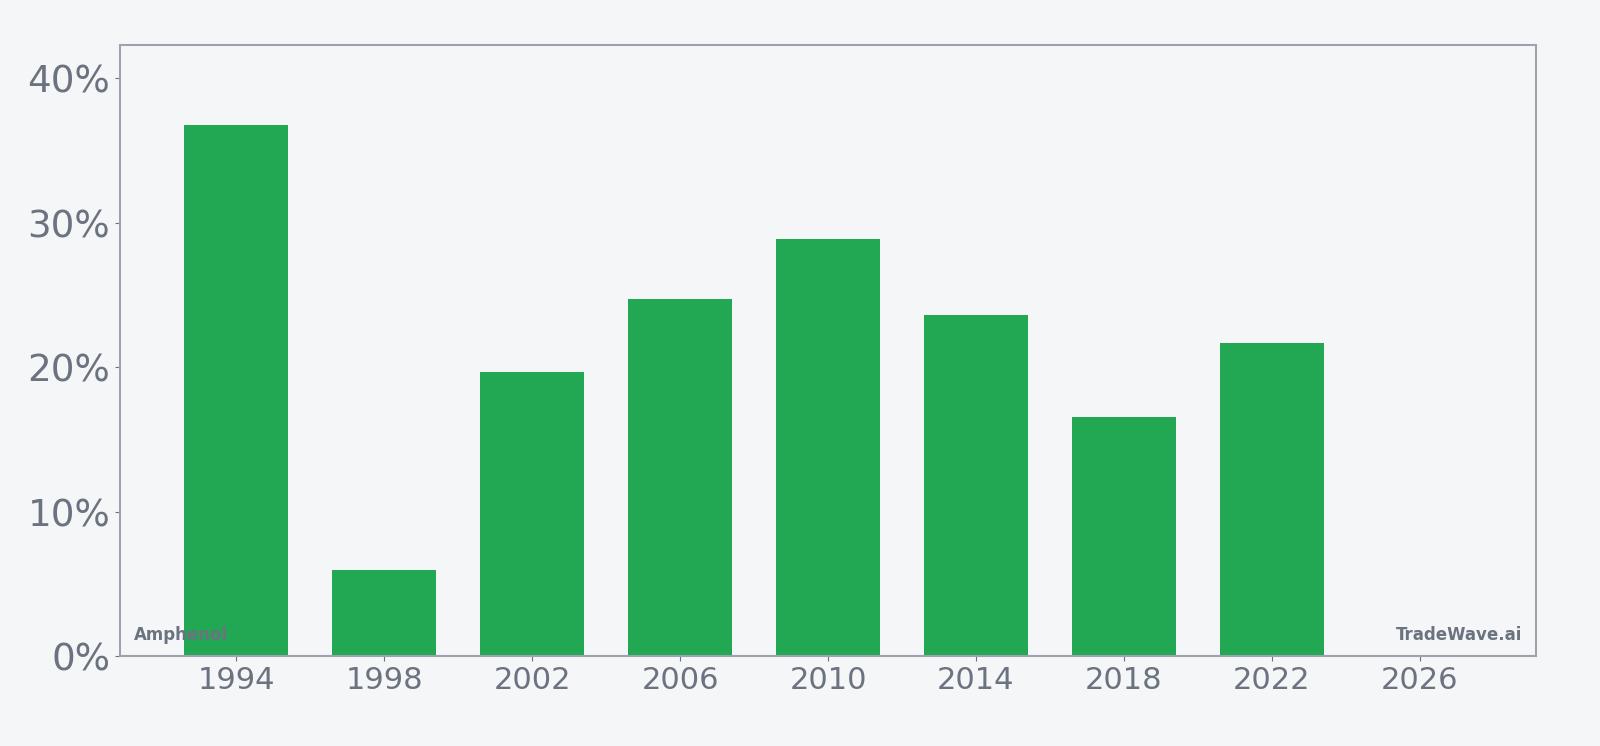
Amphenol has risen in 8 of 8 midterm-election-year windows starting around Jul 11 and lasting 273 calendar days, with an average gain of 22.25% in winning years.
- 8 for 8 in this window, averaging 22.25% gains in winning years across the last eight midterm election cycles.
- The upcoming window begins Jul 11, 2026 and runs for 273 calendar days, covering the back half of the midterm year into the pre-election year.
- Percent Profitable is 100%, with 8 winners and 0 losers over the historical sample.
- Average winner gains of 22.25% stack up to a 389% cumulative return across all eight midterm-year windows.
- Intraperiod swings have been meaningful, with some years seeing double-digit drawdowns even as they finished higher.
- The pattern aligns with a long trade direction, fitting Amphenol’s role as a cyclical beneficiary of AI, broadband and defense spending.
According to historical data from TradeWave.ai, this midterm-election-year stretch has behaved very differently from an average calendar year for Amphenol, and the next iteration starts tomorrow.
How strong is this upcoming seasonal window for Amphenol (APH)?
Amphenol has posted gains in all eight prior midterm-election-year windows that start around Jul 11 and run for 273 calendar days, averaging 22.25% per cycle. The stock finished the prior session at 162.24, up 2.5% on the day and sitting between its 52-week low near 93.91 and high at 178.52, leaving it about 9.1% below the peak.[1] For traders watching the APH seasonal trend, that combination of a strong historical window and a stock still shy of its high makes this regime one of the more closely watched setups on the industrial-tech calendar.
Grouping the data by the presidential election cycle matters here because this window always lands in the back half of a midterm election year and then runs into the year before the presidential election, a phase that has often coincided with clearer policy visibility and stronger risk appetite. For a cyclical name tied to capital spending and defense budgets, that policy calendar can shape order timing and investor positioning in ways that repeat from cycle to cycle.
Across the eight midterm-election-year samples since 1994, Amphenol’s average gain of 22.25% comes with a median outcome of 22.67%, which points to a fairly tight cluster of strong years rather than one outlier doing all the work. The weakest net result in the set was 5.97% in 1998, while the strongest was a 36.8% gain in 1994, so even the “soft” years still finished positive for a long bias. Add it up and the cumulative return across these eight windows is 389%, which is why this particular APH seasonal trend stands out on the industrials calendar.
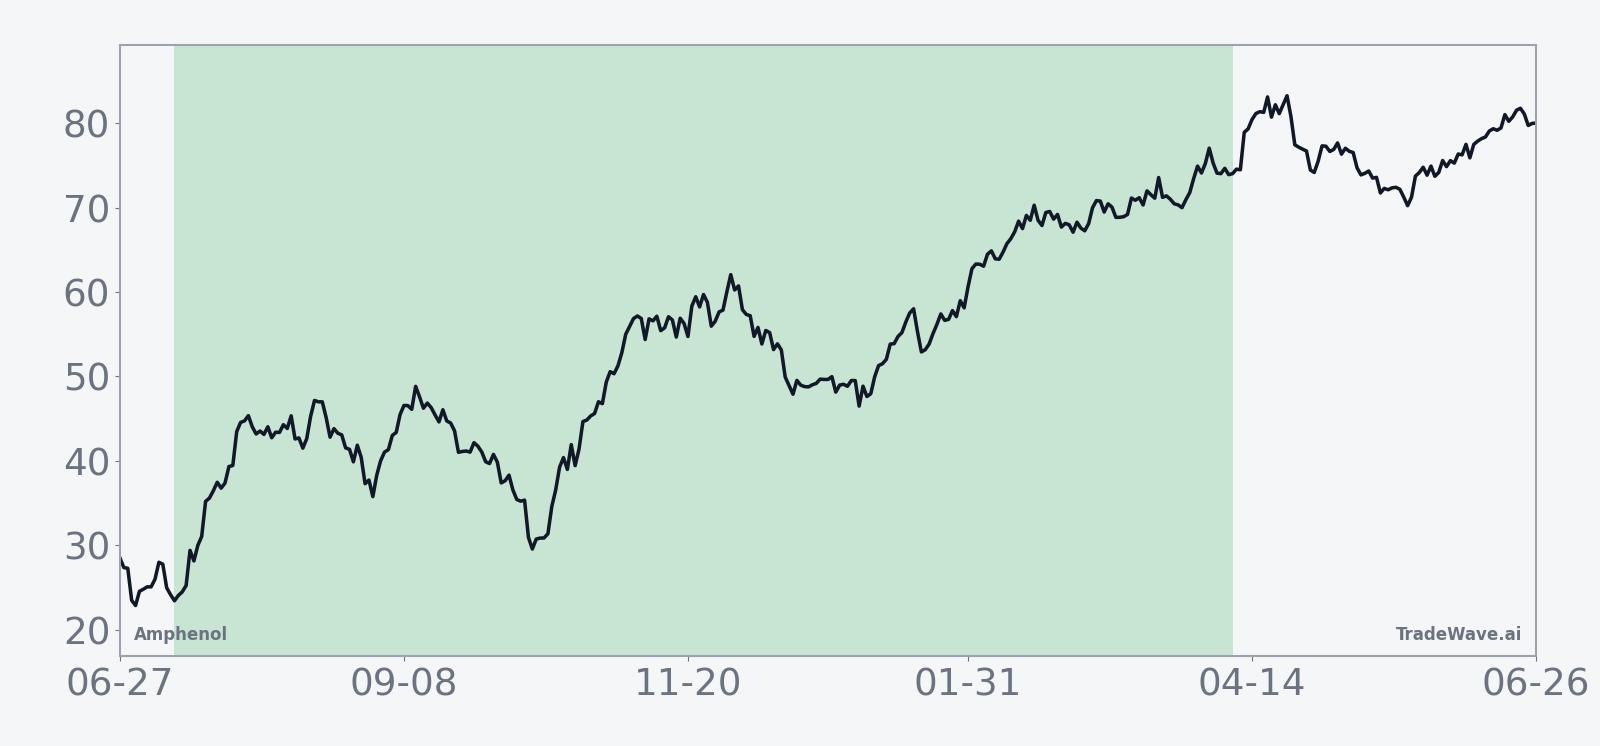
The historical seasonal average suggests that gains tend to build steadily rather than arriving in one short burst, with the trend line sloping higher through much of the window and only modest pauses. That fits a story where institutional investors gradually add exposure as midterm uncertainty clears and the pre-election year’s growth narrative takes over.
Intraperiod swings, captured by best and worst excursions, show how much upside and downside Amphenol has historically experienced inside this window before the final result.
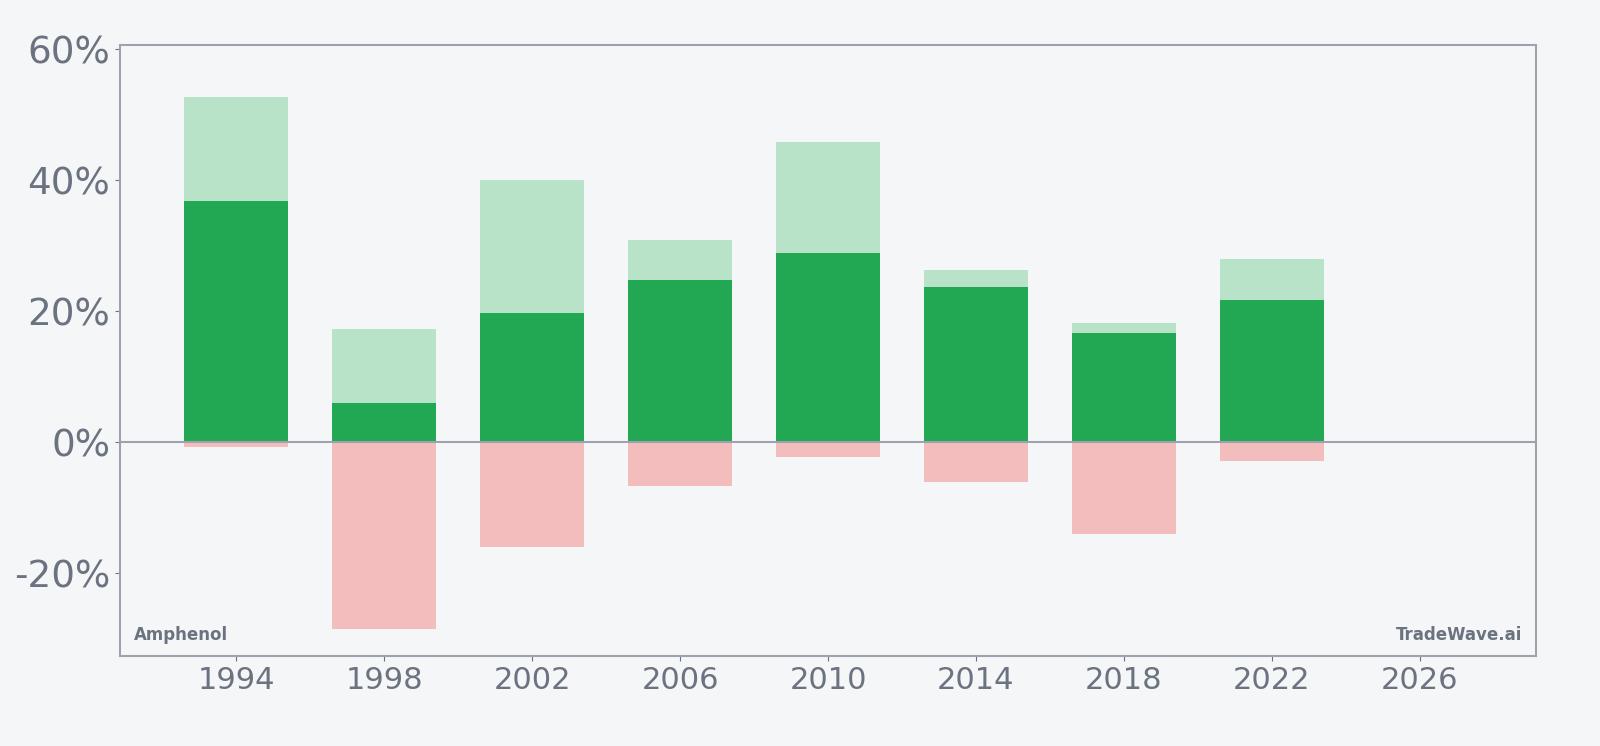
Maximum favorable moves inside the window have often run well ahead of the final net gains, with several years showing peak run-ups north of 40%, while maximum adverse moves have ranged from shallow pullbacks of around 1% to deeper drawdowns near 28%. That mix points to a long pattern with strong upside potential but enough volatility that timing and risk management still matter, even in a window that has never closed negative in this sample. The pattern is clear: this has been a consistently friendly stretch for longs, but not a free ride.
History does not guarantee future results; adverse excursions can be large even in winning windows, and past seasonal behavior may not repeat.
Why does Amphenol (APH) follow this seasonal pattern?
One likely driver is the way Amphenol’s end markets line up with the policy and spending cycle around midterm and pre-election years, when infrastructure, broadband and defense budgets often gain clarity. Analysts have also pointed to earnings calendar clustering and institutional portfolio rebalancing, which can push investors to add exposure to high-quality industrial and connectivity names as visibility improves.[1] The pattern may also reflect sector rotation into cyclical technology suppliers as AI and data center buildouts move from planning to deployment phases in these parts of the cycle.
What is driving Amphenol (APH) today?
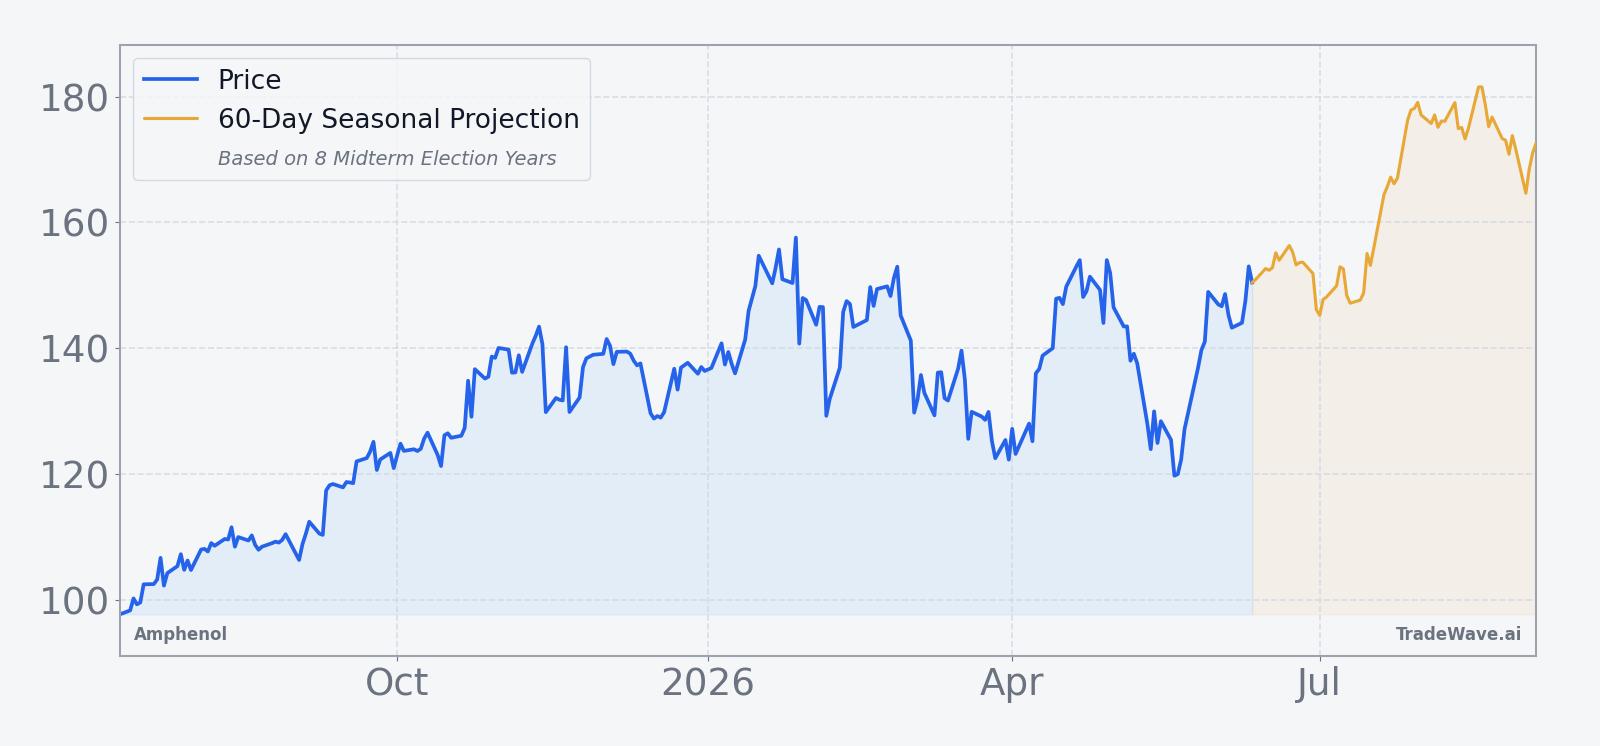
Amphenol closed the prior session at 162.24, up 4.02 points or 2.5% on the day, after trading between 161.33 and 164.89 on volume of about 6.1 million shares, versus a 20-day average near 9.1 million.[1] The stock has climbed roughly 5.62% over the past month and sits above its 50-day moving average around 146.77, underscoring a firm uptrend heading into the new seasonal window.[1] That strength comes as investors continue to treat Amphenol as a derivative AI and connectivity play, with exposure to high-speed interconnects, copper and fiber cabling, and defense-related assemblies that tie into data center and broadband buildouts.[3]
The chart below shows how that advance fits into the past year of trading, along with a short-term seasonal projection overlay.
In August 2025, Amphenol agreed to buy Trexon, a defense-focused interconnect and cable assemblies provider, in a roughly $1 billion cash deal that added about $290 million of expected 2025 sales and expanded its footprint in mission-critical applications.[3] Earlier that month, reports indicated Amphenol was set to acquire CommScope’s broadband connectivity and cable unit in a transaction valued at $10.5 billion including debt, a move that would deepen its role in fiber and cable infrastructure.[2] Those deals, while announced in 2025, still frame how investors think about Amphenol’s scale and mix as the company leans into AI data center demand and broadband upgrades in 2026.[2][3]
Analysts have highlighted strong AI-driven demand and higher component content per rack in next-generation systems as key supports for Amphenol’s growth trajectory into 2026, arguing that the company is a leveraged way to play the buildout of high-speed data infrastructure.[1] That macro and sector backdrop helps explain why the stock is entering this historically strong Amphenol trading window from a position of strength rather than distress. For traders, the question is not whether the historical seasonality repeats, but how the interaction between AI spending, M&A integration and the midterm-to-pre-election policy calendar shapes behavior inside this particular slice of the calendar.
What should traders watch in this Amphenol (APH) seasonal window?
First, watch how APH behaves around the 178.52 area, which marks the 52-week high; a sustained push through that zone early in the window would be consistent with prior years where gains built steadily from a strong starting point.[1] Second, monitor volatility relative to the historical pattern: years with the biggest gains have often seen sizable intraperiod swings, so sharp pullbacks inside the window have not automatically broken the longer seasonal trend. Third, keep an eye on policy and budget headlines tied to broadband, infrastructure and defense, since shifts there can influence order timing for the interconnects and cabling sector even when the broader market is calm.[2][3] Finally, track whether AI and data center commentary in upcoming quarters continues to emphasize higher content per rack and robust demand, because a cooling narrative there would be one of the cleaner ways this cycle could diverge from the otherwise powerful historical APH seasonal pattern.[1]
Sources
- CNBC, "Bank of America just upgraded one of the hottest derivative AI plays in the market today - Amphenol upgrade coverage" (Oct 15, 2025)
- Seeking Alpha, "Amphenol set to acquire CommScope unit in $10.5B deal - report" (Aug 4, 2025)
- The Wall Street Journal, "Amphenol to Buy Trexon From Audax Private Equity for $1 Billion" (Aug 18, 2025)
About this seasonal analysis
Seasonal pattern data is sourced from TradeWave.ai, which analyzes historical price behavior across annual calendar windows going back up to 30 years. Read the full data methodology or the book The 100-Year Pattern by Afshin Moshrefi (2026 edition). Past performance of seasonal patterns does not guarantee future results. This article is for informational purposes only and does not constitute investment advice.