S&P 500 (SPX) Has Rallied in Every Midterm Window Since 1986, Averaging 12.85%
The S&P 500 is heading toward a 275-day midterm-year seasonal window that has never been negative in the last 10 cycles, even as technicals and macro signals hint at fatigue.

What is the seasonal pattern for S&P 500 (SPX)?
S&P 500 has risen in 10 of 10 midterm-year windows starting around Jul 23, with an average gain of 12.85% in winning years.
- 10 for 10 in this 275-day midterm-year window, with average gains of 12.85% in winning years.
- Seasonal window begins Jul 23 and runs roughly through late April of the following pre-election year, covering the heart of the midterm-to-pre-election phase.
- Percent Profitable is 100%, with 10 winners and 0 losers across the last 10 midterm election years.
- Median outcome is a 14.06% gain, pointing to a consistently bullish SPX seasonal trend rather than a few outlier years.
- TradeWave Ratio of 1.63 signals that price typically travels meaningfully in the long direction within the window, while a Sharpe ratio of 1.47 reflects strong risk-adjusted returns.
- Individual years have still seen drawdowns as deep as about 17% to 19% inside the window, so the ride has not been smooth even when the final result was positive.
According to historical data from TradeWave.ai, this upcoming midterm-to-pre-election stretch has behaved very differently from an average year on the calendar. The next section looks at how that long seasonal regime has lined up with past S&P 500 moves and what that might signal for the current cycle.
How has S&P 500 (SPX) traded in this midterm-to-pre-election window?
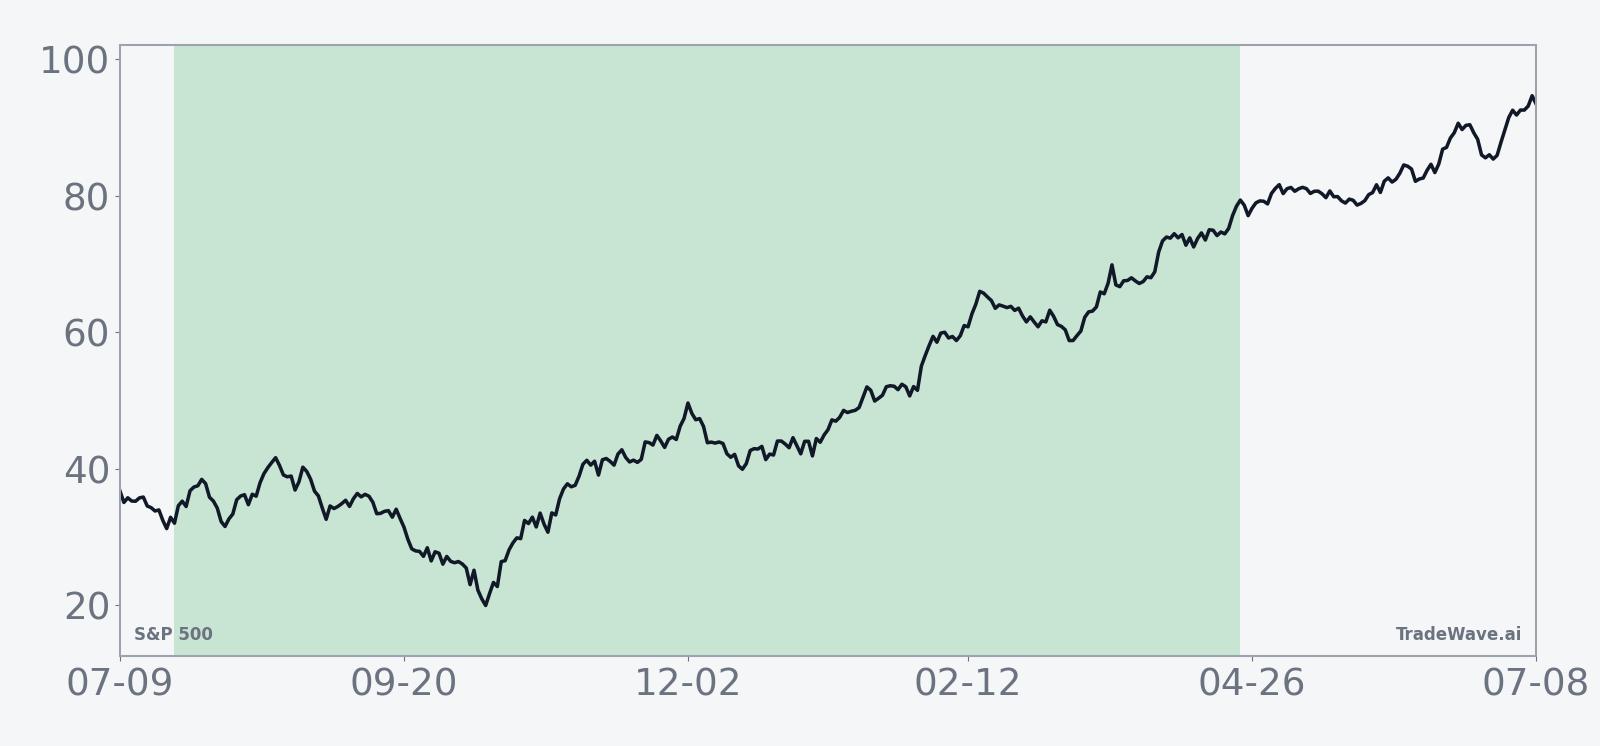
The seasonal window that begins on Jul 23 and runs 275 calendar days has produced gains for the S&P 500 in every one of the last 10 midterm election years, with average returns of 12.85% for this long setup. That stretch spans late in the midterm election year into the following pre-election year, a phase that has often coincided with improving risk appetite and stronger index-level performance. For traders watching the SPX seasonal trend, this is the part of the presidential cycle that has historically flipped the script from early-year midterm volatility to a more persistent grind higher.
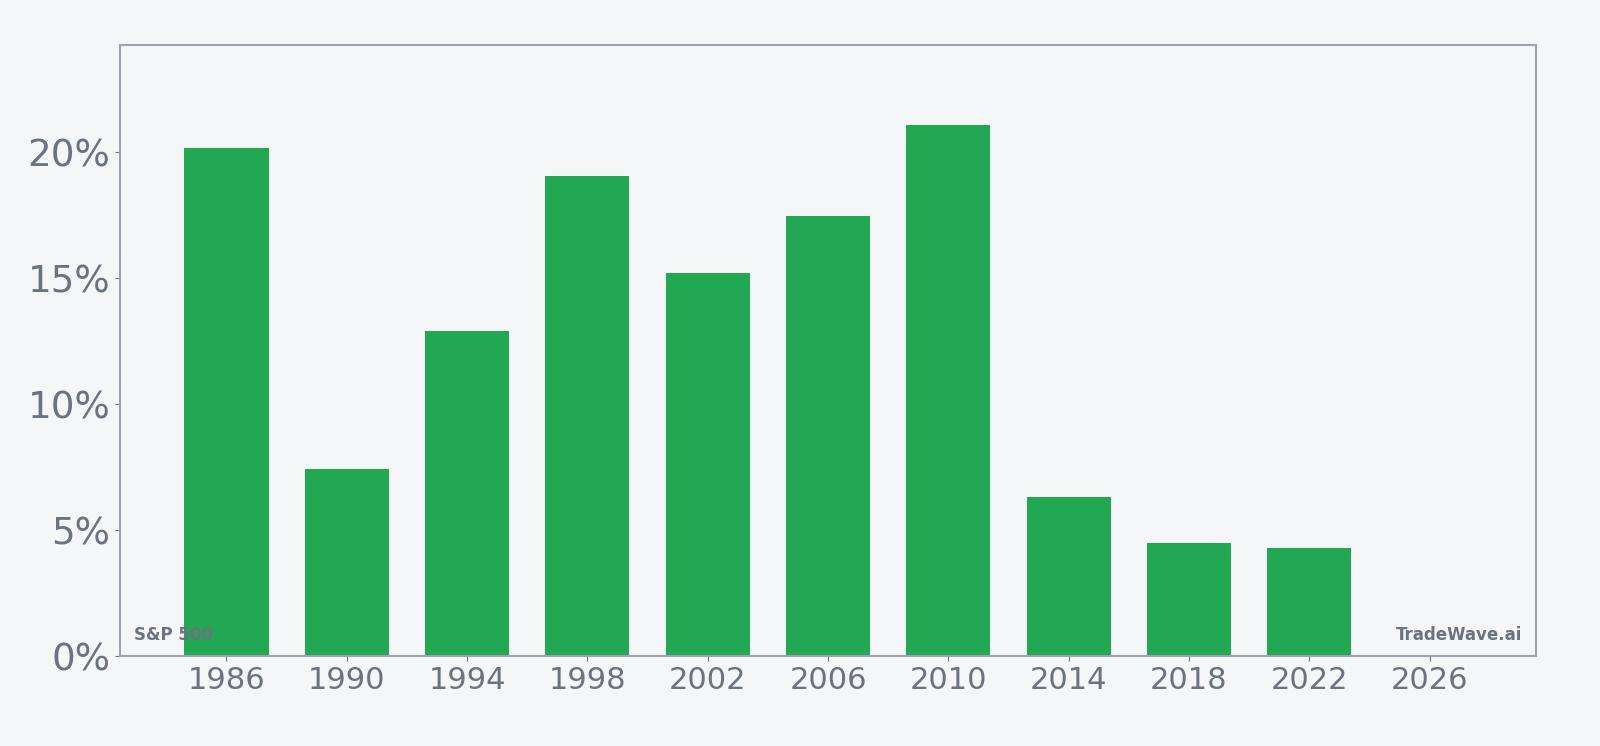
Grouping the data by the presidential election cycle matters here because midterm years have historically been “two-playbook” markets: choppy and risk-heavy in the first half of the year, then much stronger from early autumn into the following summer. This 275-day SPX trading window sits squarely inside that late midterm-to-pre-election regime, which has often lined up with clearer policy visibility, less legislative noise, and a friendlier liquidity backdrop for equities.
Year-by-year bars with maximum favorable and adverse moves show how far SPX has typically swung inside this window.
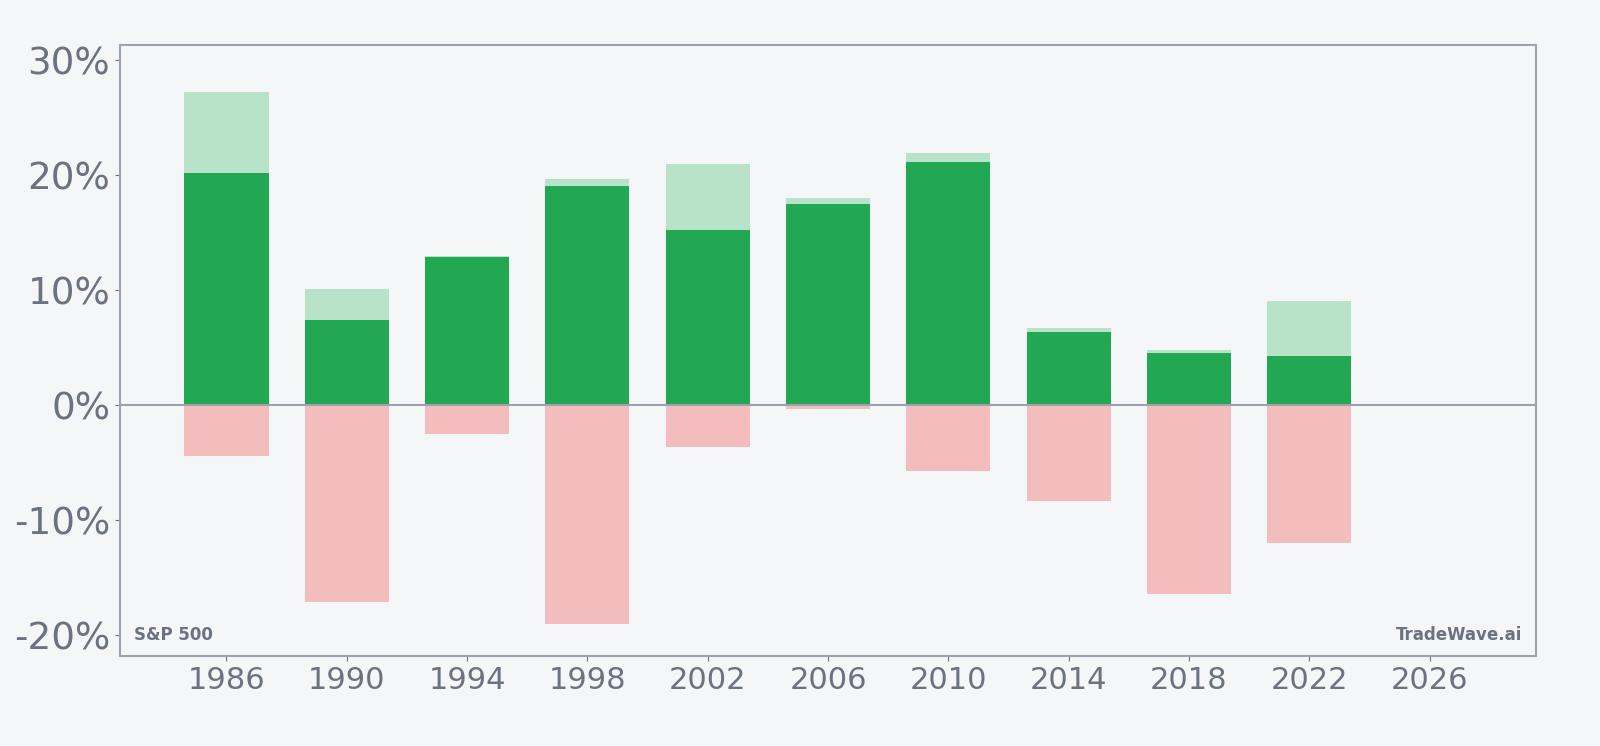
Across the 10-year sample, the strongest outcomes came in 2010 and 1986, when the S&P 500 gained 21.09% and 20.17% respectively from entry to exit while also posting peak run-ups of 21.89% and 27.23%. The weakest net results still finished positive, with 2018 and 2022 up 4.51% and 4.29%, but those years carried much deeper intraperiod drawdowns, with worst adverse excursions of about 16.4% and 11.98% from the starting level. That mix of solid final gains and sometimes sharp mid-window setbacks is exactly what the TradeWave Ratio of 1.63 and Sharpe ratio of 1.47 are capturing: a long-biased pattern that has rewarded patience but demanded a strong stomach.
Looking at the maximum favorable and adverse excursions side by side, several years stand out as high-variance environments. In 1998, for example, the index ultimately gained 19.05% in the window, but the worst drawdown from entry was about 18.99% even as the best run-up reached 19.64%. In 1990, the S&P 500 finished the window up 7.44%, yet the worst intraperiod drop from the starting point was roughly 17.11%, underscoring that even “winning” midterm windows can feel like full-blown corrections along the way.
The cumulative return profile for this SPX seasonal pattern is unusually smooth for an equity index. Gains tend to build steadily rather than arriving in a single burst, with the median profit of 14.06% sitting slightly above the average, which suggests that the window has not been dominated by one or two outlier years. Trend statistics also lean heavily to the upside, with 48 long-biased trend segments versus just 2 short segments across the composite path, and a similar skew in the shorter-horizon trend counts.
Add it up: 10 for 10, double-digit average gains, and a steady cumulative climb make this one of the cleanest long seasonal regimes on the S&P 500 calendar, even if the path inside the window has often been bumpy.
Why does S&P 500 (SPX) follow this seasonal pattern?
This midterm-to-pre-election pattern may reflect a mix of policy clarity and institutional positioning. One likely driver is that by late in the midterm year, the policy agenda for the rest of the presidential term is clearer, which can reduce headline risk and support higher equity multiples. Analysts have also pointed to year-end and new-year portfolio rebalancing, plus sector rotation into risk assets as economic visibility improves, as forces that tend to cluster in this part of the cycle and reinforce the historical SPX seasonal trend.
History does not guarantee future results, and even in this strong window, adverse excursions have reached the mid-teens in several years, so drawdown risk remains significant.
What is driving S&P 500 (SPX) today?
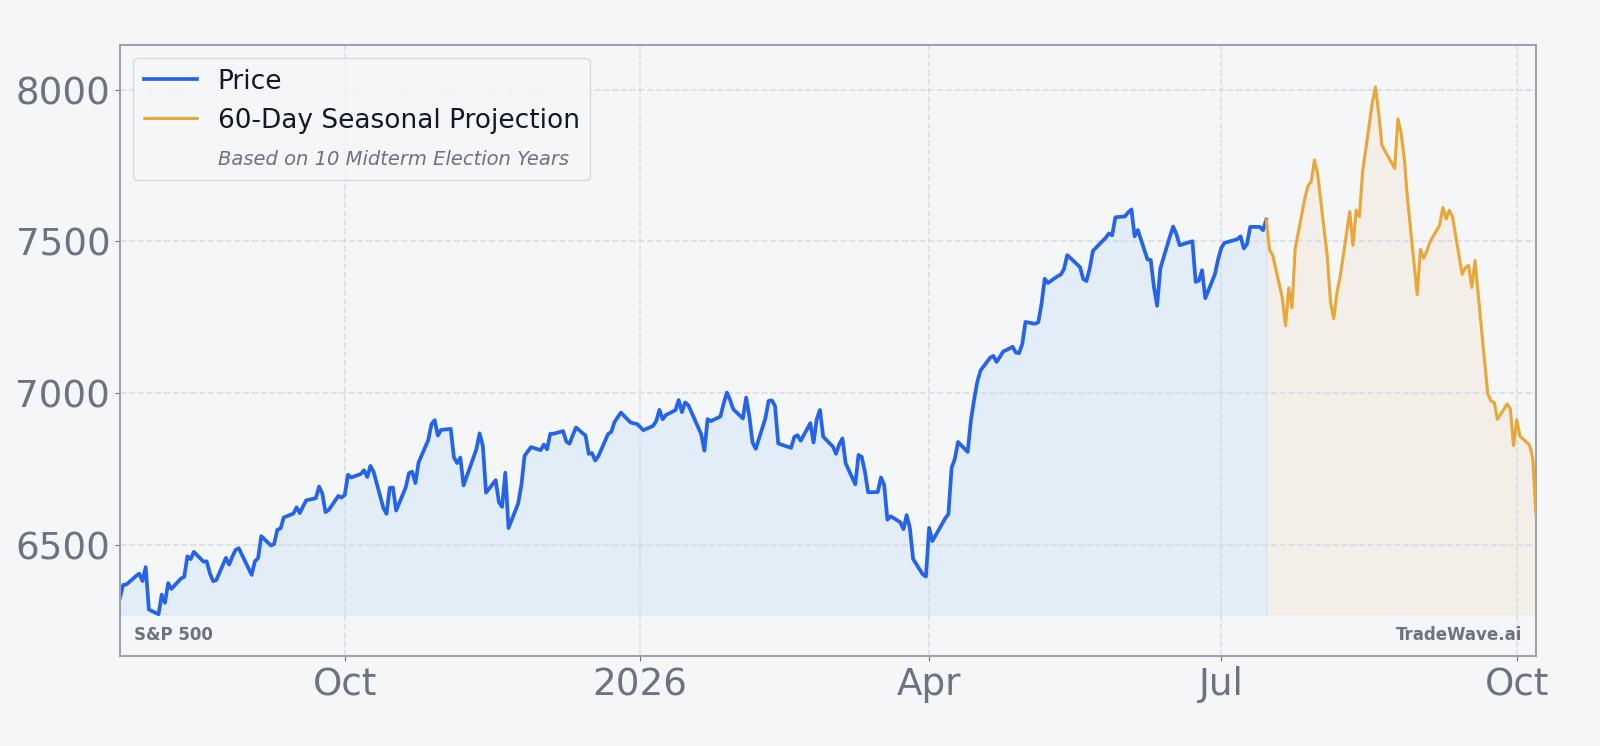
Into midyear, the S&P 500 sits between its 52-week low near 6,132 and its high around 7,620, with a one-month return of -1.84% that hints at some consolidation after a powerful run. The index has recently traded below its 50-day moving average of 7,371.41 and has shown signs of fatigue after setting fresh records, as technicians flag waning momentum and the risk of a corrective phase even within a broader bull market backdrop.[1] Strategists also note that while expected Federal Reserve rate cuts could support U.S. equities, forward returns may be more muted than in past easing cycles, which could cap upside even if the SPX seasonal outlook remains constructive.[1]
Macro commentary in early April 2026 highlighted a push-pull between supportive monetary policy expectations and persistent macro risks, including geopolitical tensions and strong labor data that complicate the timing and depth of Fed cuts.[1] That mix has kept volatility alive under the surface, with sector rotation favoring technology and energy at different points, and leaving the index vulnerable to air pockets when crowded trades unwind.[1] For traders, the key tension into late July is whether this consolidation phase resolves higher in time to align with the historically strong midterm-year seasonal window, or whether a deeper shakeout arrives first.
The chart below situates the latest pullback against the past year’s uptrend and overlays a short-term seasonal projection.
What should traders watch as this SPX seasonal window approaches?
First, the calendar: the 275-day window kicks off on Jul 23, so price action in the weeks just before that date will shape how much “fuel” is left if the historical pattern is going to rhyme. A shallow consolidation that holds above the 50-day moving average would look very different from a deeper correction that drags SPX closer to its 52-week midpoint. Second, watch the policy calendar and Fed communication, since any shift in rate-cut expectations could either reinforce or blunt the typical midterm-to-pre-election tailwind for equities.[1]
Third, monitor intraperiod volatility once the window opens. In prior cycles, even winning years have seen maximum adverse moves in the low- to high-teens, so a sharp drawdown early in the window would not automatically contradict the historical pattern. What would break character is a sustained failure to recover those drops over the full 275-day span. Finally, sector leadership will matter: if technology and other growth groups continue to attract flows despite macro noise, that would align with the bullish SPX seasonal trend, whereas a broad, defensive rotation could signal that this cycle is diverging from the last 10 midterm-year playbooks.[1]
Sources
About this seasonal analysis
Seasonal pattern data is sourced from TradeWave.ai, which analyzes historical price behavior across annual calendar windows going back up to 30 years. Read the full data methodology or the book The 100-Year Pattern by Afshin Moshrefi (2026 edition). Past performance of seasonal patterns does not guarantee future results. This article is for informational purposes only and does not constitute investment advice.