Tech-Heavy Nasdaq 100 (NDX) Near 52-Week High as 266-Day Midterm Rally Window Approaches
Nasdaq 100 is hovering near its 52-week high as it approaches a 266-day midterm-election seasonal window that has never been negative in the last nine cycles.
Price as of Jul 10, 2026: $29,825.11 (last close).

What is the seasonal pattern for Nasdaq 100 (NDX)?
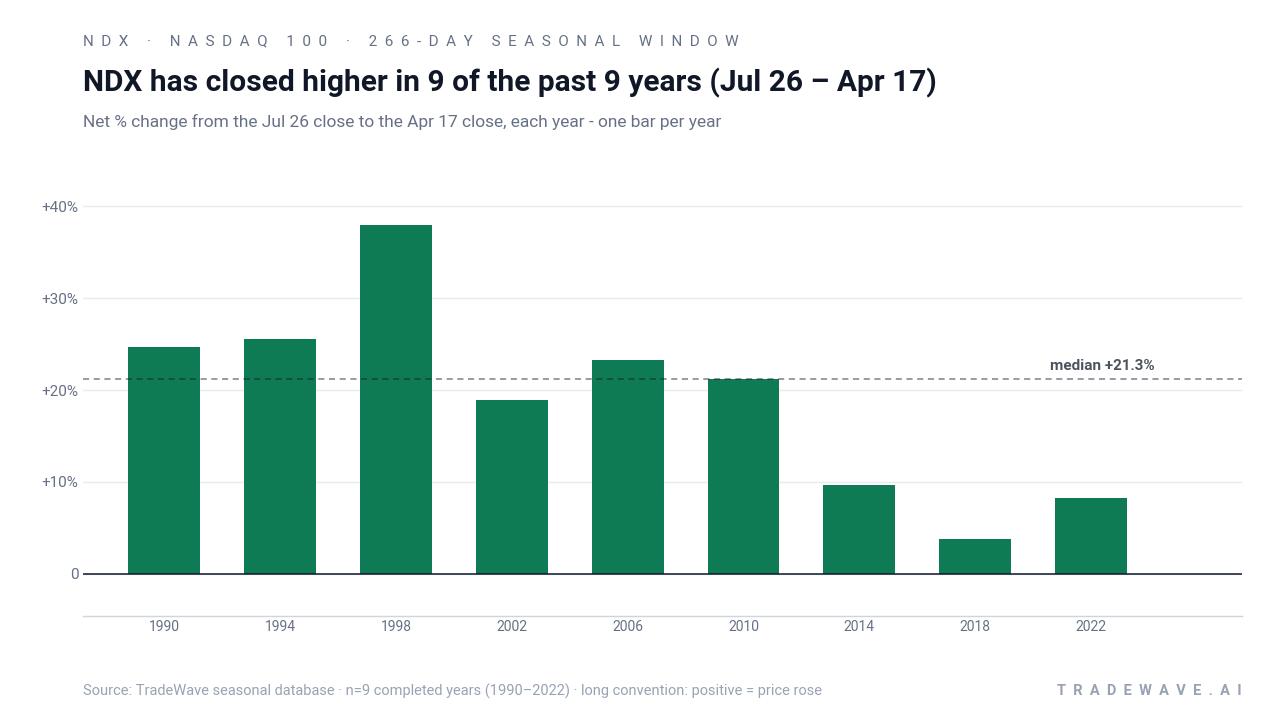
Nasdaq 100 has risen in 9 of 9 midterm-election-year windows starting around Jul 26, with an average gain of 19.28% in winning years.
- 9 for 9 in this window, with Nasdaq 100 posting average gains of 19.28% across all winning years.
- The upcoming pattern begins Jul 26, 2026 and runs for 266 trading days, spanning late midterm year into the pre-election year.
- Percent Profitable is 100%, with 9 winners and 0 losers across the last nine midterm-election-year cycles.
- Average winner gains of 19.28% compare with a cumulative return of 373% and an annualized return of 18.86% for this specific window.
- The TradeWave Ratio of 1.44 signals that price has typically traveled meaningfully in the long direction within the window, while a Sharpe ratio of 1.55 points to strong risk-adjusted results.
- Individual years have still seen sizable intraperiod drawdowns, with adverse moves as deep as about 28% before recovering into positive territory.
According to historical data from TradeWave.ai, this midterm-election stretch has behaved very differently from an average year for the Nasdaq 100. The next section walks through how that pattern has played out in prior cycles and what it means for the upcoming window.
How strong is the upcoming seasonal window for Nasdaq 100 (NDX)?
Nasdaq 100 has booked gains in every one of the last nine midterm-election-year windows that start in late July and run roughly into the following summer, averaging 19.28% returns for longs. The next iteration of that 266-day window begins on Jul 26, 2026, with the index trading at 29,825, about 3.0% below its 52-week high and roughly 31.6% above its 52-week low. That combination of a powerful historical seasonal trend and a benchmark sitting near record territory gives this upcoming stretch unusual weight for tech-heavy portfolios.
The pattern is built on the last nine midterm election years, a phase of the presidential cycle that often looks very different from the year after an election or the pre-election year. In this case, the window starting around Jul 26 sits late in the midterm year and then carries into the following pre-election year, a stretch that has historically aligned with improving risk appetite and stronger performance for growth-heavy benchmarks like the Nasdaq 100.
Across those nine midterm-year samples, every single iteration of this window finished positive for a long position. Net returns ranged from a modest 3.78% gain in 2018 to a 37.94% surge in 1998, with a median outcome of 21.26%. The cumulative return across all nine windows is 373%, and the annualized return of 18.86% underscores how powerful this specific slice of the calendar has been for long exposure to NDX.
The per-year table shows that even the softer outcomes still finished green. In 2018, for example, the index gained 3.78% over the window, but the maximum adverse move within that period reached about 20.34% from the entry level, highlighting how choppy the path can be even in a winning year. At the other end of the spectrum, 1998 delivered a 37.94% net gain with a maximum favorable excursion of 57.83%, but it still saw an intraperiod drawdown of roughly 25.46% before the rally stuck.
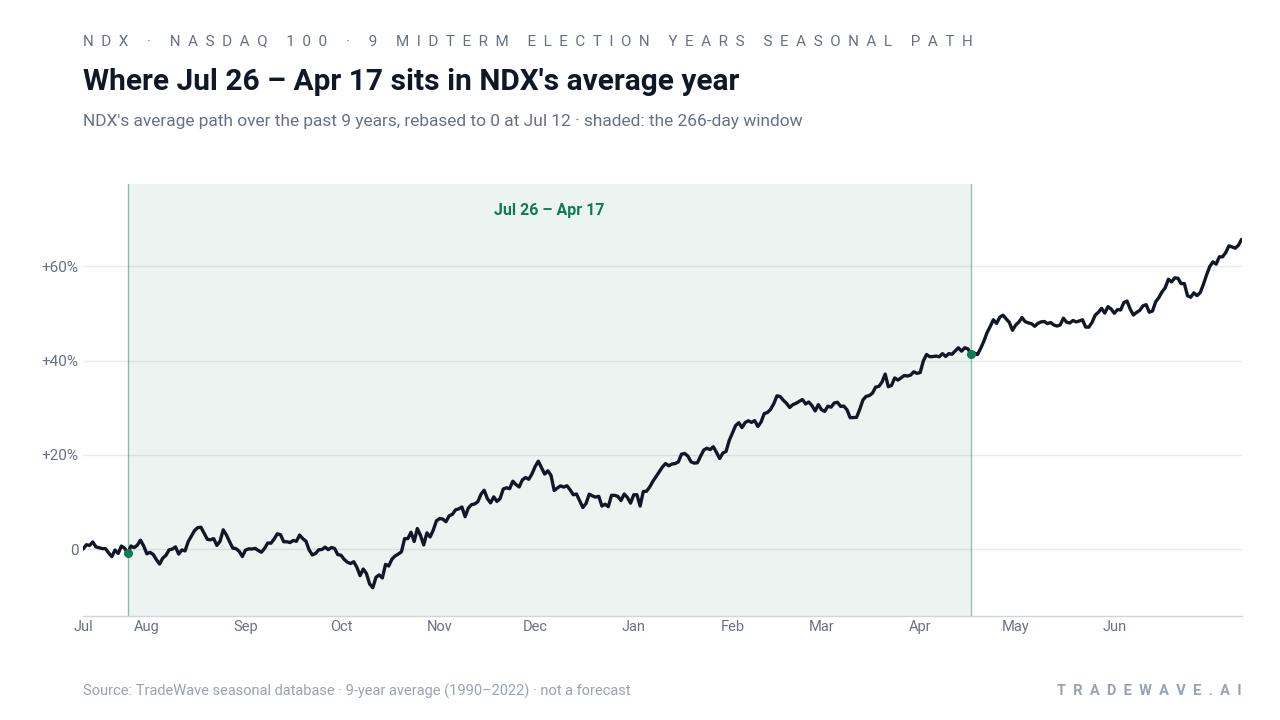
The historical seasonal trend chart suggests that gains in this window have tended to build steadily rather than arriving in a single burst. The average path shows a constructive bias early in the window, followed by a stronger upslope as the calendar transitions from the back half of the midterm year into the pre-election year, when policy uncertainty often fades and liquidity conditions improve.
A closer look at yearly net returns alongside best and worst intraperiod swings shows how upside and downside have coexisted in this pattern.
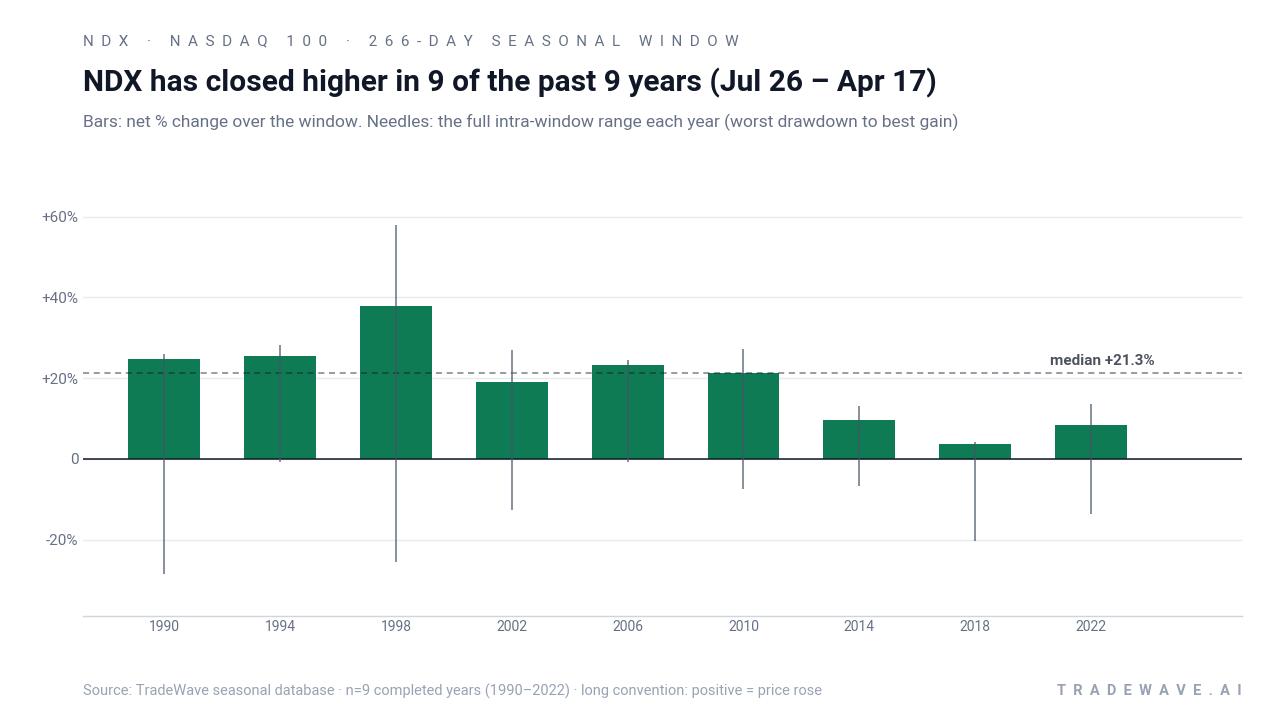
The combined net/MFE/MAE bars make clear that this has been a high-conviction long window historically, but not a low-volatility one. Maximum favorable excursions have often run well ahead of the final net gains, while maximum adverse excursions have at times reached double digits, including drawdowns of about 28.46% in 1990 and 25.46% in 1998 before the index recovered. For traders, that profile means the window has historically rewarded patience in the long direction, but only for those able to tolerate sizable swings along the way.
History does not guarantee future results; adverse excursions (MAE) can be large even in winning windows.
Why does Nasdaq 100 (NDX) follow this seasonal pattern?
This midterm-to-pre-election pattern may reflect how the policy calendar and earnings cycle intersect for large technology and growth companies. Analysts often point to midterm-year policy uncertainty and tighter financial conditions early in the year, followed by clearer fiscal and regulatory signals and improving liquidity as the pre-election year approaches, which can support risk assets. For the Nasdaq 100, whose members are heavily tied to innovation spending and long-duration growth expectations, that shift has historically lined up with stronger performance in this late-midterm window.
What is driving Nasdaq 100 (NDX) today?
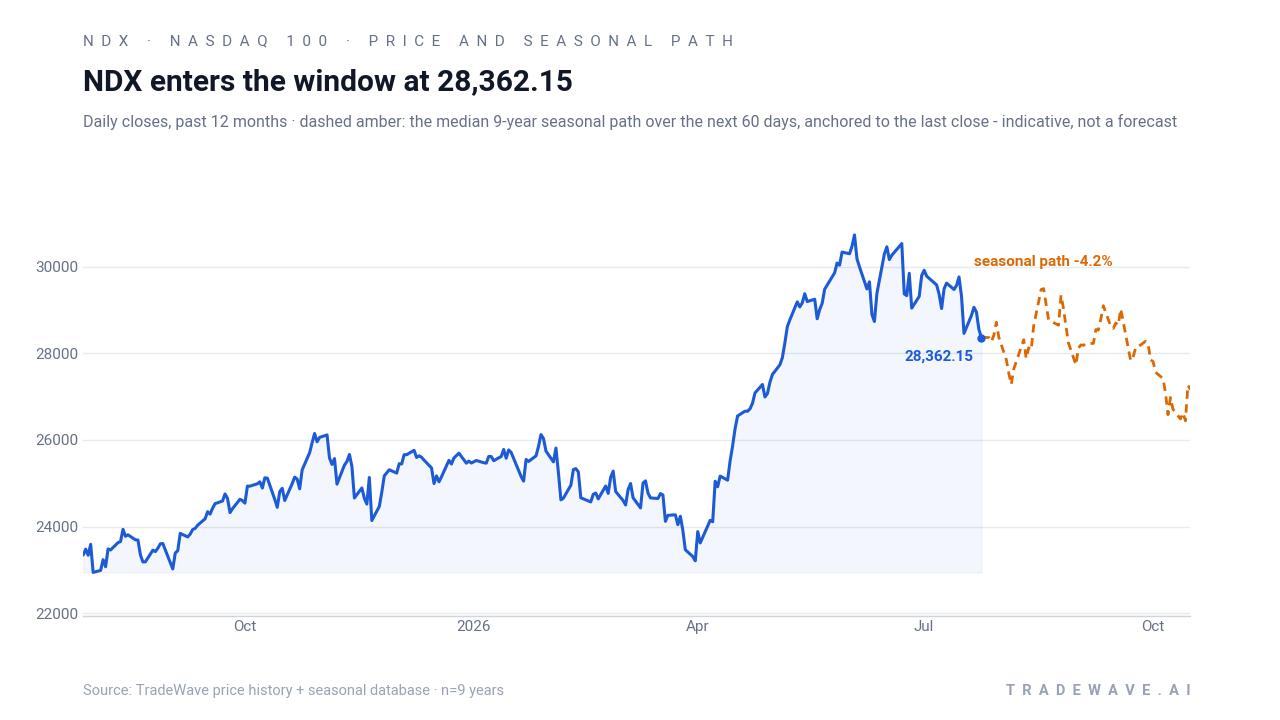
Nasdaq 100 closed the prior session at 29,825.11, up 0.33% on the day, extending a roughly 4.62% gain over the past month. The index is trading about 3.0% below its 52-week high of 30,762.20 and about 31.6% above its 52-week low of 22,669.37, with 20-day average volume running near 10.87 billion shares across its constituents. That backdrop keeps NDX firmly in a bullish trend as investors lean on mega-cap technology and growth names as a barometer for risk appetite and innovation spending.[1]
The chart below situates the latest move in its recent multi-month context and overlays a short-term seasonal projection.
Structurally, the Nasdaq 100 remains dominated by large technology and growth companies, including some of the market’s most closely watched names, which keeps the index at the center of debates about market breadth and tech leadership.[1] In February 2026, Nasdaq proposed a “fast entry” rule to speed the inclusion of large new listings into its benchmarks, a move that could influence the timing and composition of future additions to the Nasdaq 100, though the seasonal pattern discussed here is driven by price history rather than index methodology changes.[1]
What should traders watch as this seasonal window approaches?
With the next 266-day window set to open on Jul 26, the first watchpoint is whether NDX can hold above its 50-day moving average around 29,389 into the start of the pattern. Historically, stronger outcomes in this window have often coincided with the index entering the period in an established uptrend, while weaker but still positive years have tended to feature deeper early drawdowns before recovering.
Macro-wise, the late-midterm to pre-election stretch is typically dense with policy headlines, including fiscal debates, regulatory initiatives and shifting expectations for central bank policy. For a tech-heavy benchmark like the Nasdaq 100, traders will be watching how those developments affect valuations for long-duration growth stories and whether earnings breadth across the index’s largest constituents can keep pace with elevated price levels.[1]
Inside the window itself, behavior around sharp pullbacks will be key. Prior cycles show that maximum adverse excursions have at times reached 20% to nearly 30% before the index ultimately finished the window higher, so the way NDX trades during any mid-window correction will offer an early read on whether this cycle is tracking closer to the smoother paths like 1994 and 2006 or the more volatile arcs like 1990 and 1998. A pattern of buying into those dips, with the index quickly reclaiming key moving averages, would be more consistent with the historical seasonal trend.
Finally, traders should monitor whether leadership within the Nasdaq 100 remains concentrated in a handful of mega-cap names or broadens out across more constituents. A wider advance would align more naturally with the strong historical seasonality of this window, while a narrow, top-heavy rally could leave the index more vulnerable to idiosyncratic shocks even if the seasonal backdrop remains favorable.[1]
Sources
About this seasonal analysis
Seasonal pattern data is sourced from TradeWave.ai, which analyzes historical price behavior across annual calendar windows going back up to 30 years. Read the full data methodology or the book The 100-Year Pattern by Afshin Moshrefi (2026 edition). Past performance of seasonal patterns does not guarantee future results. This article is for informational purposes only and does not constitute investment advice.