Seven-for-Seven: S&P 500 SPDR (SPY) Has Gained in Every Aug. 1 Midterm Window, Averaging 15.07%
S&P 500 SPDR is heading toward a historically powerful midterm-to-pre-election seasonal window, just as traders weigh inflation data and policy risks into 2027.

What is the seasonal pattern for S&P 500 SPDR (SPY)?
S&P 500 SPDR has risen in 7 of 7 midterm-election-year windows starting Aug. 1, with an average gain of 15.07% in winning years.
- 7 for 7 in this window, with winning years averaging 15.07% gains across the last seven midterm election years.
- The upcoming seasonal window begins on Aug. 1, 2026 and runs for 363 trading days, spanning the late midterm year into the pre-election year.
- Percent Profitable is 100%, with 7 winners and 0 losers across the historical sample.
- Cumulative return across those seven windows totals 165%, with a Sharpe ratio of 2.58 on end-of-window outcomes.
- The TradeWave Ratio of 2.03 indicates that price has typically traveled meaningfully in the long direction within the window, not just at the close.
- Individual years have seen sizable drawdowns inside the window even when finishing higher, so intraperiod risk has been real despite the perfect win record.
According to historical data from TradeWave.ai, this midterm-to-pre-election stretch for SPY has behaved very differently from an average year on the calendar. TradeWave.ai’s multi-decade seasonal database flags the Aug. 1 window as one of the most consistently bullish regimes for the S&P 500 SPDR.
How strong is the upcoming seasonal window for S&P 500 SPDR (SPY)?
The seasonal window that begins on Aug. 1 and runs for 363 trading days has delivered gains for S&P 500 SPDR in every one of the last seven midterm election years, averaging 15.07% per cycle. That stretch covers the late part of the midterm election year and extends deep into the year before the presidential election, a phase that has often aligned with strong risk appetite in prior cycles.
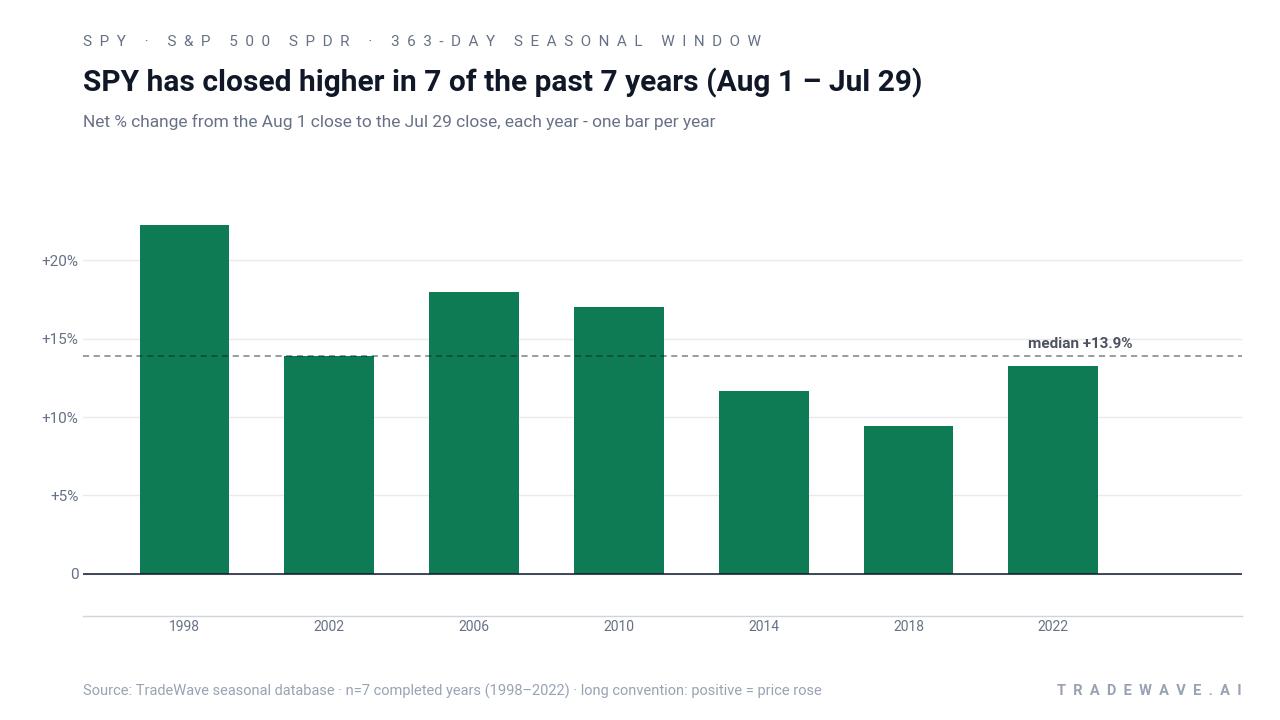
The pattern is built on the last seven midterm election years, so it is not a run of seven consecutive calendar years but seven matching points in the presidential cycle. In each case, a long SPY position held from early August of the midterm year through the following summer finished in the green, with net returns ranging from 9.46% in 2018 to 22.24% in 1998. The median outcome of 13.88% sits just below the average, which suggests the distribution of gains has been relatively tight rather than dominated by a single outlier year.
Grouping by the presidential election cycle matters here because policy and liquidity often follow a four-year rhythm. Midterm years have historically been choppy in the first half, but the late-year into pre-election stretch has tended to see fiscal support, clearer policy guidance and improving earnings breadth, all of which can feed into a stronger SPY seasonal trend in this specific window.
Looking at individual years, 2006 and 2010 both delivered net gains near 18%, while 2014 and 2022 posted more modest but still solid advances of 11.64% and 13.27% respectively. Even the softest outcome, 2018’s 9.46% gain, would qualify as a respectable year for a broad index ETF. Add it up and the cumulative return across the seven midterm-year windows is 165%, which is a sizable contribution for a slice of the calendar that repeats every four years.
The Sharpe ratio of 2.58 on end-of-window results points to a strong risk-adjusted profile for this long-only setup. That figure reflects not just the positive average return but also the relatively low dispersion of outcomes across the sample. For a broad benchmark like SPY, a Sharpe ratio above 2 in a specific calendar regime is unusual and signals that this is not just random noise in the data.
Intraperiod behavior has been more volatile than the smooth win record suggests. In 1998, SPY’s best point-to-peak move inside the window, or maximum favorable excursion, reached 29.37%, but the worst drawdown from entry, or maximum adverse excursion, was a sizable -16.86%. The 2018 window saw a similar pattern, with a -15.9% worst drawdown despite finishing nearly 10% higher than the starting level. Several cycles, such as 2002 and 2022, also experienced double-digit adverse moves before recovering into positive territory.
Other years have been kinder to long holders. In 2006, SPY’s worst drawdown inside the window was only -0.74% while the best run-up reached 24.5%, a near straight-line climb from entry to exit. The 2014 window showed a smaller but still favorable profile, with a -5.05% worst drawdown and a 12.92% peak gain on the way to an 11.64% net result. That mix of “grind higher” years and “whipsaw then recover” years is what sits behind the strong TradeWave Ratio of 2.03.
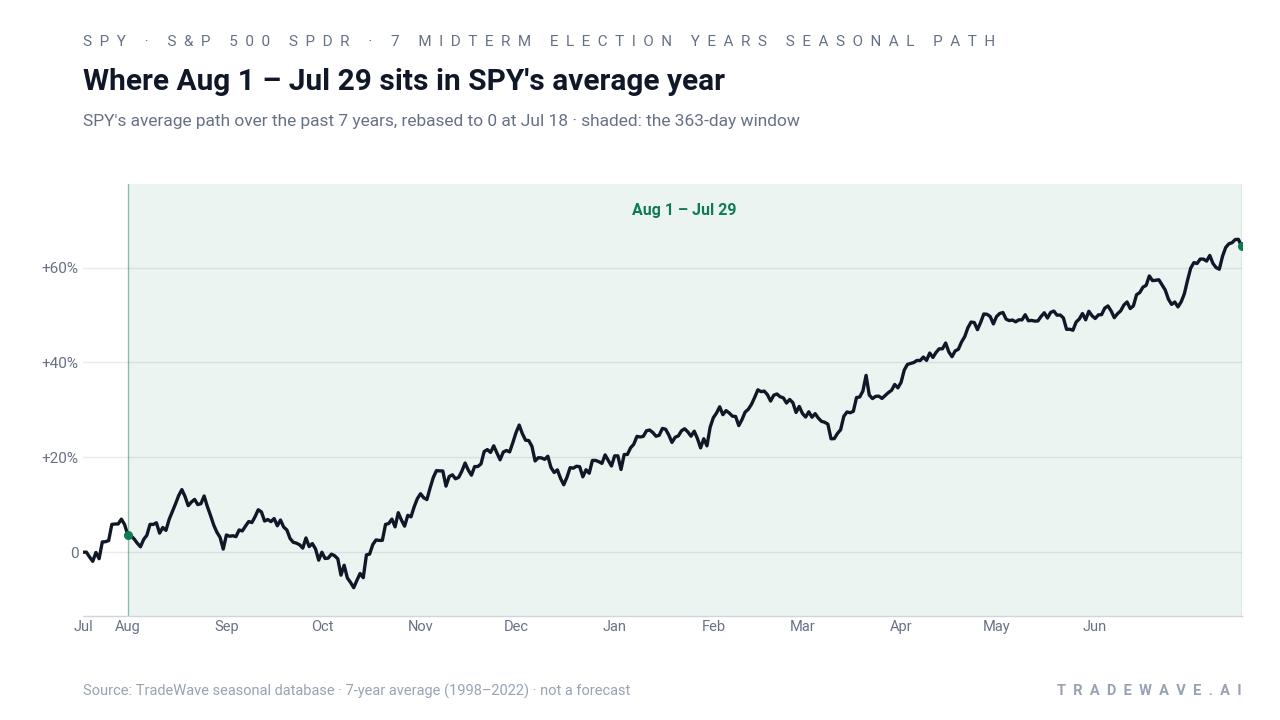
The historical seasonal trend line for this window slopes higher for most of the 363 trading days, with only modest flat spots. The typical pattern shows a constructive bias from the early weeks, followed by a stronger climb as the calendar moves deeper into the pre-election year, consistent with the idea that policy clarity and improving macro visibility support risk assets late in the cycle.
Year-by-year net returns and intraperiod swings show how consistently SPY has finished higher while still experiencing meaningful volatility along the way.
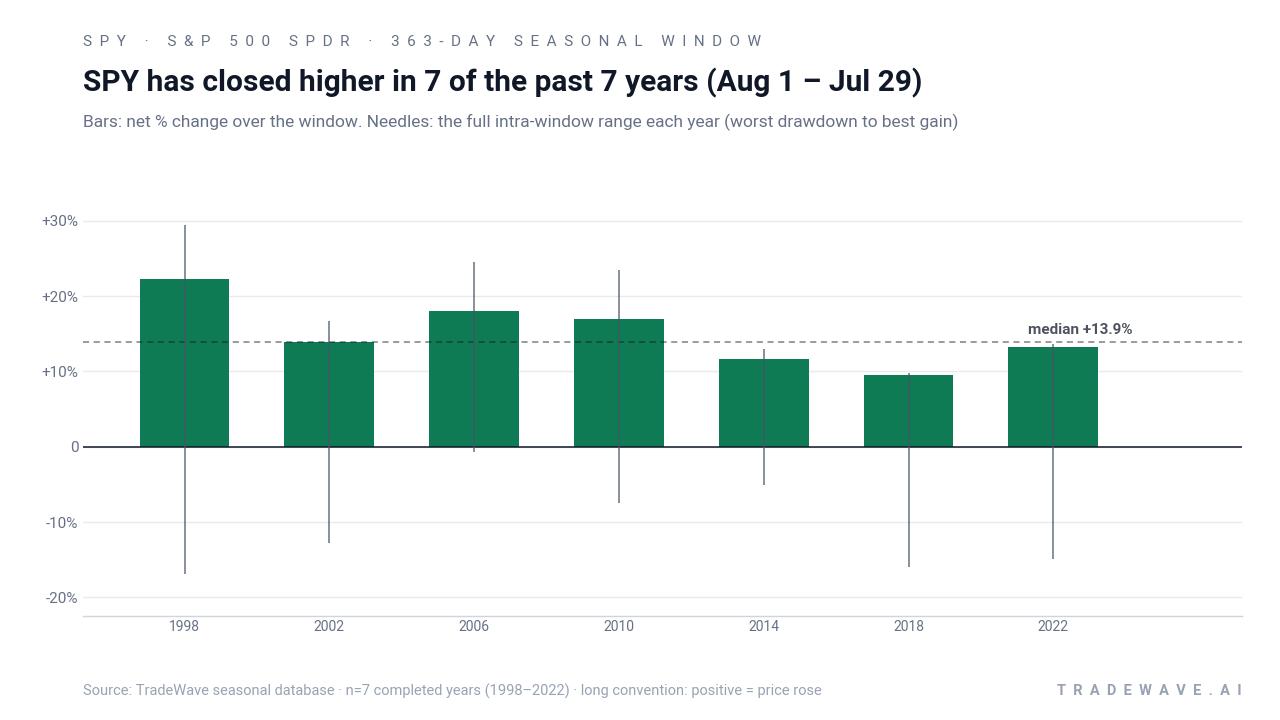
Across the seven cycles, the bars chart shows that maximum favorable moves have often pushed well beyond the final net gain, while maximum adverse moves have at times been deep enough to test conviction. Large positive MFE combined with sizable negative MAE signals a high-variance window where both sharp rallies and sharp pullbacks have been part of the playbook, even though every cycle ultimately closed higher.
History does not guarantee future results; adverse excursions (MAE) can be large even in winning windows.
Why does S&P 500 SPDR (SPY) follow this seasonal pattern?
One likely driver is the way the policy calendar and investor positioning evolve from the back half of the midterm year into the year before the presidential election. Analysts have pointed to a mix of reduced policy uncertainty, fiscal support and improving earnings visibility that often encourages institutions to add equity risk in this phase. The pattern may also reflect systematic rebalancing and sector rotation into growth and large-cap benchmarks like SPY as the pre-election year historically leans more risk-on.
What is driving S&P 500 SPDR (SPY) today?
With the next seasonal window still a few weeks away, near-term trading in SPY is being steered more by macro data than by the calendar. Investors are focused on the Core PCE price index as a key inflation gauge that could influence expectations for Federal Reserve policy and, by extension, valuations across the S&P 500.[1] Tech and other large-cap growth names, including NVIDIA, remain central drivers of index-level moves, so any shift in sentiment around those leaders can quickly ripple through SPY.[1]
The chart below situates the latest moves in SPY within its recent 12-month range and overlays a short-term seasonal projection.
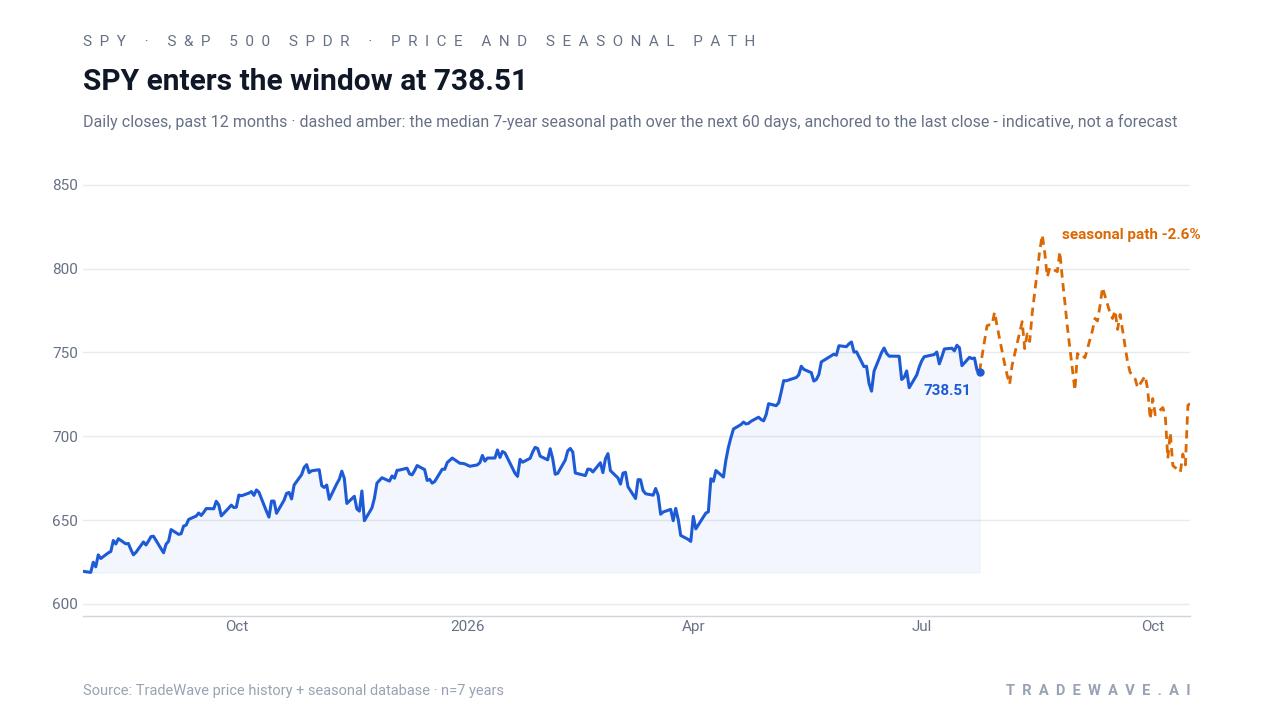
Macro-sensitive traders are watching how SPY reacts around inflation releases and big-tech earnings as a tell for broader risk appetite.[1] A firm response to softer inflation or resilient earnings could keep the ETF near the upper end of its recent range heading into August, while a hawkish surprise or disappointment from mega-cap leaders could leave it consolidating or correcting just as the historically strong midterm-year window opens.
What should traders watch as the Aug. 1 SPY window approaches?
First, the macro calendar. The Core PCE inflation print and any shifts in Fed rhetoric will shape how much policy support or resistance SPY faces as it moves into a historically bullish seasonal stretch.[1] A backdrop of easing inflation and stable growth has aligned with some of the stronger historical outcomes in this midterm-to-pre-election window.
Second, the behavior of large-cap growth and tech. Because names like NVIDIA carry outsized weight in the S&P 500, sustained strength or weakness in that cohort will likely determine whether SPY can track anything close to its historical seasonal trend.[1] If leadership broadens beyond a handful of mega caps, that would be more consistent with the robust average gains seen in prior cycles.
Third, price levels and volatility inside the window. Historically, several of the winning years still saw double-digit drawdowns before finishing higher, so traders may want to monitor how SPY behaves on pullbacks once the window opens. A pattern of shallow, bought dips would rhyme more with years like 2006 and 2014, while deeper shakeouts followed by recoveries would look more like 1998, 2018 or 2022.
Finally, watch how closely the real-world tape tracks the seasonal roadmap. If SPY enters August with constructive breadth and responds positively to macro data, a continuation of that tone into the pre-election year would fit the seven-for-seven historical record. If instead the ETF struggles to hold rallies or reacts poorly to policy headlines, that would be an early sign that this cycle may diverge from the otherwise powerful seasonal pattern.
Sources
About this seasonal analysis
Seasonal pattern data is sourced from TradeWave.ai, which analyzes historical price behavior across annual calendar windows going back up to 30 years. Read the full data methodology or the book The 100-Year Pattern by Afshin Moshrefi (2026 edition). Past performance of seasonal patterns does not guarantee future results. This article is for informational purposes only and does not constitute investment advice.