10-for-10 Midterm Streak: S&P Global (SPGI) Has Averaged 22% Gains From Jul 13 Window
S&P Global is about to enter a midterm-election-year seasonal window that has never produced a loss in the last 10 cycles, even as the stock trades well below its 52-week high and investors weigh guidance and AI disruption risks.
Price as of Jul 10, 2026: $430.50 (last close).

What is the seasonal pattern for S&P Global (SPGI)?
S&P Global has risen in 10 of 10 midterm-election-year windows starting Jul 13 and lasting 364 days, with an average gain of 22.18% in winning years.
- 10 for 10 in this window, averaging 22.18% gains in winning years across the last 10 midterm election cycles.
- Seasonal window runs from Jul 13 for 364 trading days, covering the back half of the midterm election year into the pre-election year.
- Percent Profitable is 100%, with 10 winners and 0 losers in the historical sample.
- Median profit of 21.95% and annualized return of 21.85% point to a consistently strong SPGI seasonal trend in this regime.
- TradeWave Ratio of 1.91 and Sharpe ratio of 1.91 indicate historically strong upside travel in the trade direction relative to volatility.
- Individual years still saw sizable drawdowns inside the window, with adverse moves as deep as roughly 27% before finishing higher.
According to historical data from TradeWave.ai, this upcoming midterm-to-pre-election stretch has behaved very differently from an average year for S&P Global. The next section looks at how that election-cycle pattern has played out in prior decades and what it implies for the new window that opens today.
How has S&P Global (SPGI) traded in this midterm-year seasonal window?
S&P Global has risen in every one of the last 10 midterm-election-year windows that start around Jul 13 and run for 364 trading days, averaging 22.18% gains with no losing years. The new window begins today with SPGI closing at 430.50, about 20.1% below its 52-week high of roughly 538.75 and still well above its 52-week low near 357.69. That combination of a strong historical seasonality profile and a stock trading at a discount to its recent peak gives this window unusual weight for investors trying to map the next year of returns.
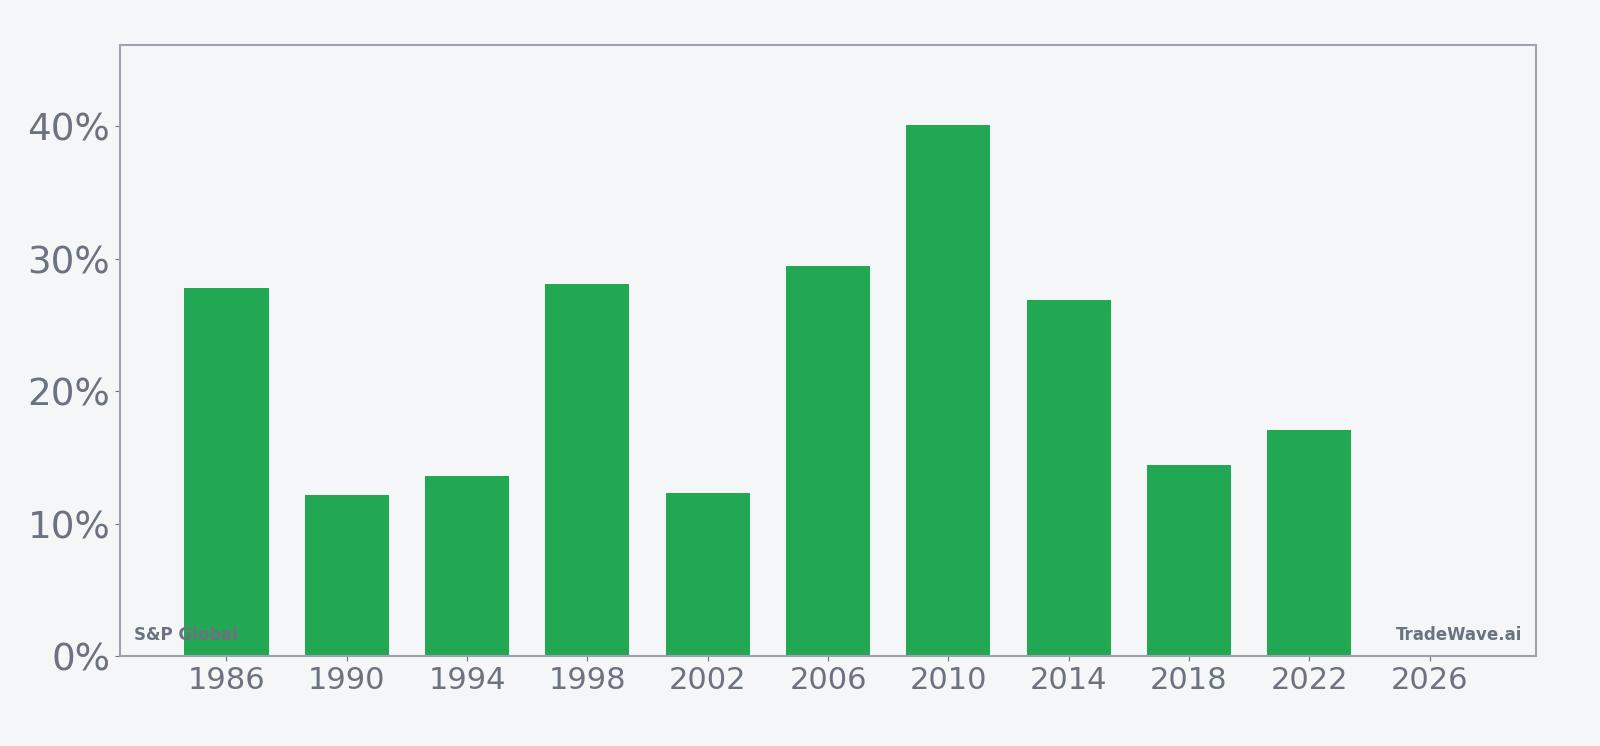
Grouping the data by the presidential election cycle matters here because this window straddles the back half of the midterm election year and the start of the year before the presidential election, a phase that has often coincided with clearer policy visibility and stronger risk appetite across U.S. equities. For a financial information and analytics heavyweight like S&P Global, that backdrop has historically lined up with rising demand for benchmarks, ratings and data as investors reposition for the next leg of the cycle.
Across the 10 historical midterm-election-year samples, the long trade direction has been clearly aligned with the outcome: every window finished positive, with net returns ranging from 12.2% in 1990 to 40.1% in 2010. Average profit of 22.18% and a median of 21.95% show that the typical year has delivered a double-digit gain, not just a handful of outliers pulling up the mean.
The intraperiod path has not been smooth, though. Maximum favorable moves inside the window have run as high as 50.10% in 2006 and 47.25% in 1998, while the worst drawdowns from entry have reached as deep as about 27.33% in 1990 and 25.23% in 2018. In plain English, SPGI has often given traders both a sizable scare and a sizable rally within the same 364-day stretch before ending higher.
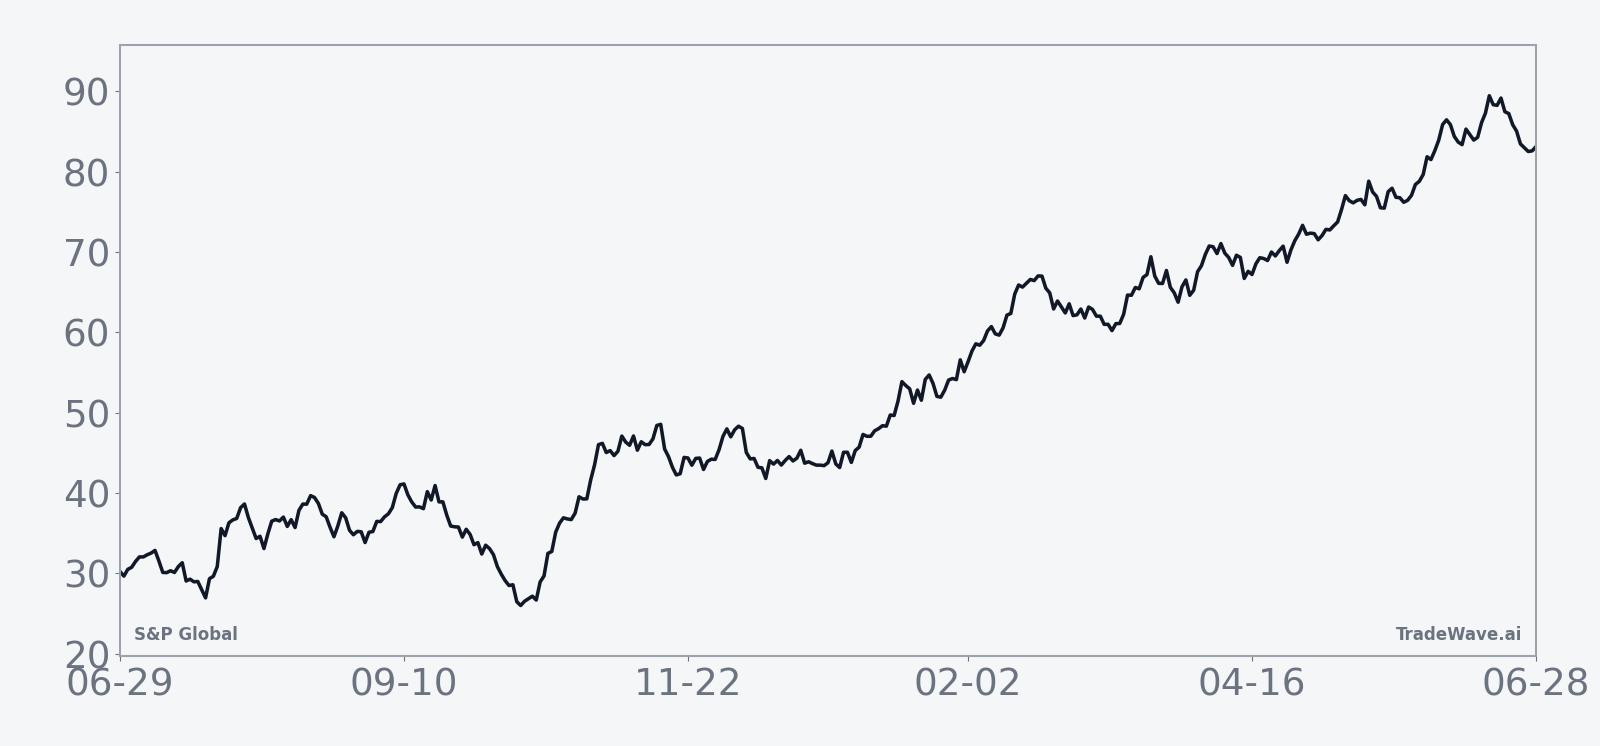
The historical seasonal trend chart shows a fairly steady upward slope across the window, with gains accruing through both the late midterm year and into the pre-election year rather than clustering in a single month. That steady climb suggests the SPGI seasonal trend in this regime has been more about persistent strength than one-off spikes, even though individual years still saw sharp swings around that average path.
A closer look at yearly net returns and intraperiod swings shows how upside and downside have coexisted in this window.
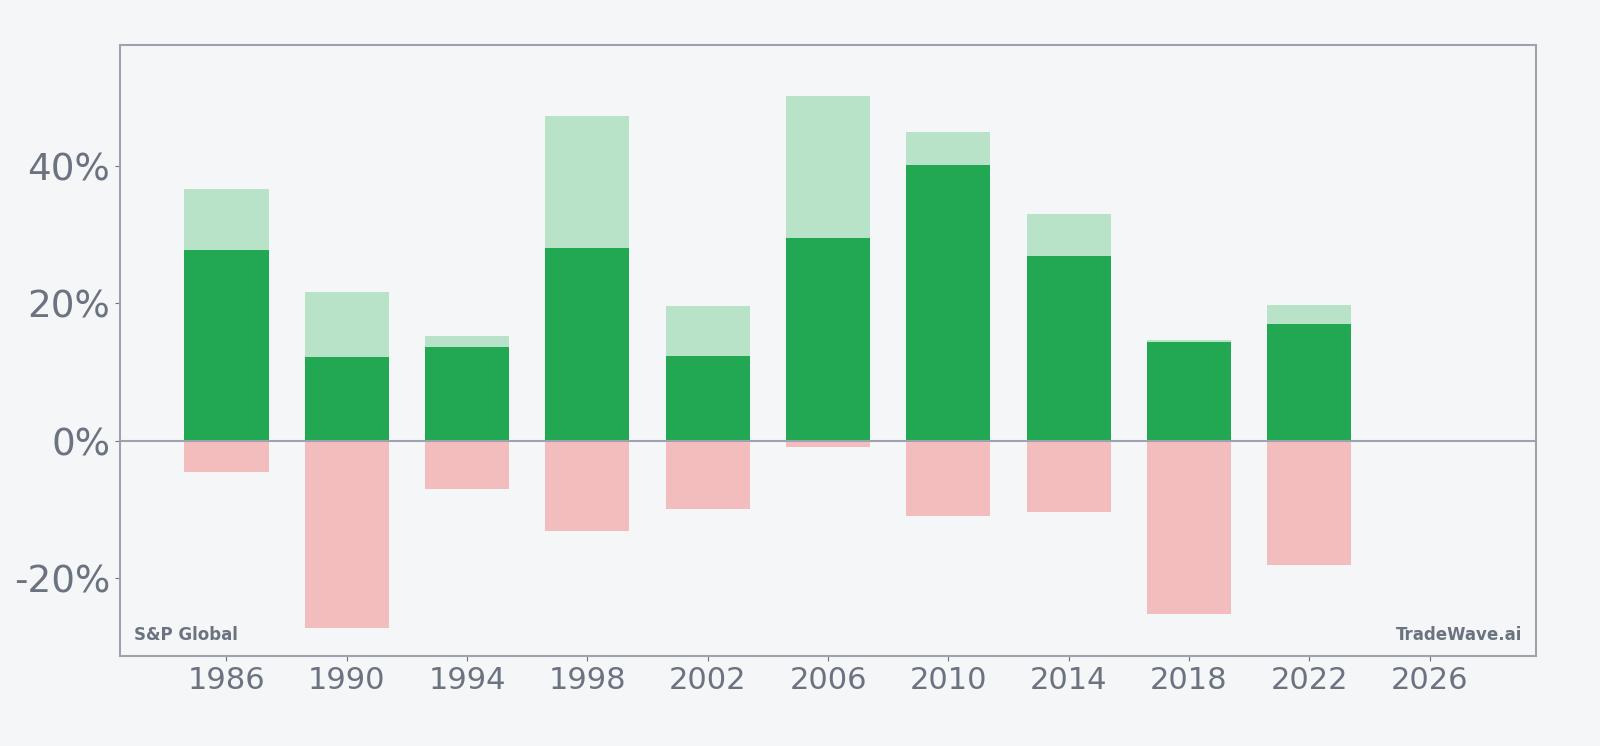
Those bars make the pattern clear: every bar ends above zero, but the red adverse segments in years like 1990, 2018 and 2022 show that SPGI has often endured double-digit drawdowns on the way to those gains. Large maximum favorable excursions paired with sizable maximum adverse excursions point to a high-variance window where the long side has ultimately won out, but only after tolerating meaningful volatility.
History does not guarantee future results; adverse excursions can be large even in winning windows, and traders can still lose money if they are forced out during drawdowns.
Why does S&P Global (SPGI) follow this seasonal pattern?
One likely driver is the way the presidential election cycle shapes risk appetite, with the back half of the midterm year and the following pre-election year often seeing improving policy visibility and stronger equity flows. Analysts have also pointed to institutional portfolio rebalancing and sector rotation into quality growth and data-heavy financials during this phase, which can favor a benchmark and analytics provider like S&P Global. The pattern may also reflect how SPGI’s earnings calendar and guidance updates cluster around this stretch, giving investors repeated catalysts to re-rate the stock as macro and regulatory uncertainty clears.
What is driving S&P Global (SPGI) today?
S&P Global shares closed Monday at 430.50, down 0.6% on the day, after trading between 427.06 and 440.61 in a session that left the stock roughly 20.1% below its 52-week high of about 538.75 and about 20.4% above its 52-week low near 357.69. Average 20-day volume sits around 2.78 million shares, well above Monday’s roughly 1.31 million, suggesting the latest pullback came on lighter-than-normal activity rather than a rush for the exits.
In February 2026, S&P Global’s forecast for 2026 adjusted earnings of $19.40 to $19.65 per share came in below the then-analyst average of about $19.94, triggering a sharp selloff as investors questioned how AI-driven disruption might affect the company’s growth trajectory.[3] In April 2026, the company reported first-quarter revenue of $4.17 billion, up 10%, and earnings of $4.69 per share, with management highlighting strong demand for analytics and risk assessment tools amid geopolitical uncertainty.[4] In February 2026, a separate valuation piece noted that SPGI was trading roughly 32% cheaper on a price-to-sales basis than a year earlier, even as margins and subscription revenue growth in Market Intelligence and Ratings remained robust.[1]
The chart below situates the latest move in its recent multi-month context and overlays a short-term seasonal projection.
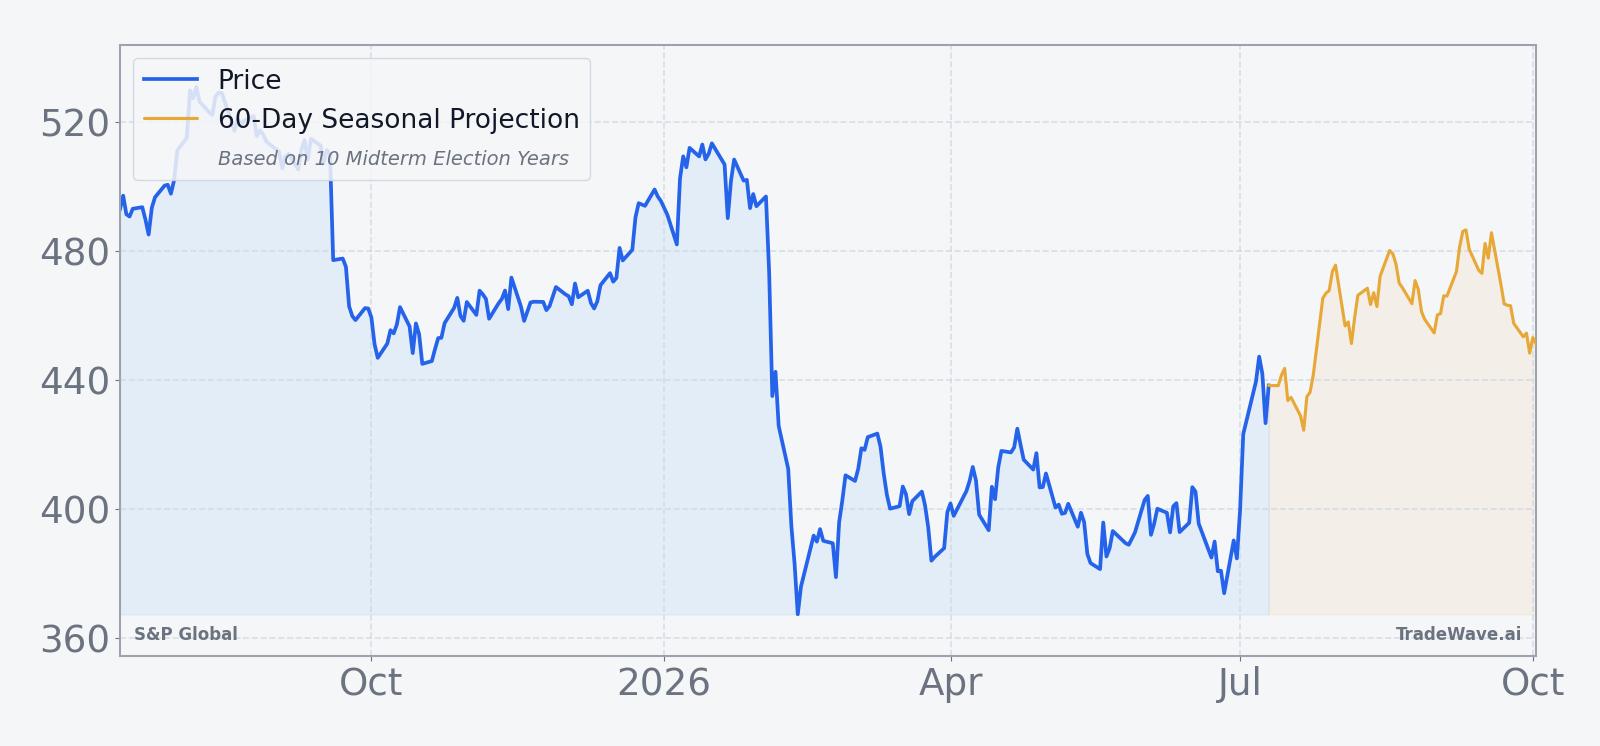
For context, S&P Global operates at the center of the financial information and analytics sector, benefiting when volatility and geopolitical uncertainty push investors toward more data and risk tools.[4] At the same time, the February 2026 guidance shock showed how quickly sentiment can swing when markets worry that AI could compress pricing power or erode parts of the franchise, even if proprietary data and entrenched benchmarks ultimately prove resilient.[3] Against that backdrop, the historically strong SPGI seasonal pattern that begins each mid-July in midterm election years offers a contrasting lens on a stock that has already repriced meaningfully from its highs.
What should traders watch in this S&P Global (SPGI) seasonal window?
First, the calendar itself matters. This 364-day SPGI trading window sits inside the broader midterm-to-pre-election phase that has often been supportive for U.S. equities, so traders will be watching whether the stock behaves in line with that historical seasonality or diverges. A pattern of higher highs and higher lows over the coming quarters, even through bouts of volatility, would be consistent with the 10-for-10 record; a sustained break toward the 52-week low without recovery would mark a clear departure from the historical script.
Second, earnings and guidance updates will be key checkpoints. Any revisions to the 2026 outlook or commentary on AI, pricing and demand for analytics will help determine whether February’s guidance scare was a one-off reset or the start of a slower growth phase.[3][4] Stronger-than-feared revenue growth or margin resilience would fit the historical pattern of SPGI grinding higher through this window, while repeated disappointments could overwhelm even a powerful seasonal tailwind.
Third, traders should keep an eye on volume and volatility around macro and policy events that matter for credit markets and risk appetite, since those are the environments where S&P Global’s benchmarks and ratings are most in focus.[4] If the stock continues to absorb bad news on lighter volume and finds support on pullbacks, that would echo prior midterm-year windows where sizable intraperiod drawdowns ultimately gave way to strong full-window gains.
Finally, the behavior of the broader financial information and analytics sector will help confirm or challenge the SPGI seasonal trend. If peers also see improving demand and stable pricing as the pre-election year approaches, it would reinforce the idea that this window reflects a structural election-cycle pattern rather than a company-specific quirk. If SPGI lags while the group strengthens, traders may treat any seasonal strength as an opportunity to reassess idiosyncratic risks rather than a simple tailwind.
Sources
- Forbes: "S&P Global Stock Now 32% Cheaper: Is It Time To Buy?" (Feb 12, 2026)
- Reuters: "S&P Global forecasts annual profit above estimates on strong demand" (Jul 31, 2025)
- Reuters: "S&P Global forecasts 2026 profit below estimates, shares plunge" (Feb 10, 2026)
- Reuters: "S&P Global reports higher first-quarter profit on demand for analytics products" (Apr 28, 2026)
About this seasonal analysis
Seasonal pattern data is sourced from TradeWave.ai, which analyzes historical price behavior across annual calendar windows going back up to 30 years. Read the full data methodology or the book The 100-Year Pattern by Afshin Moshrefi (2026 edition). Past performance of seasonal patterns does not guarantee future results. This article is for informational purposes only and does not constitute investment advice.