This Midterm Window Has Delivered Mostly Downside for Mosaic Company (The) (MOS)
Mosaic Company (The) is rallying hard even as it moves through a midterm-election-year stretch that has usually favored downside and sharp swings.

Key takeaways
- Mosaic Company (The) is in a 120-day midterm-election-year window that historically favors short setups, with a clear downside bias.
- The pattern covers the last 9 midterm election years, with 7 winners and 2 losers for the short direction, or 78% profitable trades.
- Average gain in winning short years is 16.52%, while including all years brings the average move to 10% in favor of the short side.
- Intraperiod swings have been large, with several years showing double-digit peak rallies against the short before deeper declines.
- Today’s 7.6% jump to 31.36 comes inside that historically weak stretch, setting up a tension between price momentum and the seasonal record.
- History does not guarantee a repeat, but prior midterm windows have often delivered fast, volatile moves in MOS rather than quiet drift.
According to historical data from TradeWave.ai, this specific midterm-election-year stretch in Mosaic has behaved very differently from an average quarter, with a distinct directional bias that many investors may not have on their radar.
Seasonal window
Mosaic Company (The) has moved in favor of the short side in 7 of the last 9 midterm-election-year windows starting around Mar 10, with average winning short gains of 16.52%. Shares closed Friday at 31.36, up 7.6% on the day, even as the stock trades inside this historically weak 120-day stretch that runs through early summer. That combination of a strong short-side seasonal record and a sharp near-term rally sets up a classic tug-of-war between trend followers and traders who watch the election cycle.
Grouping the data by the presidential election cycle matters here because midterm years often bring policy uncertainty around farm subsidies, trade and environmental rules, which can hit fertilizer names differently than broad equity benchmarks. This window sits in the early part of the midterm election year, a phase that has historically been choppier for cyclicals even when the longer midterm-to-pre-election regime eventually turns more supportive for risk assets.
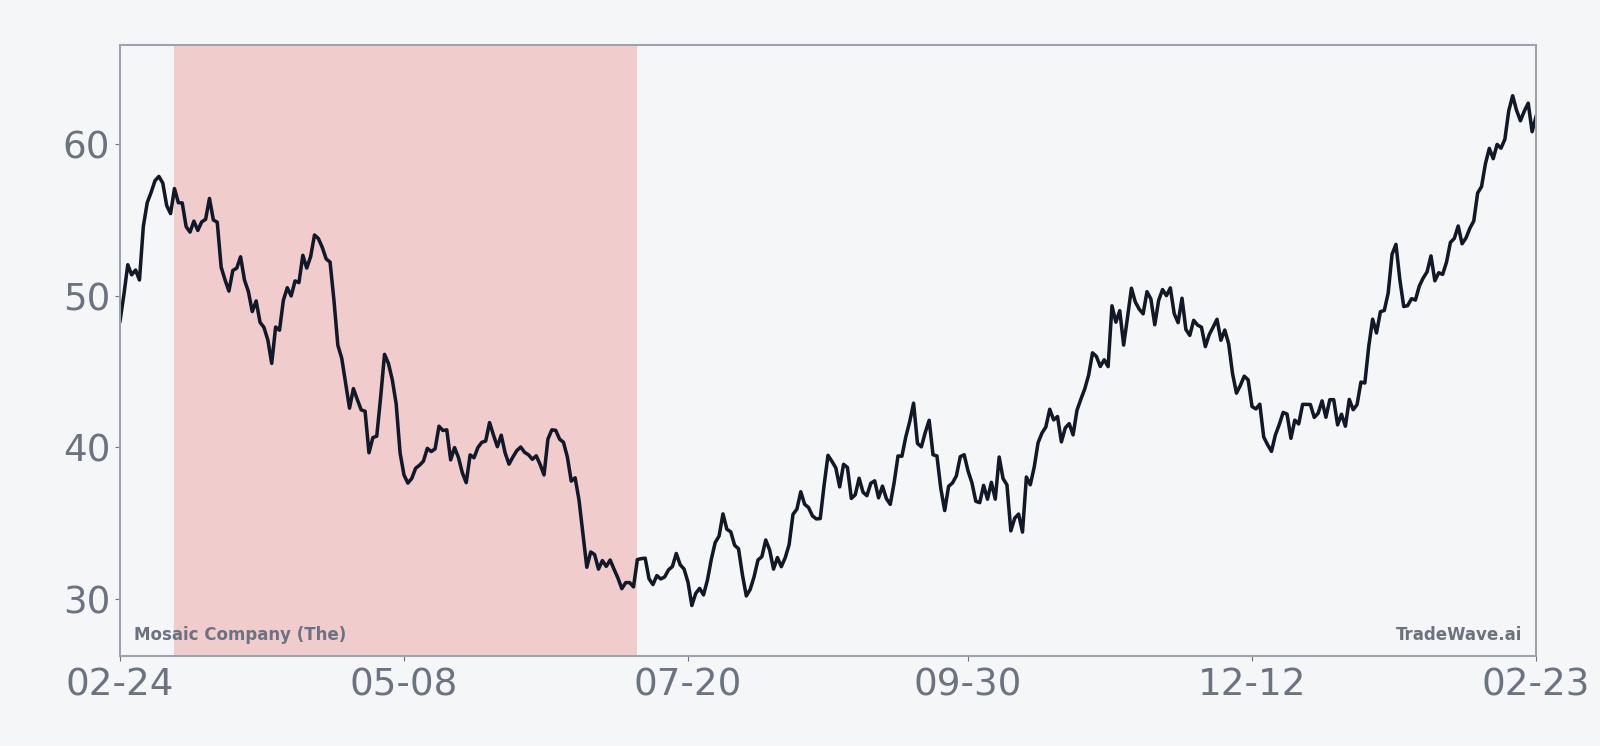
The historical average path for this window shows Mosaic often starting the period with sideways-to-slightly-higher trade before rolling over more decisively later in the 120 days. That fits a pattern where early optimism around planting season or crop prices can give way to margin pressure, policy noise or broader risk-off episodes as the midterm year develops.
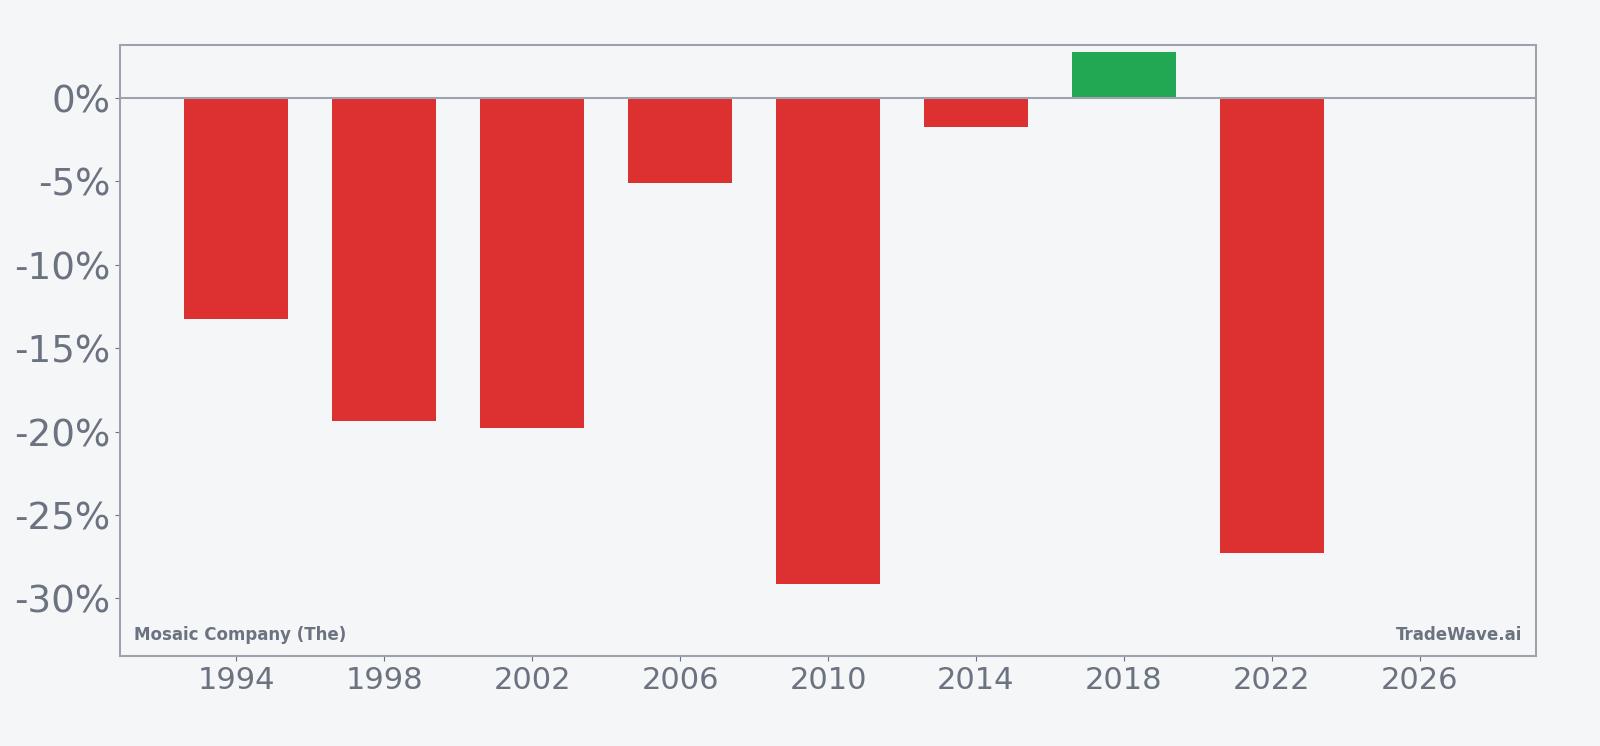
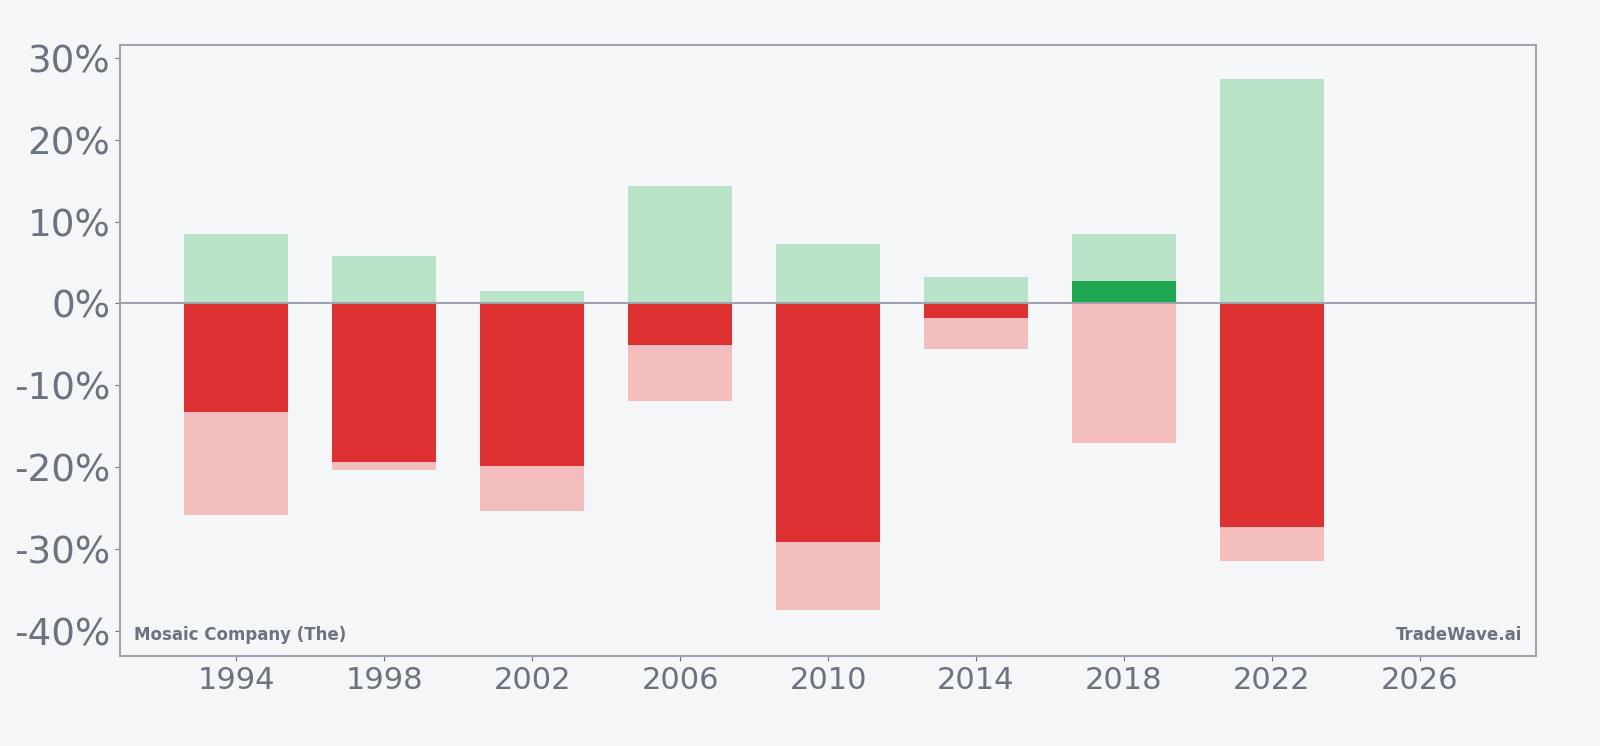
A closer look at yearly net returns alongside peak rallies and drawdowns shows how violent individual cycles have been.
Across individual years, the short side has seen some very strong outcomes. In 2010, for example, the net move in this window was a 29.11% decline, while 2022 delivered a 27.26% drop from entry to exit. Even the softer winning years, such as 2006 and 2014, still finished lower, though by single digits.
The losing years for the short pattern have been more modest in number but still instructive. In 2018, Mosaic actually finished the window up 2.77%, a losing outcome for shorts, yet the stock still saw a maximum adverse move of 17.09% against the short before settling near flat. That kind of path shows how a short setup can be right on direction at times during the window but still end up losing money if timing is off.
Intraperiod swings have been large in both directions. In 2022, Mosaic’s maximum favorable move for the short was 27.48%, but the worst drawdown against the position reached 31.5% at one point. Earlier cycles like 1994 and 2002 also saw adverse excursions of roughly a quarter of the entry price before the trade moved back in favor of the short. For traders, that MAE profile means risk management has historically mattered as much as the final direction.
Put together, the pattern is clear: this midterm-year window has usually rewarded patience on the short side, but it has rarely been a smooth ride. The combination of a 78% win rate for shorts, double-digit average gains in winning years and repeated double-digit intraperiod rallies against the trade paints a picture of a volatile, downside-biased stretch rather than a gentle drift lower.
History does not guarantee future results; adverse excursions (MAE) can be large even in winning windows.
Price and near-term drivers
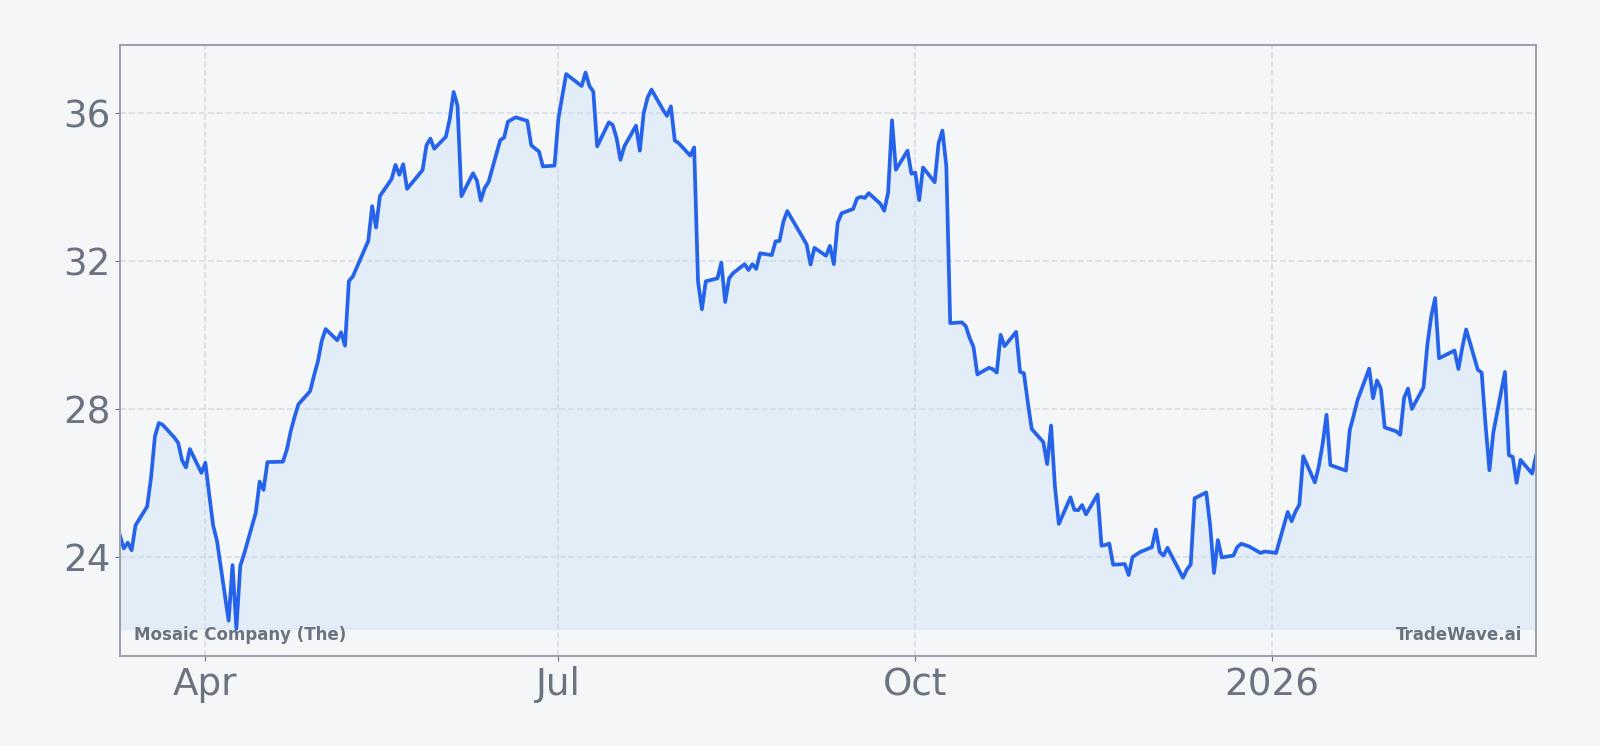
Mosaic shares jumped 7.6% Friday to 31.36, with roughly 27.8 million shares changing hands, far above the 20-day average volume of about 9.1 million. The stock has climbed from a 52-week low near 21.40 and remains below its 52-week high around 37.03, with the latest close sitting above the 50-day moving average of 27.63, a sign that short-term momentum has turned higher.
That price action comes as investors continue to debate Mosaic’s role in the fertilizer and agriculture complex. In October 2025, a Seeking Alpha analysis described Mosaic as evolving from a pure commodity producer into a strategic agriculture partner, arguing that the company’s long-term value case rests on deeper integration with growers and more stable earnings streams rather than just spot fertilizer prices.[1] That strategic shift, if it continues, could change how the stock trades around policy headlines on trade, environmental rules and farm support in this midterm year.
The chart below situates the latest move in its recent multi-month context.
Macro and election-cycle backdrop
The current year sits in the midterm slot of the U.S. presidential cycle, a phase that often brings more noise around fiscal priorities, regulation and trade. For Mosaic, that can intersect directly with demand for fertilizers and the profitability of its farmer customers, since policy shifts on biofuels, export rules or environmental standards can alter planting decisions and input spending.
Midterm years also tend to feature a two-playbook structure for cyclicals. Early in the year, markets often wrestle with policy uncertainty and slower earnings revisions, which can weigh on value and commodity-linked names. Later in the cycle, once the policy path is clearer and the market starts to look ahead to the pre-election year, risk appetite can improve. Mosaic’s seasonal pattern in this 120-day window sits squarely in that earlier, more volatile phase.
For investors who view Mosaic as a strategic agriculture partner rather than a pure commodity bet, the key question is how that evolving business mix interacts with this historical pattern.[1] If the company’s earnings stream becomes less tied to spot fertilizer prices and more to long-term service and partnership contracts, the stock’s sensitivity to midterm-year policy shocks could fade over time. For now, though, the historical record still shows a tendency for sharp, often downward moves in this specific stretch of the calendar.
What to watch in this window
First, watch how Mosaic behaves around the 30 to 32 zone where it is trading after Friday’s spike. In prior midterm-year windows, strong early rallies have sometimes marked the start of larger swings rather than the end of them, with the stock later reversing lower as the window progressed.
Second, monitor volume and volatility. The current session’s turnover already dwarfs the recent 20-day average, and prior cycles in this window have seen big intraperiod rallies and selloffs rather than quiet consolidation. Sustained heavy volume on down days would be more consistent with the historical short-side bias, while light-volume pullbacks after a big rally would argue for a more benign setup.
Third, keep an eye on the policy calendar. Any headlines around farm support programs, trade restrictions on key crop-exporting regions or environmental rules affecting fertilizer production could act as catalysts inside this historically sensitive window. The more those headlines cluster in the coming weeks, the more room there is for Mosaic to trace out the kind of jagged path seen in earlier midterm years.
Finally, track how Mosaic trades relative to its 50-day moving average and the broader fertilizer group. A decisive break back below the 50-day line with expanding volume would echo the downside tendencies of past midterm windows. On the other hand, if the stock can hold above that support and grind higher despite the seasonal headwind, it would be an early sign that Mosaic’s evolving role in agriculture may be reshaping its election-cycle playbook.[1]