9-of-10 Record: Costco (COST) Enters a 155-Day Window That’s Usually Been a Winner
Costco just stepped into a historically powerful 155-day stretch as shares trade near record highs, putting a rich valuation up against one of the stock’s strongest calendar patterns.

Key takeaways
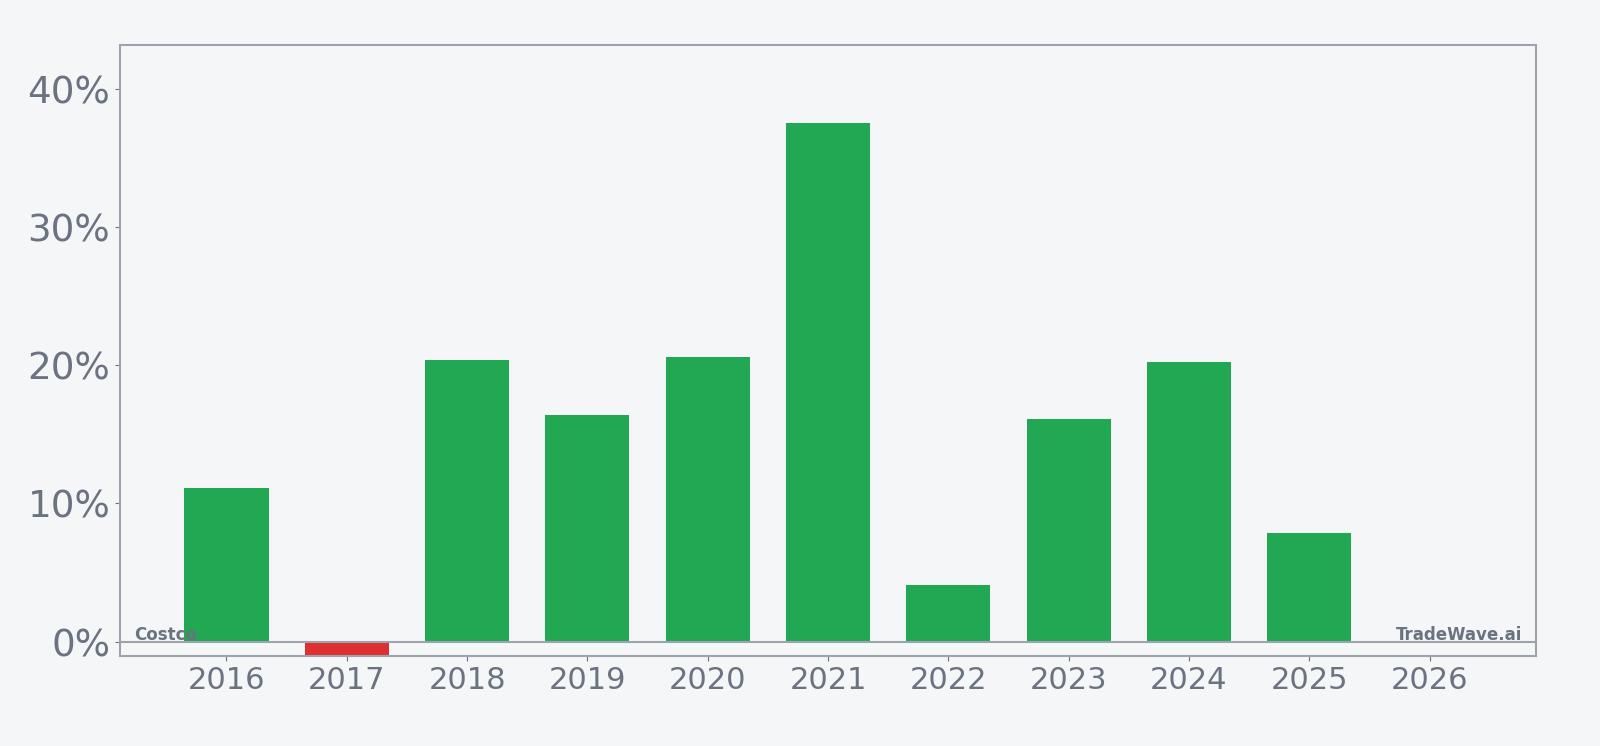
- Costco’s 155-day window that began Mar 14 has been bullish, with gains in 9 winners versus 1 loser over the past 10 years.
- Long trades in this stretch have averaged a 17.16% profit in winning years, while the all-years average including the lone loss is still a strong 15%.
- The pattern is long-directional, with a TradeWave Ratio of 2.74 and a Sharpe ratio of 1.27, pointing to historically favorable risk-adjusted upside.
- Intraperiod swings have been meaningful: some years saw double-digit peak run-ups, while others experienced notable drawdowns before finishing higher.
- Shares closed at $1,008.43 on Mar 16, about 4.7% below the 52-week high of $1,058.23, keeping the stock in striking distance of fresh records.
- Rich valuation and legal scrutiny around Costco’s membership model meet a historically strong seasonal tailwind, a mix that could amplify volatility into late summer.[5][7][9]
According to historical data from TradeWave.ai, this mid-March window has behaved very differently from an average stretch on Costco’s calendar, and the next 155 days sit inside one of the stock’s most consistent long-biased regimes.
Seasonal window
Costco has risen in 9 of the past 10 years during this 155-day window, averaging 17.16% gains in the winning seasons. The current iteration began on Mar 14 with the stock at $1,008.43, about 4.7% below its 52-week high of $1,058.23, leaving room above if the pattern repeats.
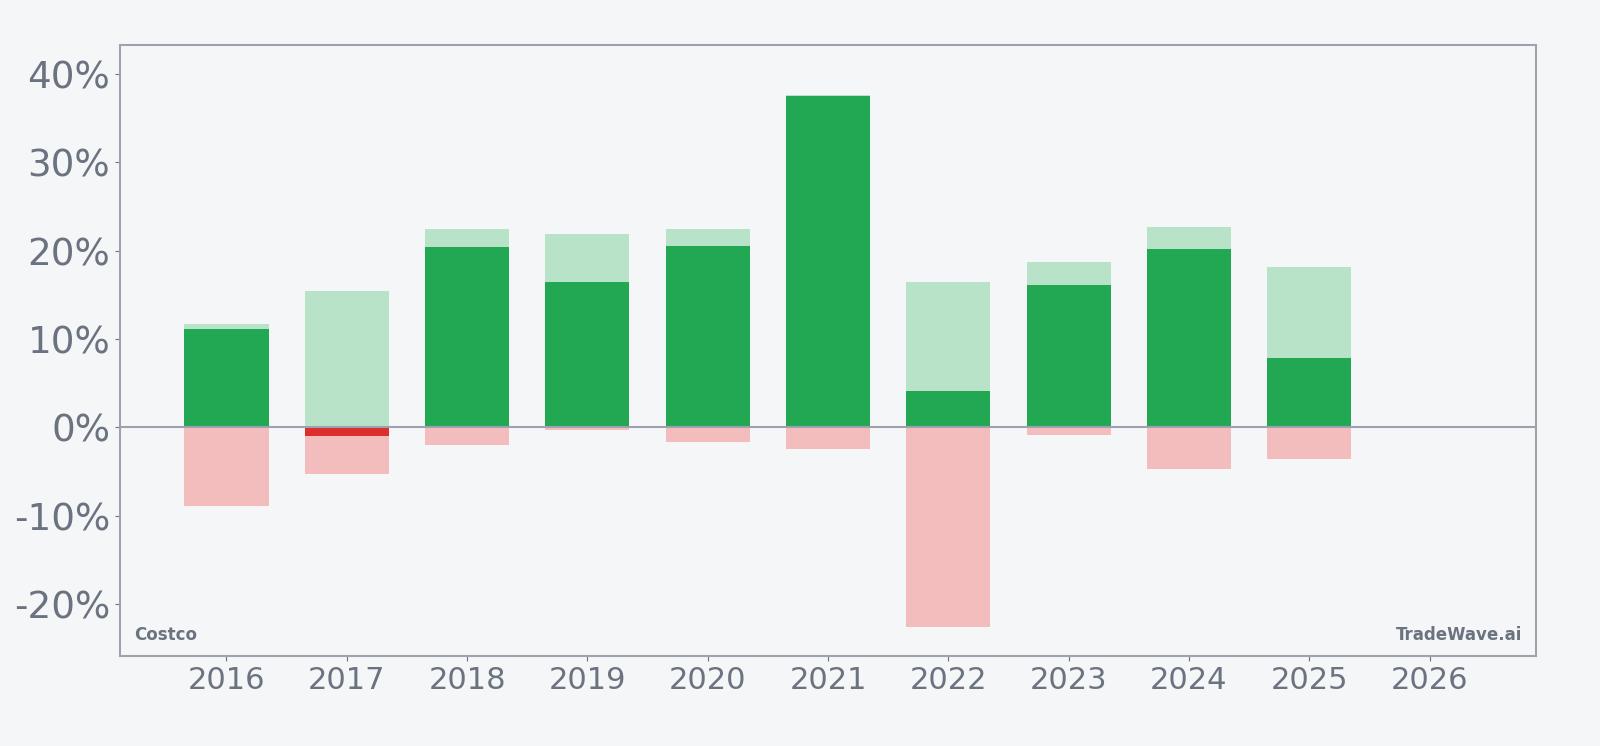
Stacked bars of net returns with peak run-ups and worst drawdowns show how far Costco has tended to travel inside this window.
Across the decade, the long setup has been dominant: 9 winners against just 1 losing year, with a 15% average gain even after including that down season. The median outcome of 16.28% sits close to the average, which suggests the pattern has not been skewed by a single outlier year.
The strongest run came in 2021, when Costco rallied 37.57% during the window after entering around $313 and exiting near $430, with the best intraperiod move almost matching that final gain. The weakest outcome was 2017, the lone losing year, which finished down 0.94% despite a maximum favorable move of 15.38% and a drawdown of 5.28%, a reminder that strong rallies inside the window have not always stuck by the close.
The maximum favorable moves in many years have been sizable, often in the mid-teens to low 20s in percentage terms, which lines up with the 2.74 TradeWave Ratio that tracks how far price typically travels in the trade direction within the window. At the same time, adverse excursions have occasionally been sharp, such as a roughly 22.58% drawdown in 2022 before the stock still finished that window up 4.11%, showing that even winning seasons have demanded a strong stomach.
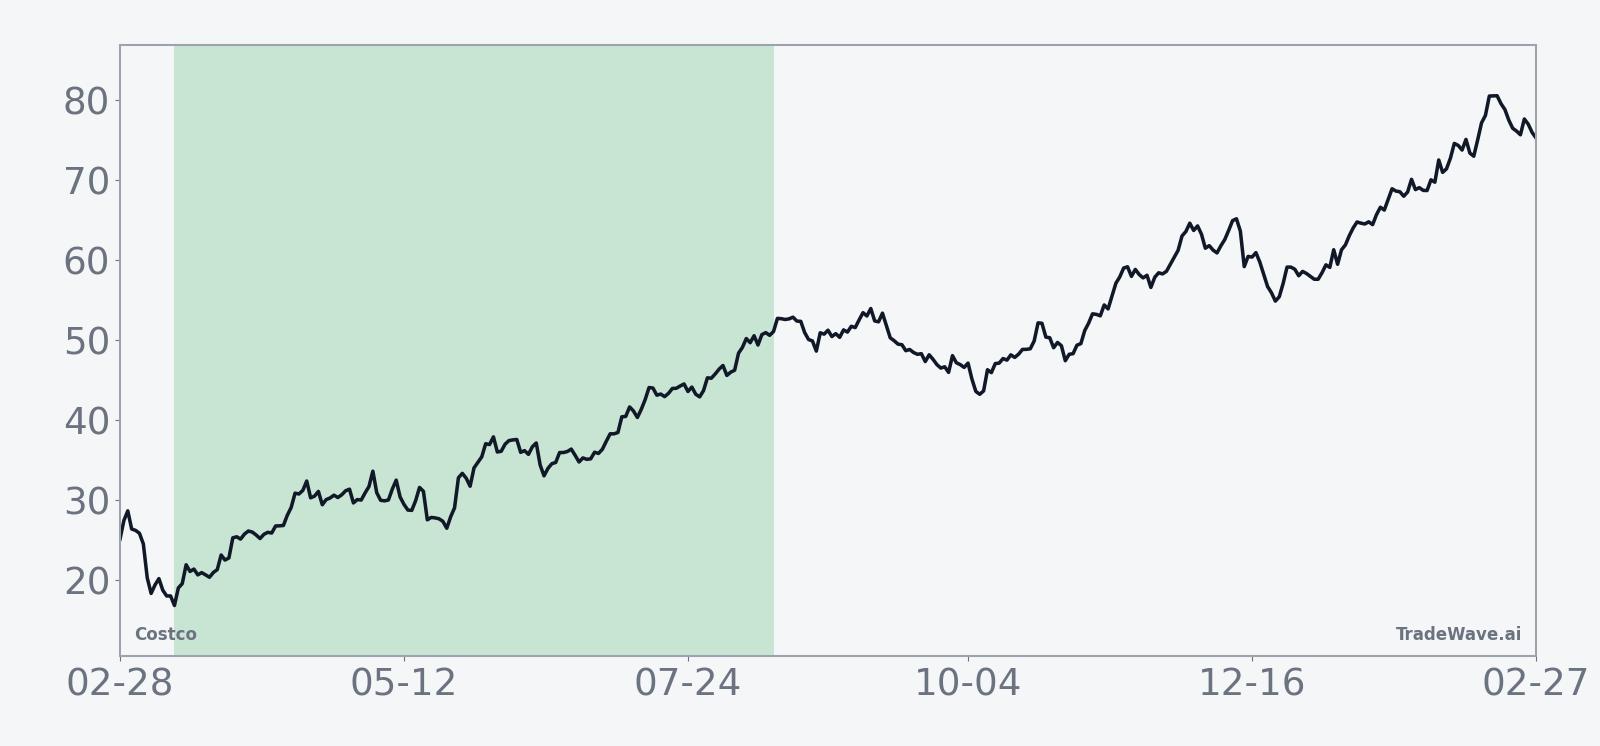
The 10-year average trend line slopes higher through most of the 155 days, with gains tending to build rather than spike and fade. The cumulative return profile, at 301% across the decade, points to a cluster of strong years rather than a single blockbuster, and the 1.27 Sharpe ratio indicates that the reward has historically outweighed the volatility on a risk-adjusted basis.
Put together, the pattern is clear: this has been one of Costco’s most reliable long windows on the calendar, with a high hit rate and meaningful average gains, but also enough intraperiod downside in some years to punish traders who cannot tolerate swings.
History does not guarantee future results, and even in this strong window, adverse moves have at times been large before the stock finished higher.
Price and near-term drivers
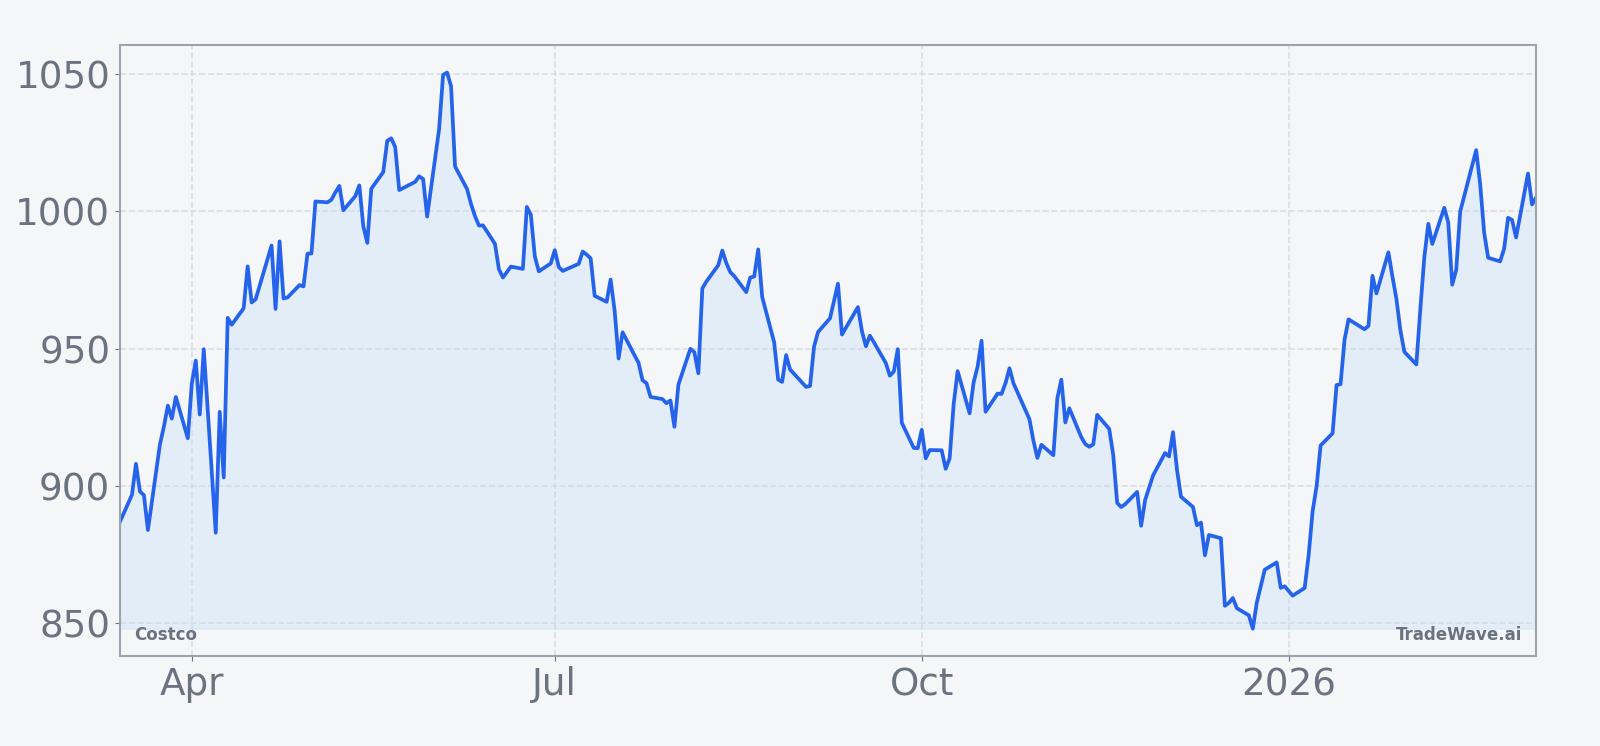
Costco closed Monday at $1,008.43, up 0.5% on the day, keeping the stock within sight of its 52-week high of $1,058.23 and extending a steady grind higher over the past month. The move comes after a fresh round of bullish commentary on the company’s earnings power and membership model, alongside new legal scrutiny that has injected a dose of headline risk into an otherwise strong tape.[5][7][9]
The chart below situates the latest move in its recent multi-month context.
On Mar 5, Barron’s reported that Costco’s latest earnings beat expectations, underscoring the resilience of its membership model and steady consumer demand even as shoppers remain price sensitive.[5] The company has leaned on scale, private-label offerings and tight cost control to keep traffic flowing, a combination that has helped it outpace many big-box peers in recent years.
At the same time, a Mar 2 Forbes piece framed the stock’s surge toward $1,000 as a valuation test, asking whether investors should consider trimming exposure at these levels.[7] The article highlighted how Costco’s premium multiple leaves less room for error if growth slows, especially with competition intensifying across retail and warehouse clubs.
More recently, a Mar 12 report from Yahoo Finance flagged a lawsuit challenging aspects of Costco’s membership refund practices, raising questions about a profit engine that has long been viewed as one of the most durable in retail.[9] While the case is still in early stages, it has sharpened focus on regulatory and legal risk around a business line that contributes a significant share of the company’s bottom line.
Those cross-currents sit on top of older concerns that surfaced in late 2025, when mixed earnings commentary pointed to decelerating comparable sales in the U.S. as inflation and tariffs weighed on traffic, even as membership fees and international operations remained bright spots.[1][2][3][6] In May 2025, sector analysis also showed Costco continuing to outpace Walmart and Target in U.S. sales growth, reinforcing the idea that the chain has been gaining share despite a tougher macro backdrop.[4]
For traders, the setup is straightforward: a stock near all-time highs, a premium valuation, a business model that has just delivered another earnings beat, and a new legal overhang, all colliding with a historically strong seasonal window that has often rewarded long exposure but has not been free of sharp pullbacks along the way.[5][7][9]
What to watch in this window
First, watch how Costco trades around the $1,050 to $1,060 band that roughly lines up with the current 52-week high. A clean break and hold above that zone early in the window would be consistent with the historical pattern of strong long-direction moves, while repeated failures there would hint that valuation concerns are starting to bite.
Second, monitor the next earnings update and any commentary on membership trends, international growth and margin pressure. Prior coverage has shown that even when Costco beats on sales and earnings, investors have been quick to punish signs of slowing comparable sales or weaker EBIT, which could matter more than usual with the stock priced for perfection.[1][2][3][5][6]
Third, keep an eye on the legal front around the membership refund lawsuit. If filings or court decisions suggest a material threat to the fee model, that would cut directly against one of the pillars that has supported Costco’s premium multiple and could override even a historically strong seasonal tailwind.[9] On the other hand, if the case fades into the background without major developments, the focus is likely to swing back to earnings execution and the calendar pattern.
Finally, track volatility inside the window, not just the closing path. Years like 2022 showed that Costco can experience deep drawdowns before finishing higher, so traders will want to watch how intraday and multi-week swings evolve relative to the historical profile of sizable maximum favorable and adverse moves. If the stock grinds higher with contained downside, it would echo the smoother years in the sample; if swings widen and rallies fail to stick, it would look more like the lone losing season, a reminder that even a 9-for-10 record leaves room for a different outcome this time.
Sources
- [1] CNBC, "Costco's quarter failed to impress. But there was still a lot we liked and a lot analysts liked" (Sep 26, 2025)
- [2] MarketWatch, "Costco’s stock slips despite profit beat, as same-store sales miss estimates again" (Sep 25, 2025)
- [3] Seeking Alpha, "Costco beats on top- and bottom-line but comparable stores sales slow" (Sep 25, 2025)
- [4] Seeking Alpha, "Costco outpaces Walmart and Target again in the U.S." (May 29, 2025)
- [5] Barron's, "Costco Earnings Beat Expectations as Membership Model Shines" (Mar 5, 2026)
- [6] Bloomberg, "Costco’s Earnings Beat Estimates on Steady Consumer Demand" (Sep 25, 2025)
- [7] Forbes, "Sell Costco Stock At $1,000?" (Mar 2, 2026)
- [9] Yahoo Finance, "Costco’s Entire Profit Model Threatened As Customer Sues For Refund" (Mar 12, 2026)