Chevron Corporation (CVX) Has Rallied in 12 of 13 Midterm Spring Windows as Next One Opens
Chevron Corporation is heading into a historically strong 37-day midterm-year spring stretch just as the stock trades near record highs and investors weigh Venezuela-driven growth against policy and oil-price risks.

Key takeaways
- From Apr 5, Chevron Corporation enters a 37-day midterm-year window that has produced gains in 12 of the last 13 cycles, a 92% hit rate for long exposure.
- Average gain in winning years is 6.44%, while the all-years average including the lone loser still comes in at 6%, pointing to a consistently bullish bias.
- The pattern’s Trade Direction is long, with a TradeWave Ratio of 2.48 and a Sharpe ratio of 1.47, signaling historically strong upside moves relative to risk.
- Intraperiod swings have been meaningful, with some years showing drawdowns of more than 7% even when the window finished higher, so timing and risk controls have mattered.
- Today CVX closed at $207.79, about 1.0% below its 52-week high of $209.79, leaving the stock near the top of its recent range as the seasonal tailwind approaches.
- Macro drivers around Venezuela production, oil prices and U.S. policy in the midterm election year will shape how closely this cycle tracks the historical pattern.
According to historical data from TradeWave.ai, this specific midterm-year spring stretch has behaved very differently from an average month on the calendar for Chevron Corporation, and the next iteration is about to start.
Seasonal window
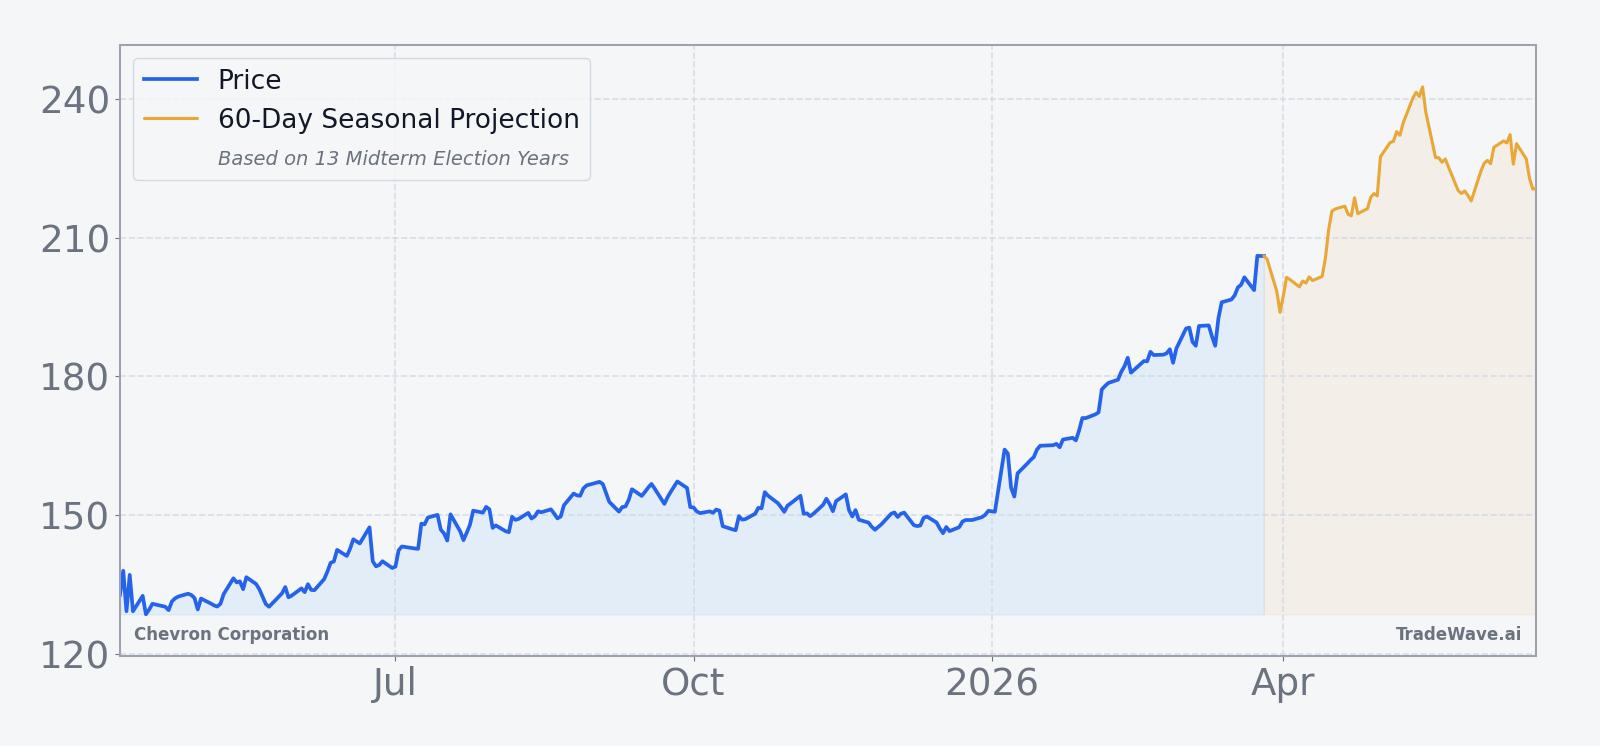
Chevron Corporation has risen in 12 of the last 13 midterm election years during this 37-day spring window, averaging 6.44% gains in the winning runs. The upcoming window begins on Apr 5 and arrives with CVX at $207.79, about 1.0% below its 52-week high of $209.79, after a 12.83% climb over the past month. That combination of a strong historical tailwind and a stock already pressing new highs gives this year’s setup more edge than a typical calendar effect.
Because this pattern is grouped by the presidential election cycle, it only looks at midterm election years, which tend to feature shifting policy priorities, regulatory noise and uneven risk appetite across energy names. For a company like Chevron that sits at the intersection of geopolitics, capital spending and shareholder payouts, that mid-cycle backdrop can matter as much as the oil tape itself.
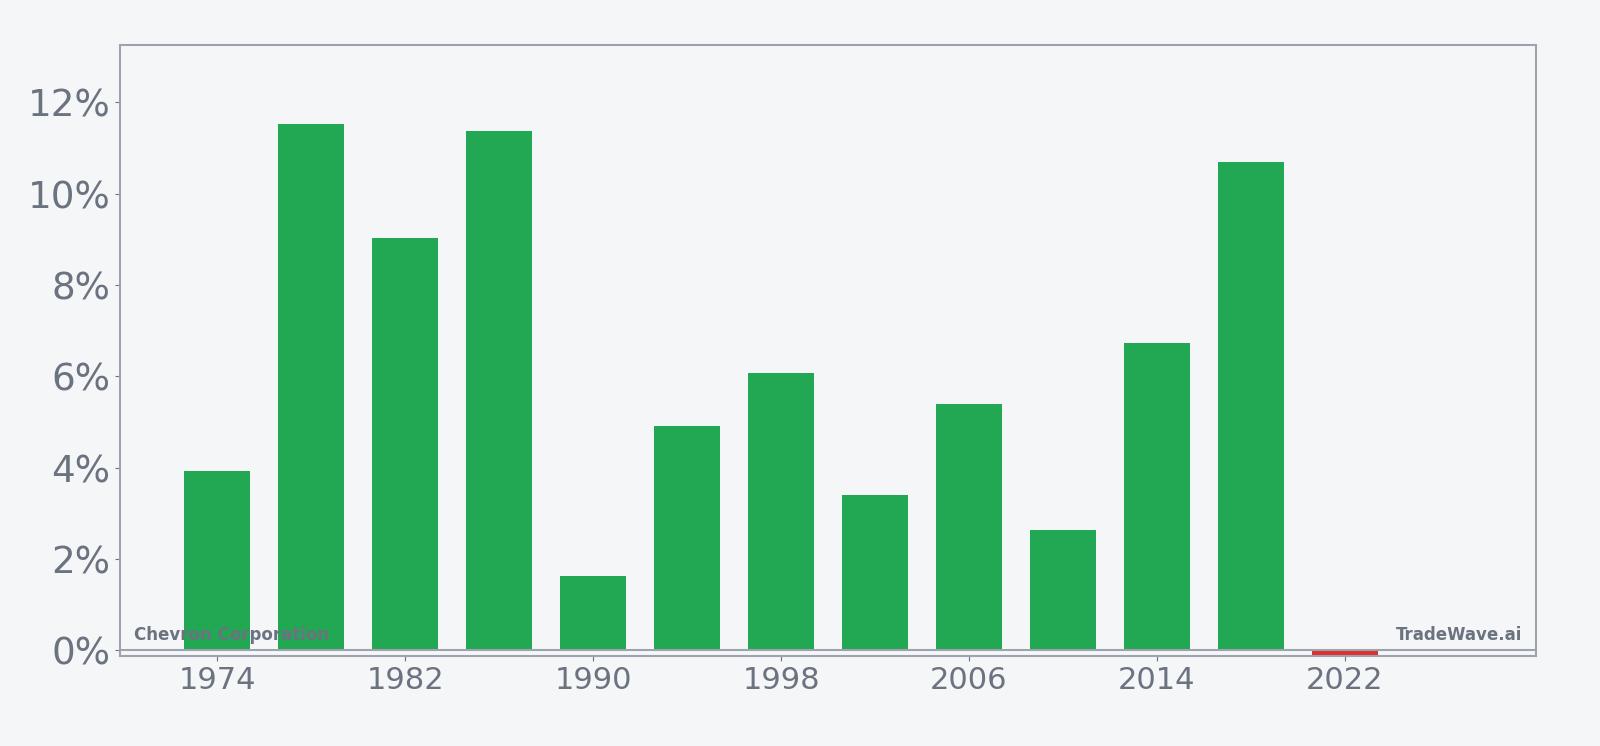
Historically, this 37-day window has been a clear positive stretch for long exposure in CVX. Percent Profitable sits at 92%, with 12 winners against just 1 loser, and even when the lone down year is included the all-years average return still lands at 6%. The median outcome of 5.39% shows that the gains have not been driven by a single outlier year but by a cluster of solid advances.
The strongest example in the sample came in 1986, when Chevron rallied 11.37% during the window, with a maximum favorable move of 12.38% from the entry price before giving back a small portion into the close. At the other end of the spectrum sits 2022, the only losing year, which finished down just 0.12% despite a peak run-up of 6.84% and a worst drawdown of 7.35% from entry, a reminder that even “flat” outcomes have involved real swings.
The historical seasonal trend line slopes higher through most of the window, with gains tending to build rather than spike and fade. In many years the pattern shows a modest early lift, a brief mid-window pause, then a stronger push into the final third, which fits a narrative of investors gradually leaning into energy exposure as midyear macro and policy visibility improves.
Year-by-year bars that combine net results with peak run-ups and worst drawdowns show how much room CVX has historically had to move inside this window.
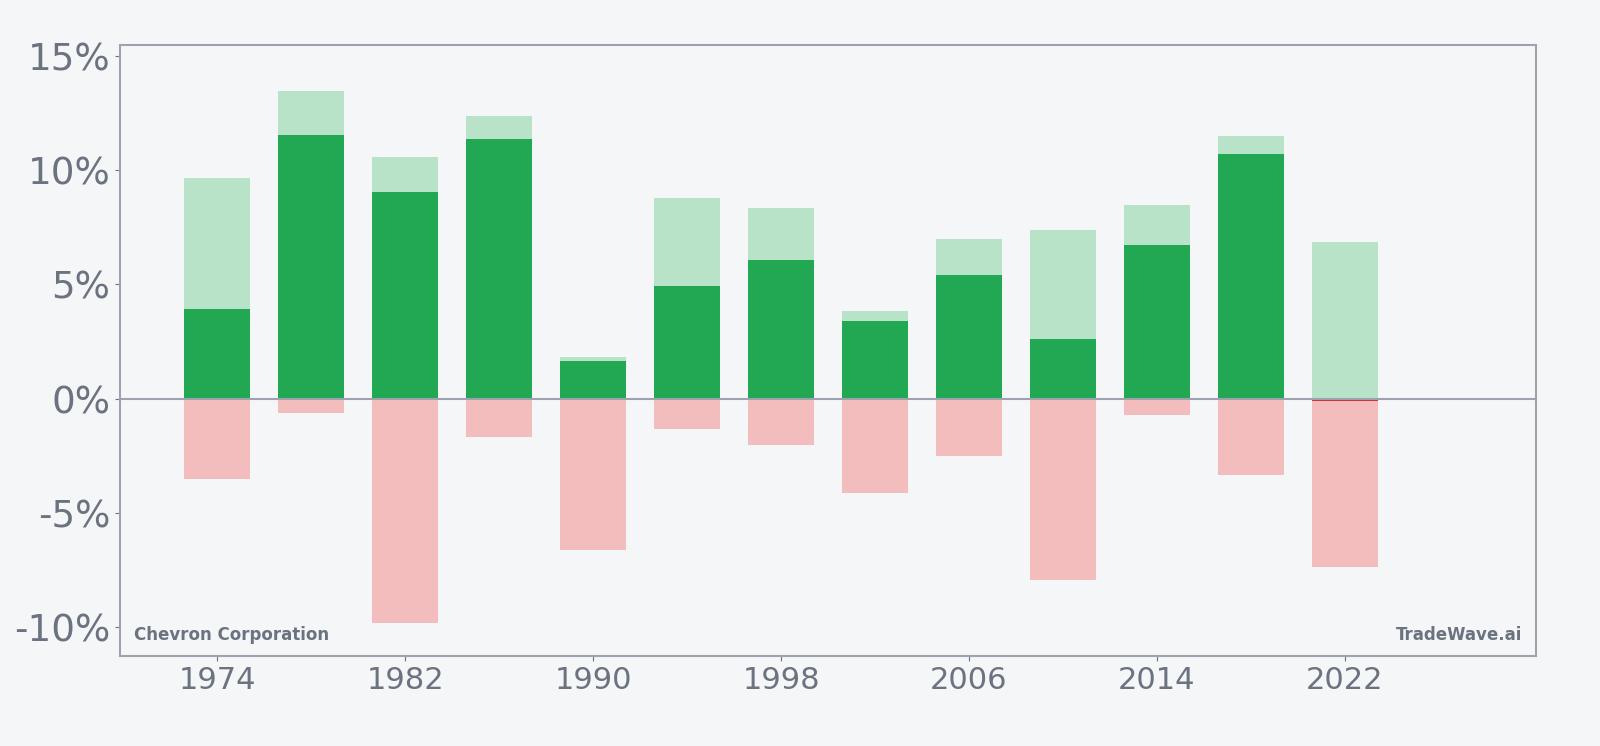
The stacked bars make the trade-off clear. In most years, the maximum favorable excursion has run comfortably ahead of the final net gain, which means traders had intraperiod opportunities larger than the closing result, while the maximum adverse excursion has often stayed in the low- to mid-single digits but occasionally stretched beyond 7%. That mix of a 2.48 TradeWave Ratio and a 1.47 Sharpe ratio points to a window where upside has historically dominated, yet pullbacks inside the pattern have been large enough to matter for anyone sizing aggressively.
History does not guarantee future results; adverse excursions can be large even in winning windows, so this pattern should be treated as context rather than a forecast.
Price and near-term drivers
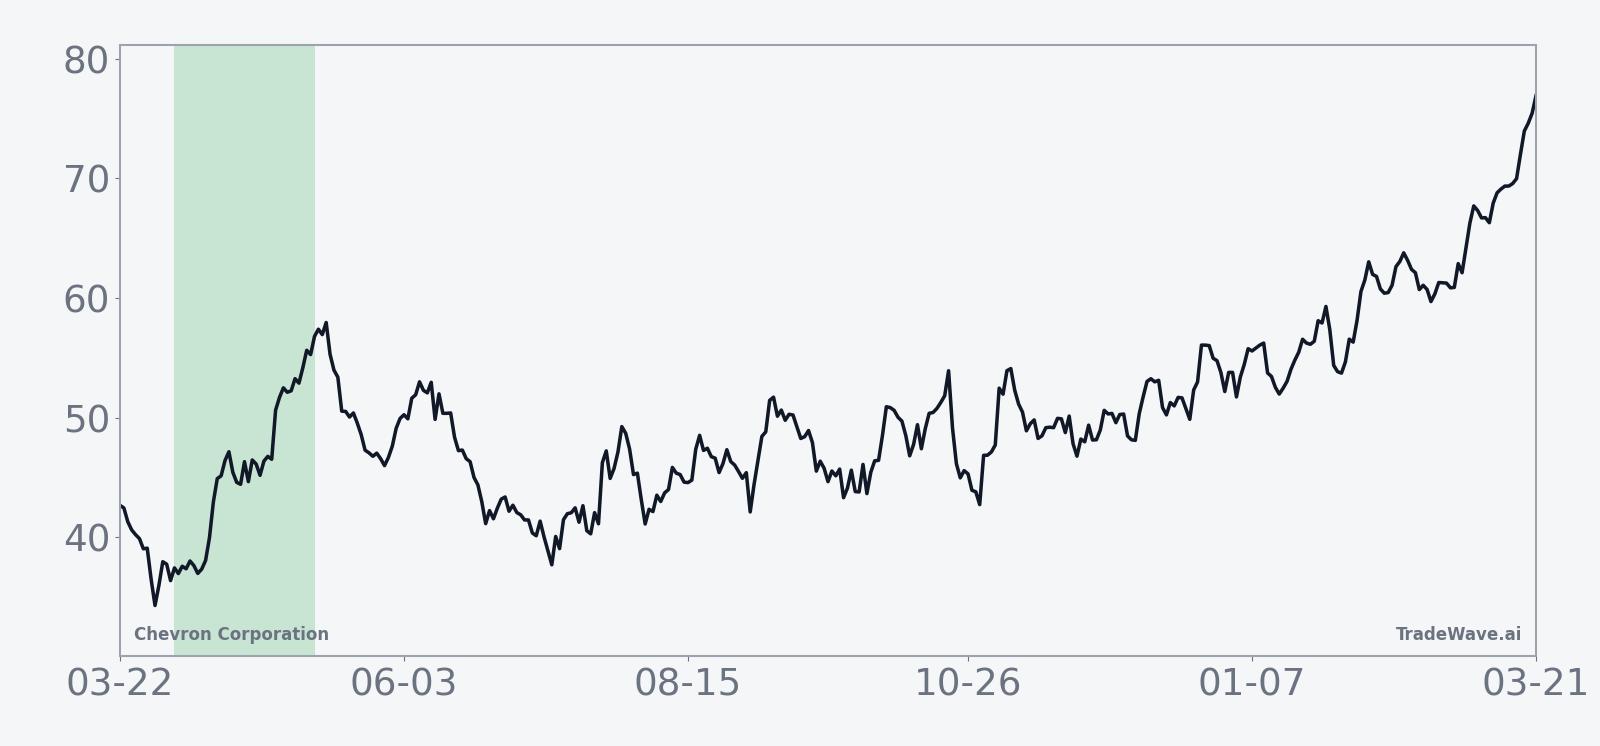
Chevron shares closed Friday at $207.79, up 1.29% on the day, leaving the stock about 1.0% below its 52-week high of $209.79 and well above its 50-day moving average of $182.84 on strong recent momentum. The move caps a 12.83% gain over the past month, with average 20-day volume of roughly 15.2 million shares underscoring how actively investors have been trading the name into the spring.
The latest leg higher follows a solid Q4 2025 earnings report on Jan 30, where Chevron delivered adjusted EPS of $1.52 versus $1.45 expected on revenue of $46.87 billion, helped by record production of 4.05 million barrels per day even as lower crude prices weighed on top-line growth.[1] Management paired that with guidance for up to $3 billion in cost cuts by the end of next year and reiterated plans to ramp Venezuelan production by 50% over 18 to 24 months, a combination that keeps the company positioned as a cash-return story even in a softer commodity tape.[1]
Fresh coverage from The Wall Street Journal on Jan 30 noted that Chevron, alongside Exxon, posted its slimmest annual profits since 2021, reflecting the comedown from the post-pandemic oil boom but still leaving the supermajors firmly profitable with room to keep funding dividends and buybacks.[2] That backdrop helps explain why Wall Street’s stance remains constructive, with a Buy consensus and a cited price target of $178 from Piper Sandler via CNBC that now sits well below the current share price and reflects an earlier, lower trading regime rather than today’s highs.[1]
The chart below situates the latest surge against the past year’s trading range and overlays the next 60 days of seasonal projection.
Macro and policy backdrop
The midterm election year context matters for Chevron because policy and geopolitics are front and center for energy. U.S. intervention in Venezuela has already shifted the company’s production outlook, with analysts flagging the potential for a 50% increase in Venezuelan output over the next 18 to 24 months as sanctions and operational constraints ease.[1] That incremental supply could support free cash flow even if global oil prices stay rangebound, but it also ties Chevron more tightly to a volatile political theater.
At the same time, sector research has highlighted Chevron’s upstream capital efficiency, which sits roughly 29% below peers, and the role of AI-driven planning and declining capex in supporting an estimated 10% annual free cash flow growth profile.[1] In a midterm year where fiscal debates, regulation and climate policy can swing sentiment quickly, that efficiency story gives the stock a buffer against headline risk, but it does not eliminate the potential for sharp short-term moves when news hits.
Energy investors also remember that in early 2026 the market had to digest a reality check on Venezuela, when Chevron’s stock logged its biggest one-day percentage decline since April and snapped a five-session winning streak as expectations were reset.[3] That episode, reported on Jan 6, 2026, showed how quickly optimism around new barrels can collide with on-the-ground complexity, a dynamic that could resurface as the company executes on its expansion plans.
What to watch as the window opens
For traders tracking this pattern, the key dates are straightforward: the seasonal window opens on Apr 5 and runs for 37 trading days, carrying a long bias that has historically favored patient bulls. Inside that span, behavior around early pullbacks will be important. In several past years, CVX has dipped a few percent in the first week or two before grinding higher into the back half of the window, so whether any early weakness is bought or sold will offer a real-time read on how much weight the market is giving to the historical script.
On the macro side, watch for fresh headlines on Venezuelan production, OPEC+ decisions and any midterm-year policy moves that touch U.S. drilling, export rules or windfall taxes. Positive progress on Chevron’s cost-cut and efficiency targets, or clearer timelines on Venezuelan ramp-up, would rhyme with the historical pattern of strength, while renewed political friction or a sharp drop in crude could be the catalysts that pull this cycle closer to the rare 2022-style flat outcome.[1]
Price levels matter too. The 52-week high near $209.79 is the first reference point; sustained trade above that zone during the window would keep the pattern’s bullish tone intact, while repeated failures there combined with deeper drawdowns of 5% to 7% would echo the more volatile years in the sample. Volume relative to the 20-day average around 15.2 million shares will help confirm whether institutions are leaning into or fading the move.
Finally, keep an eye on how the stock reacts to any renewed “reality check” moments around Venezuela or broader policy headlines, similar to the sharp one-day drop seen in early January 2026.[3] If those shocks are quickly absorbed and CVX resumes its climb, it would fit the historical pattern of intraperiod setbacks giving way to higher closes. If instead selling pressure persists and the stock spends most of the window below its recent highs, that would be a clear sign that this midterm-year iteration is breaking from the usual script.
Sources
- [1] CNBC, "Chevron earnings beat as production hits record with upside expected in Venezuela," Jan 30, 2026.
- [2] The Wall Street Journal, "Exxon, Chevron Post Slimmest Annual Profits Since 2021," Jan 30, 2026.
- [3] MarketWatch, "Chevron’s stock falls as the market gets a reality check on Venezuela," Jan 6, 2026.
- Reuters, "Chevron beats Wall Street profit estimates with record production," Aug 1, 2025.
- Reuters, "Chevron beats Wall Street profit estimates with record output," Aug 1, 2025.
- Reuters, "Chevron meets Wall Street profit estimates as refining recovers from previous quarter," May 2, 2025.