Amazon (AMZN) Bulls Eye Q3 AI, AWS Upside as a Perfect Midterm April Window Nears
Amazon is heading toward a short April window that has never been negative in past midterm election years, with shares trading near recent highs as investors focus on cloud and AI momentum.

Key takeaways
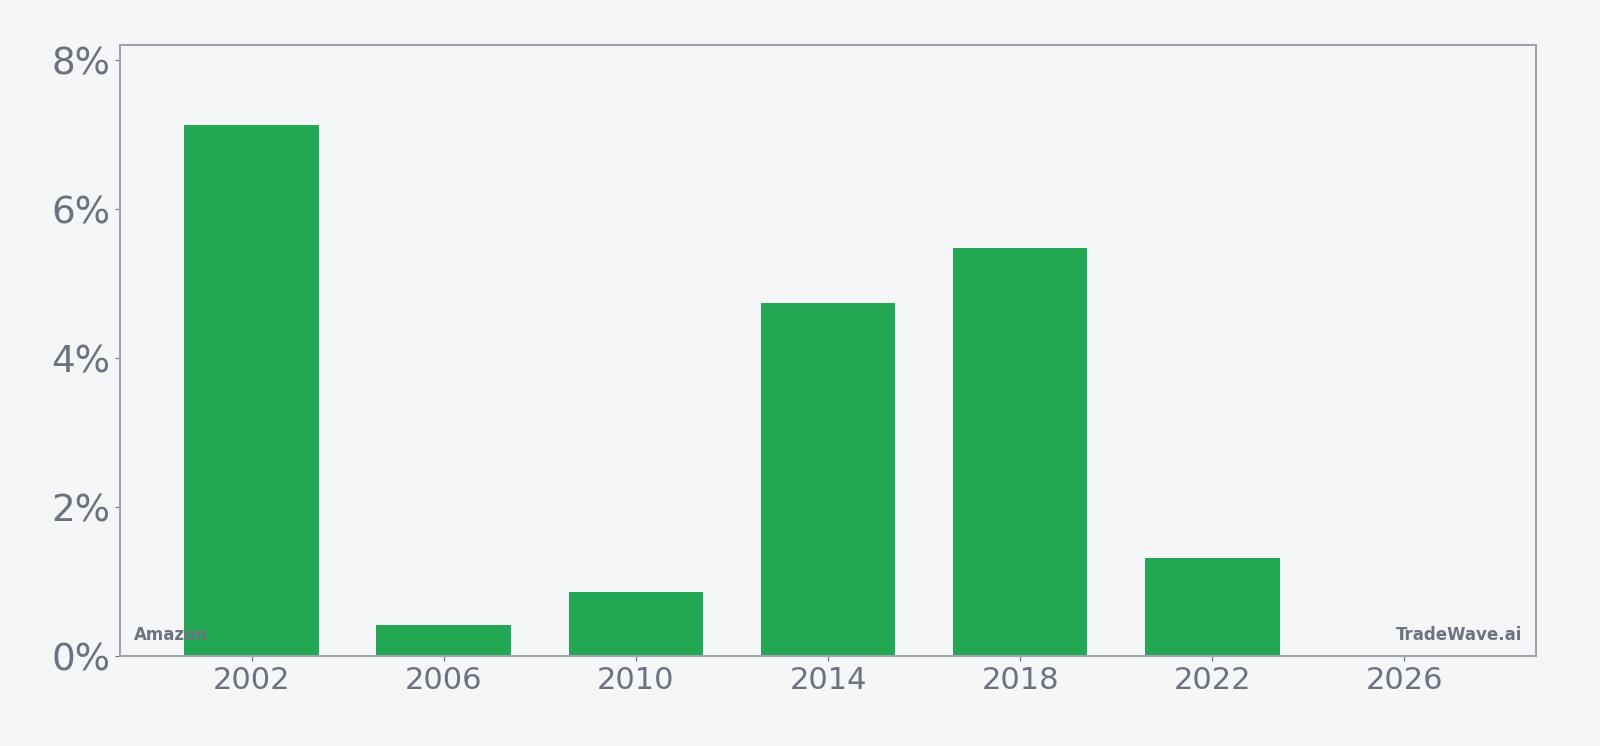
- Amazon has finished higher in this seven-day April window in all 6 midterm election years in the sample, with no losing years.
- The upcoming window starts Apr 12 and has delivered an average gain of 3.33% for long exposure across those cycles.
- Trade Direction is long, with a TradeWave Ratio of 1.41 and a Sharpe ratio of 1.16, pointing to historically favorable risk-adjusted returns.
- Best years such as 2002 and 2018 saw gains of 7.14% and 5.48%, while even the softest year in 2006 still ended positive.
- Intraperiod swings have included adverse moves as deep as about 3% in some years, so drawdowns have been real even in winning windows.
- The pattern is specific to the midterm election year phase, where policy uncertainty and rate debates have often made short windows like this more volatile for megacap tech.
According to historical data from TradeWave.ai, this mid-April stretch has behaved very differently from an average week for Amazon in past midterm election years, and the next iteration is now on the calendar.
Seasonal window
Amazon has risen in all 6 midterm election years during this seven-day window starting Apr 12, averaging gains of 3.33%. Shares closed Thursday at 211.71, up 2.2% on the day and about 18.1% below the 52-week high of 258.60.[11] That combination of a clean historical win streak and a stock still trading well under its one-year peak gives this short window more weight than a typical calendar quirk.
Grouping the data by the presidential election cycle matters here because midterm election years often feature tighter financial conditions and heavier policy noise, which can change how megacap tech trades around short windows. This pattern looks specifically at the last six midterm election years, so it is capturing behavior in that policy backdrop rather than averaging across calmer phases like the year before a presidential election.
Across those six midterm years, every single iteration of this April window finished positive for a long position. The strongest outcomes came in 2002 and 2018, when Amazon gained 7.14% and 5.48% respectively over the seven trading days. Even the softest year, 2006, still ended with a 0.42% gain, which is why the Percent Profitable metric sits at 100% with 6 winners and 0 losers.
The average gain of 3.33% reflects only winning years, but because there were no losers, the all-years average is effectively the same. Median profit of 3.03% shows that the typical outcome has been a mid-single-digit move rather than a one-off outlier. For a megacap like Amazon, a 3% to 5% swing in a single week is meaningful, especially when it repeats across multiple cycles.
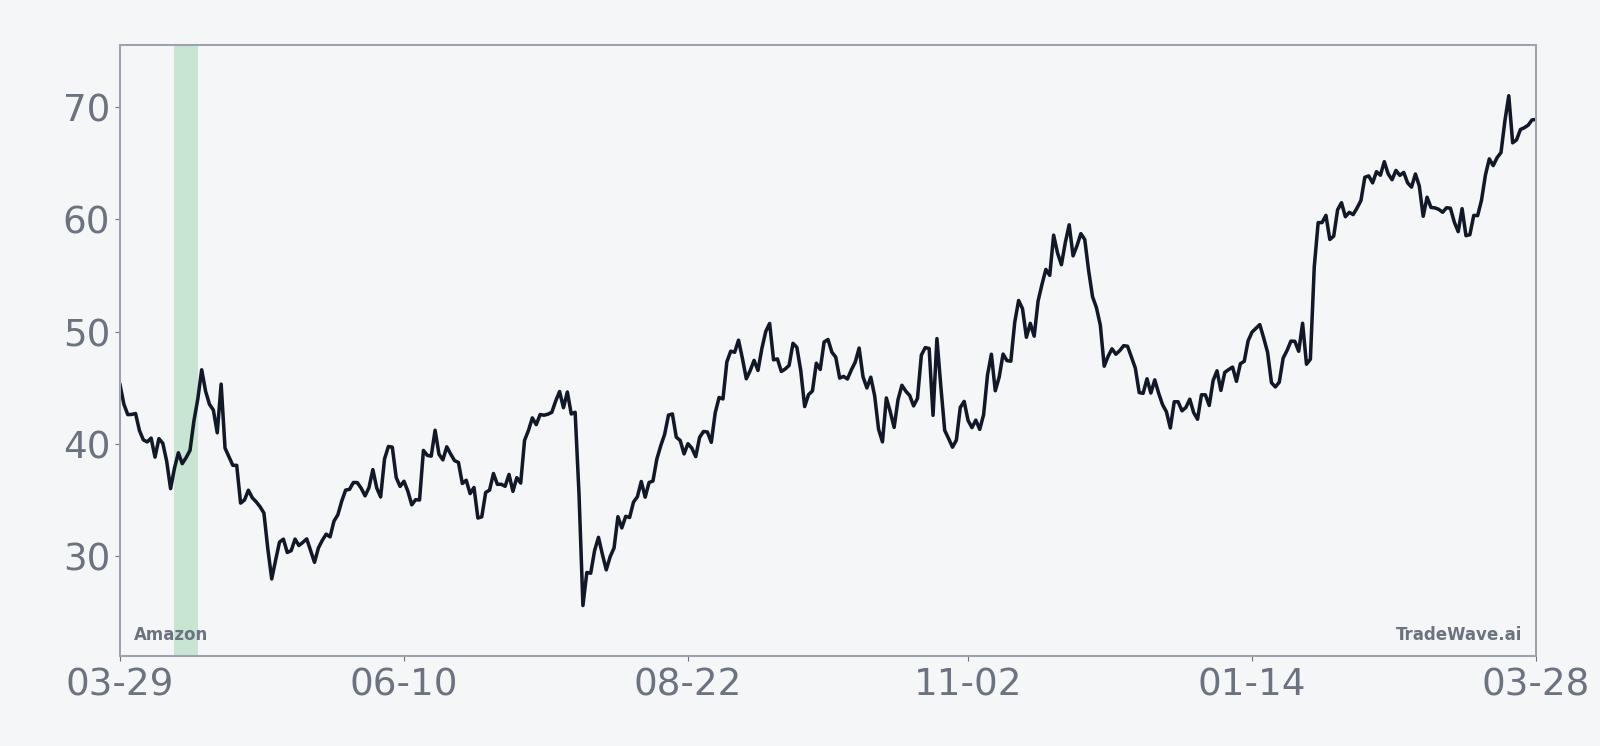
The historical average path inside the window tilts higher rather than choppy, with gains tending to build rather than reverse late. That fits a profile where buyers lean in early in the window and are not forced out by sharp late-week reversals, which is consistent with a long-biased pattern.
A closer look at yearly net returns alongside peak rallies and worst drawdowns shows how much the stock has moved inside the window, not just where it finished.
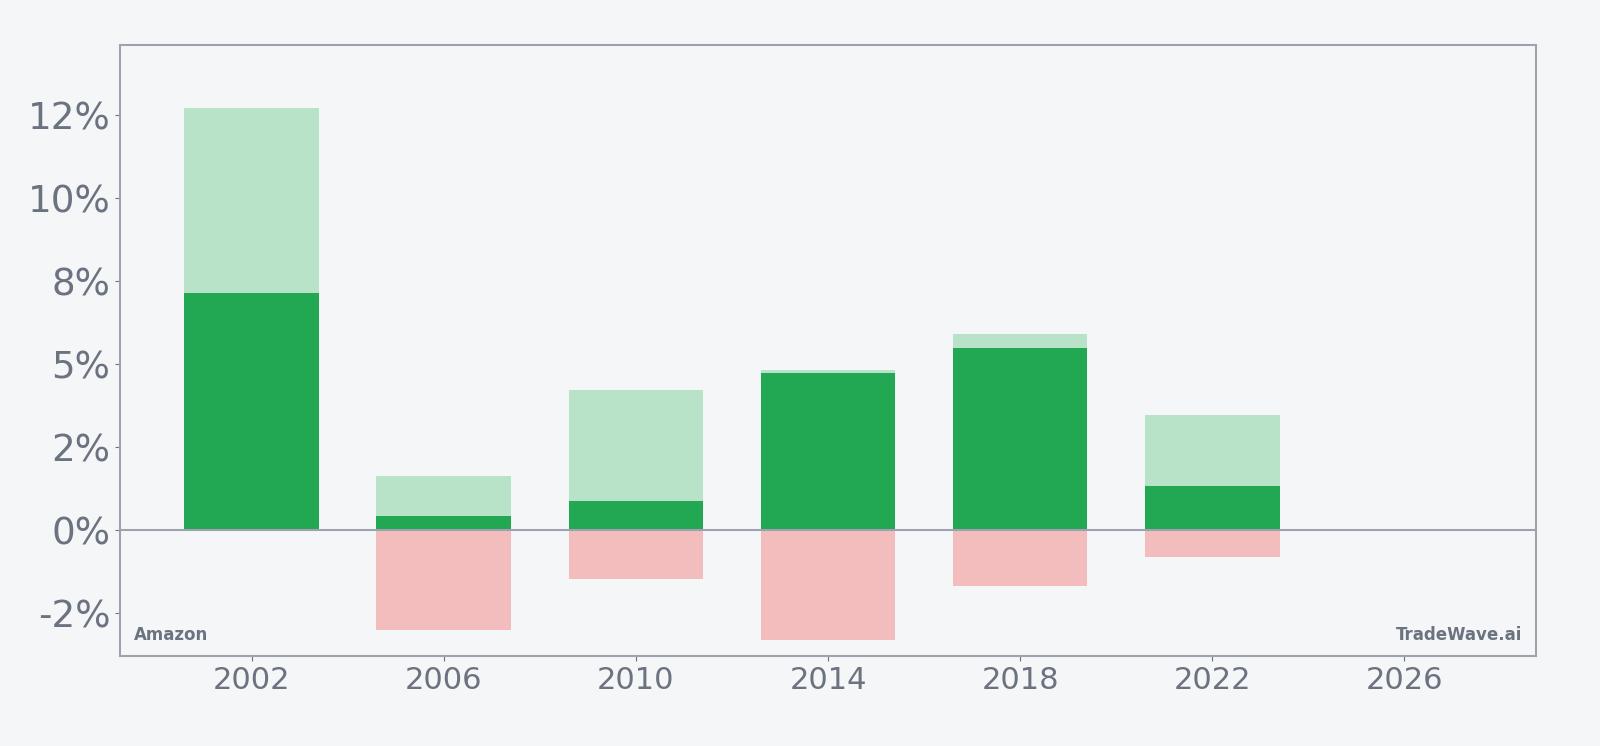
Maximum favorable moves have been sizable, with years like 2002 showing a 12.7% peak run-up inside the window, while the worst drawdowns have ranged from shallow to about 3.3% in 2014. That mix of strong upside excursions and contained but real adverse moves fits a long setup where the stock has tended to reward patience but still tested entries along the way.
History does not guarantee future results; adverse excursions can be large even in winning windows, and past midterm-year behavior may not repeat in 2026.
Price and near-term drivers
Amazon closed Thursday at 211.71, up 4.47 points or 2.2% on the session, leaving the stock about 18.1% below its 52-week high of 258.60 and roughly 31.2% above the 52-week low of 161.38.[11] The move came on volume of about 36.1 million shares, below the 20-day average of roughly 44.6 million, and keeps the stock just under its 50-day moving average of 218.65, a level traders are watching as a near-term resistance band.[11]
In February 2026, Forbes highlighted that Amazon bulls were focused on a familiar set of catalysts: a potential re-acceleration in AWS growth tied to AI workloads, continued strength in high-margin advertising, and any signs that retail margins can expand even as logistics investments continue.[11] That backdrop means the next few weeks are less about a single earnings print and more about whether incremental data points support the idea that Amazon can keep closing the gap with faster-moving peers in the so-called Magnificent Seven.
The chart below situates the latest move in its recent multi-month context, alongside a 60-day seasonal projection that includes the upcoming April window.
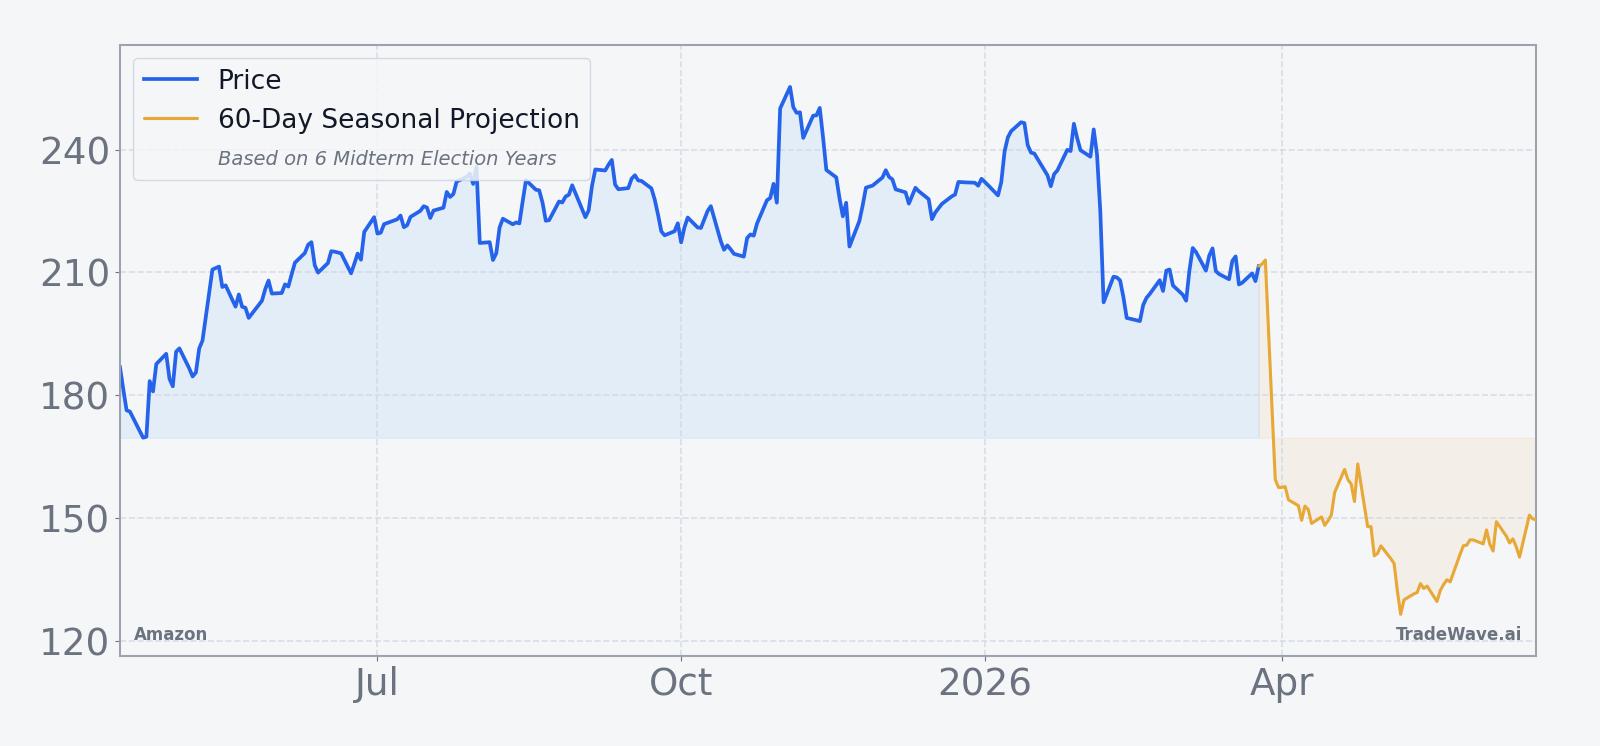
From a broader sector angle, cloud and AI spending remain the key swing factors. Earlier coverage pointed to expectations that AWS growth could accelerate as AI capacity constraints ease, which would help Amazon narrow the narrative gap with faster-growing cloud rivals.[2] At the same time, e-commerce and advertising have been steady profit drivers, giving the company multiple levers if macro conditions stay supportive.[1]
Past earnings cycles show how quickly sentiment can flip. On Aug 1, 2025, Amazon shares slid 8% after AWS results raised questions about the company’s AI roadmap, even though the quarter beat on revenue and EPS.[3] Later that year, on Oct 30, 2025, the stock surged 10% after a Q3 beat driven by AWS and ad growth, as investors rewarded signs that the cloud business could re-accelerate without crushing margins.[4] Those swings underline why a short, historically positive window like mid-April can matter when the narrative is still in flux.
Macro and policy noise also sit in the background. In Aug 2025, Reuters reported that Amazon’s retail business held up despite tariff pressures, with suppliers absorbing much of the cost rather than passing it through to consumers.[7] That kind of resilience has helped Amazon trade more like a diversified platform than a pure cyclical retailer, but it also means investors will be watching any new trade or regulatory headlines as the U.S. moves deeper into the midterm election year.
What to watch into the April window
The seven-day window starting Apr 12 has a clean track record for Amazon in past midterm election years: 6 winners, 0 losers, and average gains a little above 3%. The key question for 2026 is how that historical tendency interacts with a stock that is still below its 52-week high but sitting near a cluster of technical levels around the 50-day moving average.
First, watch how Amazon behaves as it approaches the 218 to 220 zone where the 50-day average currently sits. A firm push through that band ahead of or during the window would line up with the historical pattern of upside follow-through, while repeated failures there would mark a clear break from prior cycles.
Second, keep an eye on incremental news around AWS and AI. Any commentary that supports the idea of accelerating cloud growth, or fresh customer wins in generative AI, would reinforce the sector narrative that helped drive the 10% post-earnings surge in late October 2025.[4] Conversely, another round of doubts like those that surfaced after the August 2025 AWS print would test how much seasonal tailwind can offset renewed skepticism.[3]
Third, monitor macro and policy headlines tied to the midterm election year. Shifts in tariff policy, antitrust rhetoric, or digital advertising rules could all affect how investors treat megacap platforms, even over a short window.[7] If volatility in those areas spikes during the April stretch, it would be a real-time test of whether this midterm-year pattern can still assert itself when the policy calendar heats up.
Finally, traders will be watching intraperiod swings as much as closing levels. In prior years, Amazon has seen adverse moves of around 2% to 3% inside the window even when the final result was positive, so a sharp dip early in the stretch would not automatically mean the pattern has failed. What would contradict history is a week that ends decisively lower, breaking a six-for-six record that has quietly favored long exposure in this specific slice of the midterm election year.
Sources
- [1] Business Insider, "Amazon earnings on deck with focus on AI and AWS as the stock lags Mag 7," Oct 30, 2025.
- [2] CNBC, "UBS lifts Amazon price target ahead of e-commerce giant’s earnings," Oct 28, 2025.
- [3] Yahoo Finance, "Amazon stock slides 8% after AWS results raise questions about company's AI plans," Aug 1, 2025.
- [4] Seeking Alpha, "Amazon surges after Q3 beat driven by AWS, ad growth, offsetting margin pressures," Oct 30, 2025.
- [5] Seeking Alpha, "Amazon: Workforce Related Challenges Show Up, Again," Nov 3, 2025.
- [7] Reuters, "Amazon slumps after cloud computing growth underwhelms investors," Aug 1, 2025.
- [8] CNBC, "Buy Amazon for a prospective breakout, says Carter Worth," Jan 9, 2026.
- [9] The Motley Fool, "Is This a Rare Buying Opportunity for Amazon Stock?," Jan 4, 2026.
- [10] Forbes, "Buy Or Sell Amazon Stock?," Nov 13, 2025.
- [11] Forbes, "Here Are The Catalysts AMZN Stock Bulls Are Waiting For," Feb 12, 2026.
- [12] The Wall Street Journal, "Comcast, Amazon Expand Streaming Distribution Agreements," Aug 28, 2025.