Nvidia (NVDA) AI Boom Meets a Historically Weak 95-Day Midterm Spring Window
Nvidia is approaching a 95-day midterm-year window that has historically leaned bearish even as the stock trades near record territory in the AI boom.

Key takeaways
- Nvidia is set to enter a 95-day midterm election year window starting Mar 21 that has historically favored short setups.
- Across the last 6 midterm cycles, this window has been profitable for shorts in 5 years and unprofitable in 1 year, or 83% of the time.
- Winning years in this pattern have averaged 29.85% gains for the short side, while including all years the average outcome is a 25% move in the trade direction.
- Intraperiod swings have been violent, with several years showing deep adverse moves before the short ultimately worked.
- The pattern clusters in midterm election years, when policy uncertainty and rate debates often collide with lofty AI expectations.
- History does not guarantee a repeat, but the combination of high win rate and large excursions makes this an important risk window for a stock that anchors major indexes.
According to historical data from TradeWave.ai, this specific midterm-year stretch has behaved very differently from an average quarter for Nvidia, with a distinct bias that traders often overlook.
Seasonal window
Nvidia has moved in favor of short positions in 5 of the last 6 midterm election years during this 95-day window, with winning shorts averaging 29.85% gains and all years averaging a 25% move in the trade direction. Shares finished Monday at $181.93, leaving the stock about 14.2% below its 52-week high of $212.17 and more than double its 52-week low of $86.59.[1] With Nvidia again central to the AI trade and major indexes, a historically bearish midterm-year window starting Mar 21 could matter well beyond a single ticker.
The presidential election cycle matters here because this pattern only looks at midterm election years, when Washington is often debating spending, regulation and rates while markets reassess how much growth to price into mega-cap tech. Grouping Nvidia’s behavior by that phase isolates how the stock has traded when policy noise is high and liquidity conditions can shift quickly.
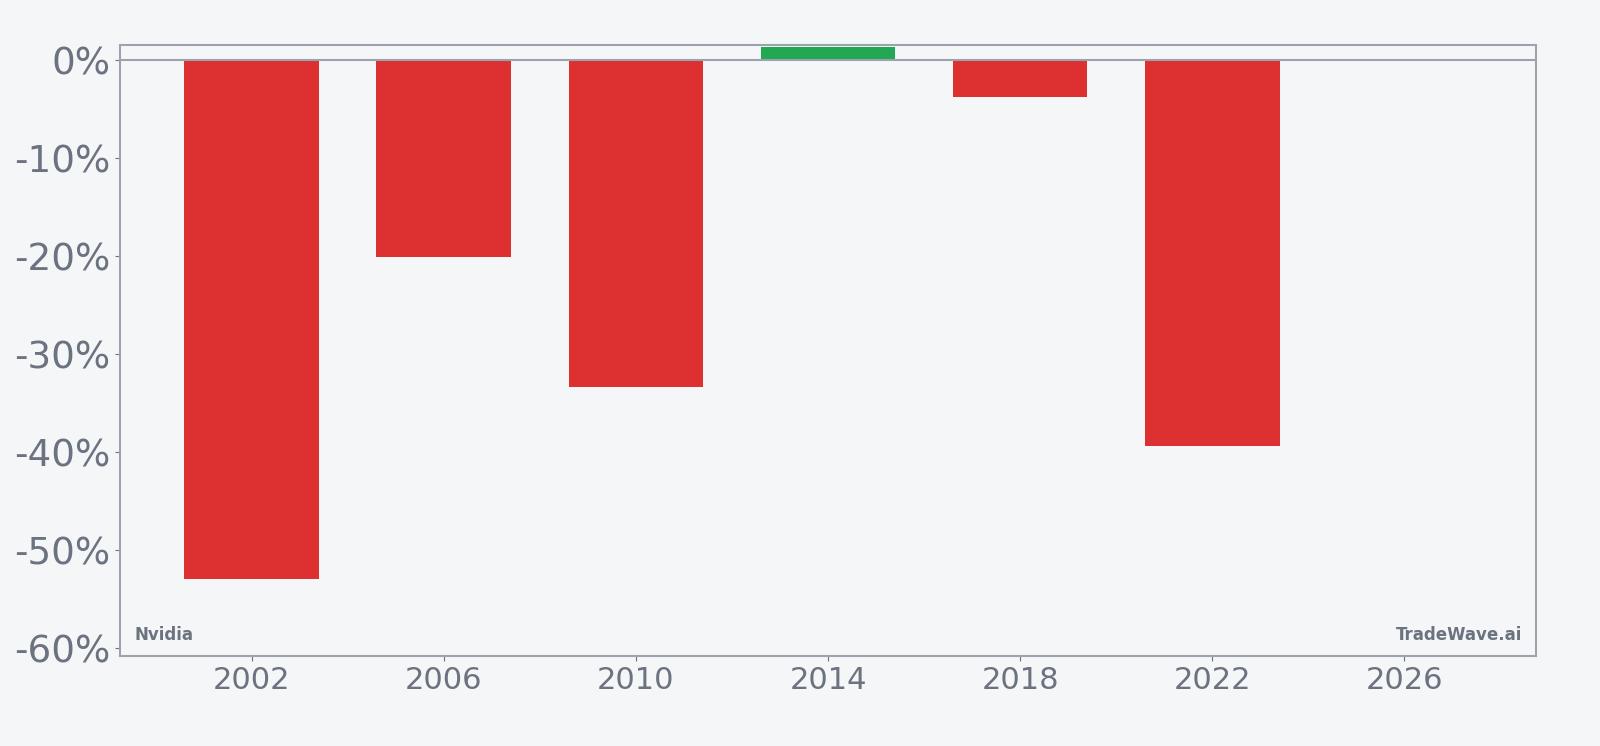
This seasonal window begins on Mar 21 and spans 95 trading days, and historically it has been a weak stretch for Nvidia when viewed through a short lens. The trade direction is explicitly short, meaning negative returns for the stock have been favorable outcomes for the pattern. Across the last six midterm election years in this phase, shorts have finished in the green 83% of the time, with 5 winners and just 1 losing year.
Average winner gains of 29.85% for the short side underline how sharp the down years have been, while including every year in the sample still leaves a hefty 25% average move in the trade direction. The lone losing year for shorts saw Nvidia grind higher into the close of the window, but even that outlier featured only a modest 1.39% gain against the short, far smaller than the typical winning move in the other cycles.
The intraperiod path has not been smooth. In 2002, the strongest year for the pattern, Nvidia’s net return over the window was a 52.89% drop, with the best point-to-trough move for shorts reaching 56.31% before the period ended. At the other extreme, 2014 was the weakest year for the setup, with the stock finishing up 1.39% and the worst drawdown against shorts reaching 5.16% before the move faded.
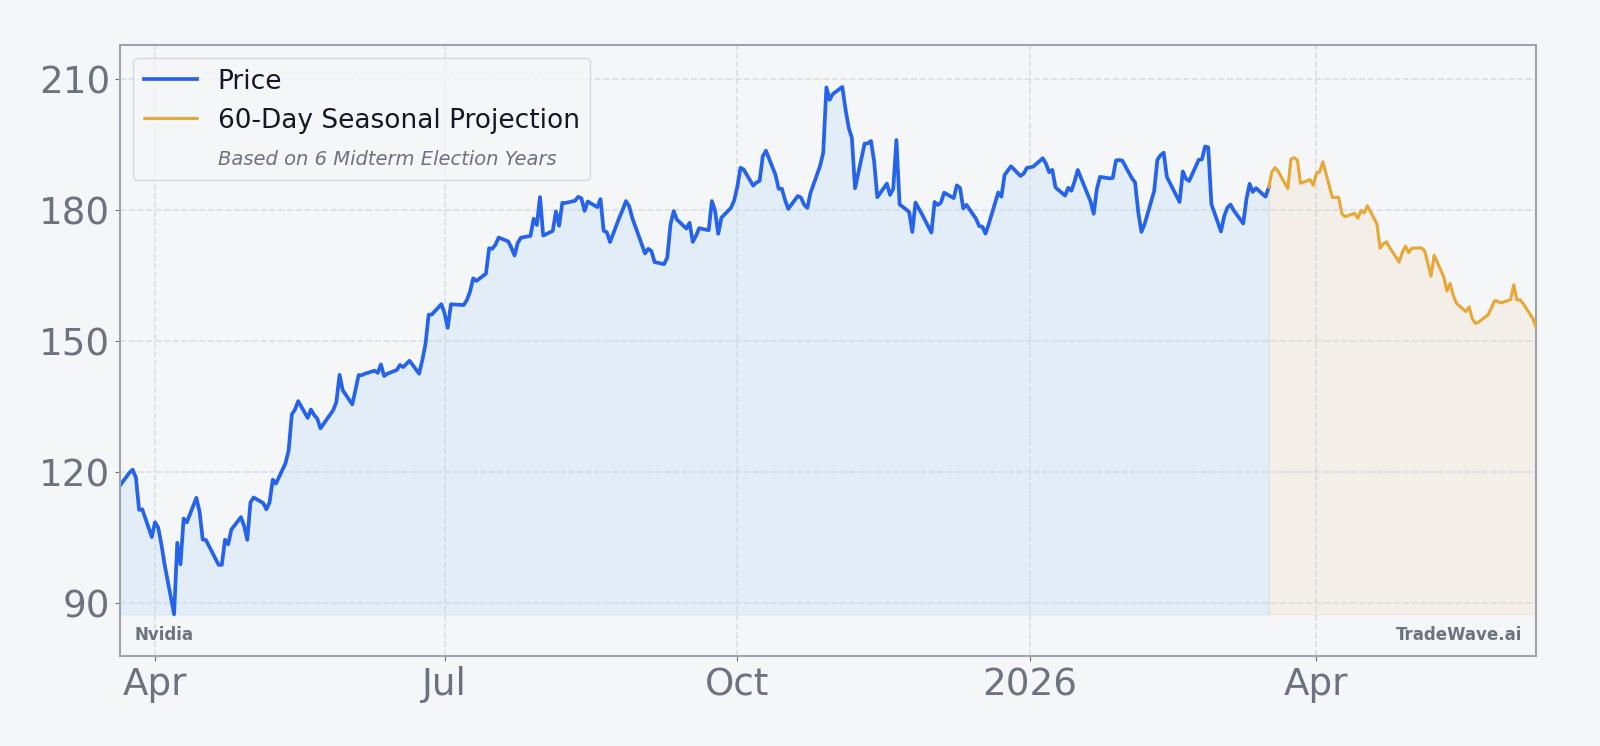
The historical seasonal trend line suggests that, in many midterm years, Nvidia has not collapsed all at once. Instead, the typical pattern shows choppy early trading followed by a more persistent drift lower into the back half of the window, which is when several of the largest favorable moves for shorts have tended to accrue.
A closer look at yearly net returns alongside peak favorable and adverse moves shows how often this window has delivered big swings.
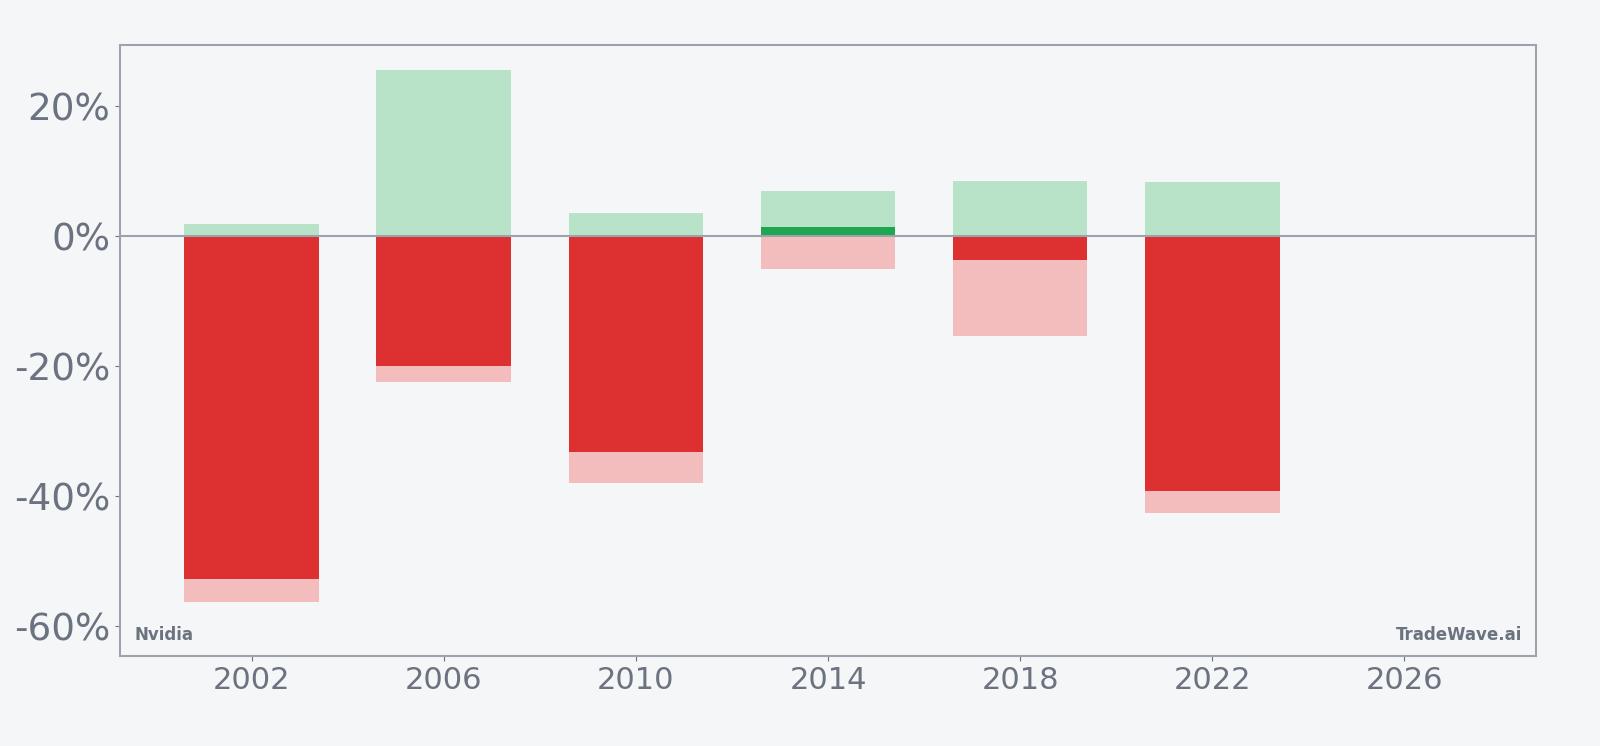
Across the six midterm-year samples, maximum favorable moves for shorts have often been large, but so have the worst adverse swings, underscoring that this is a high-variance window rather than a gentle drift. Several years show Nvidia rallying meaningfully against shorts before rolling over, which is consistent with a market that tests conviction before rewarding the prevailing seasonal tendency.
History does not guarantee future results; adverse excursions can be large even in winning windows, and traders can face significant drawdowns before any seasonal edge plays out.
Price and near-term drivers
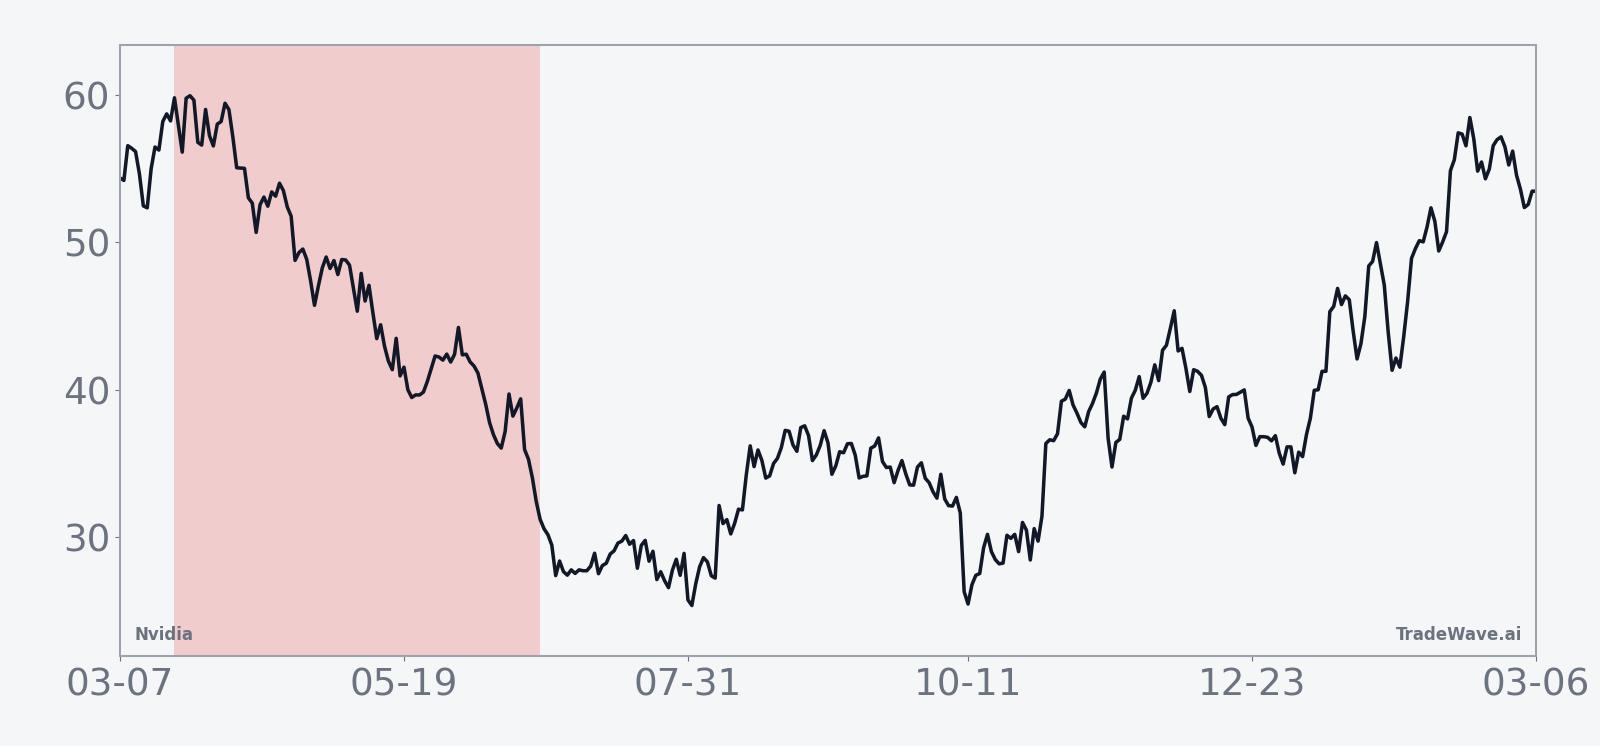
Nvidia closed Monday at $181.93, down 0.7% on the day, after trading between $181.68 and $185.40 on heavy volume of about 178.3 million shares, versus a 20-day average near 195.5 million.[1] The stock sits above its 50-day moving average of $185.26, but the gap has narrowed as Nvidia has slipped 1.64% over the past month while remaining far above its 52-week low of $86.59.[1]
The chart below situates the latest move in its recent multi-month context.
In Aug 2025, Nvidia reported Q2 fiscal 2026 revenue of $46.7 billion, up 56% year over year, with adjusted EPS up 54%, underscoring how central AI demand has become to the company’s story.[2] By Nov 2025, analysts were looking for Q3 revenue of $55 billion and EPS of $1.26, with attention on the Blackwell chip family and follow-on products like Vera Rubin as key growth engines into 2026.[3]
Analyst commentary in late 2025 framed Nvidia as the clear leader in AI hardware, even as some firms flagged rising competition and the risk that hyperscaler spending could eventually normalize.[4][5] HSBC’s coverage via Barchart described the stock as a “Strong Buy” with a consensus price target around $222 at that time, a level that reflected an earlier price regime before the latest leg of the AI rally.[1]
Sector-wide, Nvidia’s dominance in AI chips has been tied to broader themes around data center buildouts, power constraints and the pace of model deployment, with several research pieces in 2025 arguing that the bottleneck was shifting from chips to energy and infrastructure.[5] That backdrop helps explain why Nvidia’s swings often ripple through the Nasdaq and S&P 500: when investors reassess how fast AI spending can grow, they tend to do it through this stock first.
Macro and election-cycle backdrop
The upcoming window sits in the midterm election year of the U.S. presidential cycle, a phase that has historically featured more policy noise and cross-currents than the election year itself. In prior cycles, debates over fiscal deficits, regulation of large tech platforms and the path of interest rates have often intensified in midterm years, creating a tougher tape for richly valued growth names.
For Nvidia, that means the seasonal pattern is colliding with a macro story built on sustained AI investment and high expectations. In 2025, commentary around the stock repeatedly emphasized that AI demand was not a short-lived bubble but a structural shift, even as some analysts warned that competition and customer concentration could inject volatility into the path of earnings.[4][5] A midterm-year environment where policymakers are scrutinizing big tech’s power and the cost of AI infrastructure could amplify those swings.
Because Nvidia is a top weight in major indexes, a historically weak midterm-year window for the stock has, in past cycles, coincided with choppier index behavior as well. When Nvidia has stumbled in this pattern, it has often dragged on broader risk sentiment, particularly in growth-heavy benchmarks that lean on AI and cloud themes.
What to watch as the window opens
The 95-day window starting Mar 21 will test whether Nvidia can defy a midterm-year pattern that has historically rewarded shorts. The first thing to watch is how the stock behaves around its 50-day moving average near $185: sustained trading below that level as the window progresses would be more consistent with prior weak cycles, while a decisive reclaim and push toward the $212 area would look more like the lone losing year for shorts.[1]
Second, monitor how AI-related headlines intersect with policy and macro news. Any signs that hyperscaler capex plans are slowing, that competition is eroding Nvidia’s pricing power, or that regulators are tightening the screws on big tech could reinforce the historical tendency for this midterm-year stretch to be a rough patch for the stock.[3][4][5]
Third, pay attention to volatility inside the window, not just where Nvidia finishes. Past cycles show that even winning shorts have endured sizable rallies against them before the trade worked, so sharp upside spikes would not automatically invalidate the seasonal pattern. What would contradict history is a sustained, low-volatility grind higher through the bulk of the 95 days, especially if it comes alongside upbeat AI demand commentary and benign policy headlines.
Finally, because Nvidia is a bellwether for AI and a heavy weight in major indexes, any break from the historical script in this window could send a broader signal. If the stock shrugs off a seasonally weak midterm-year stretch and powers higher, it would reinforce the idea that the AI cycle is overwhelming older election-cycle tendencies. If instead Nvidia tracks its prior midterm-year path and stumbles, traders will likely read that as a warning shot for the wider growth complex.
Sources
- [1] Barchart.com, "Nvidia Stock Just Got a New Street-High Price Target. Should You Buy NVDA Now?", Oct 27, 2025.
- [2] Barchart.com, "Analysts Have High Hopes for Nvidia Ahead of August 27. Should You Buy NVDA Stock Here?", Aug 22, 2025.
- [3] Business Insider, "Nvidia earnings updates: Analysts are bullish before Q3 results", Nov 19, 2025.
- [4] Seeking Alpha, "Nvidia rises even as Citi trims estimates amid concerns over increased competition", Sep 8, 2025.
- [5] Seeking Alpha, "Nvidia: It's Not A Bubble, It's A Dam", Oct 16, 2025.