Marvell Technology (MRVL) Has Dropped in 6 of 6 Midterm Windows, Averaging 23.42% Short Profits
Marvell Technology is trading just above its 52-week high as it heads toward a late-April midterm-year window that has repeatedly favored short sellers and delivered sharp swings for semiconductor traders.
What is the seasonal pattern for Marvell Technology (MRVL)?
Marvell Technology has fallen in 6 of 6 midterm election-year windows starting in late April, with an average gain of 23.42% in winning short trades.
- 6 for 6 in this window, with short trades averaging 23.42% gains across the last six midterm election years.
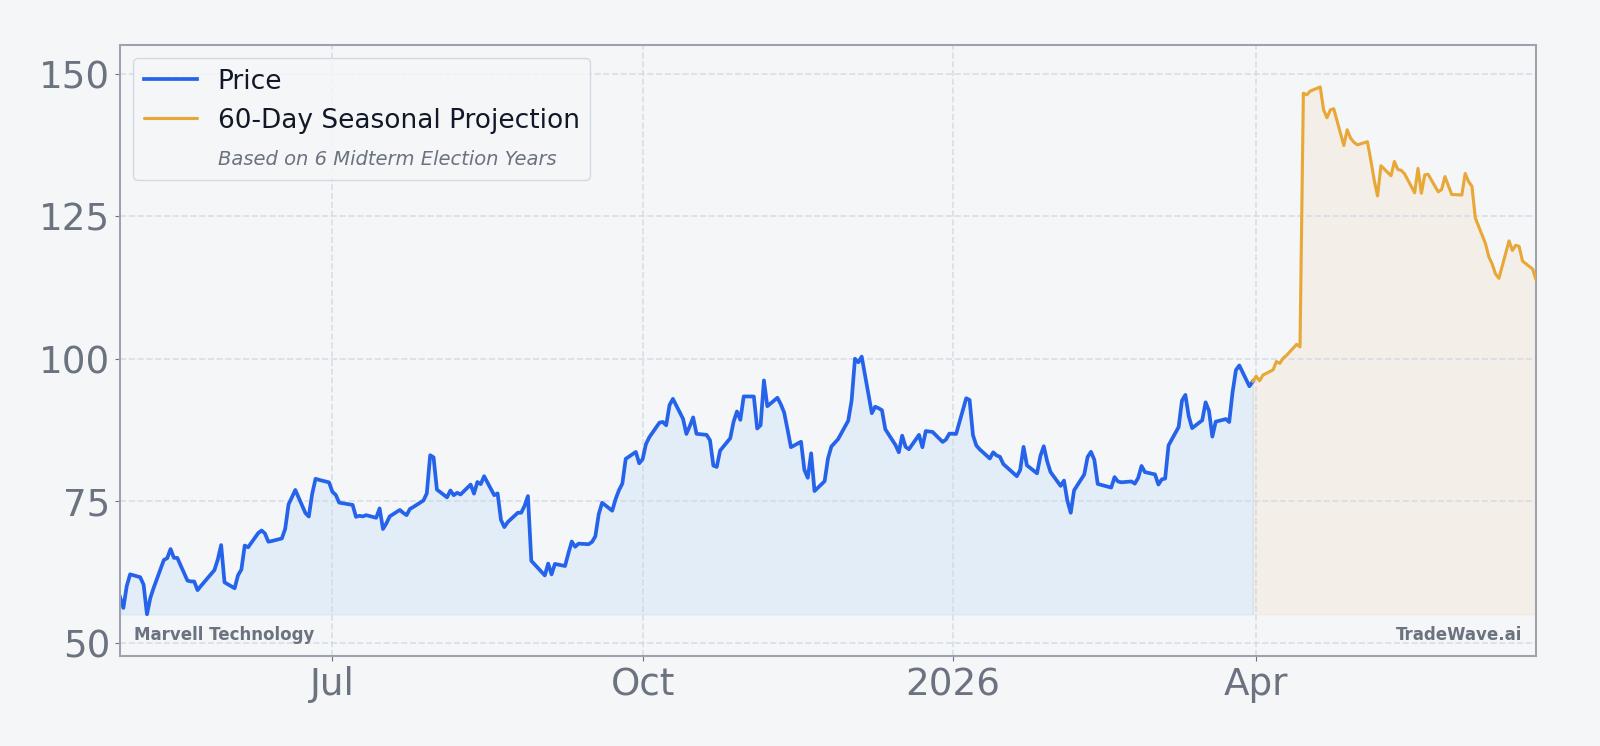
- Seasonal window starts Apr 29 and runs 202 trading days, covering most of the midterm election year into the following spring.
- Percent Profitable is 100%, with 6 winners and 0 losers for the short-side pattern.
- Average profit in winning years is 23.42%, contributing to a 249% cumulative return for the strategy over the sample.
- TradeWave Ratio of 2.32 signals that price has typically traveled meaningfully in the trade direction within the window, while a Sharpe ratio of 2.73 reflects strong risk-adjusted results.
- Individual years have seen adverse moves as deep as roughly one-third against the trade before resolving lower, underscoring the need to respect drawdown risk.
According to historical data from TradeWave.ai, this midterm election-year stretch has behaved very differently from an average calendar period for Marvell, with a clear short-side bias that many investors have not mapped to the political cycle.
How has Marvell Technology (MRVL) traded in past midterm-year windows starting in late April?
Marvell Technology has declined in all six midterm election-year windows that began in late April, with short trades averaging 23.42% gains and no losing years across the sample. The next iteration of this 202-day window begins on Apr 29, with the stock currently at 106.71, about 4.0% above its 52-week high of roughly 102.62 and far from its 52-week low near 46.77.[3] That combination of a stretched price, a clean short-side seasonal record and recent volume and buyback signals gives traders a very different backdrop than the bullish AI headlines suggest.[3]
Because this pattern is grouped by the presidential election cycle, it only looks at the last six midterm election years rather than consecutive calendar years. That matters for a policy-sensitive name like Marvell, where spending on data centers, AI infrastructure and cloud capacity often tracks fiscal priorities and regulatory clarity that shift with the political calendar.[1]
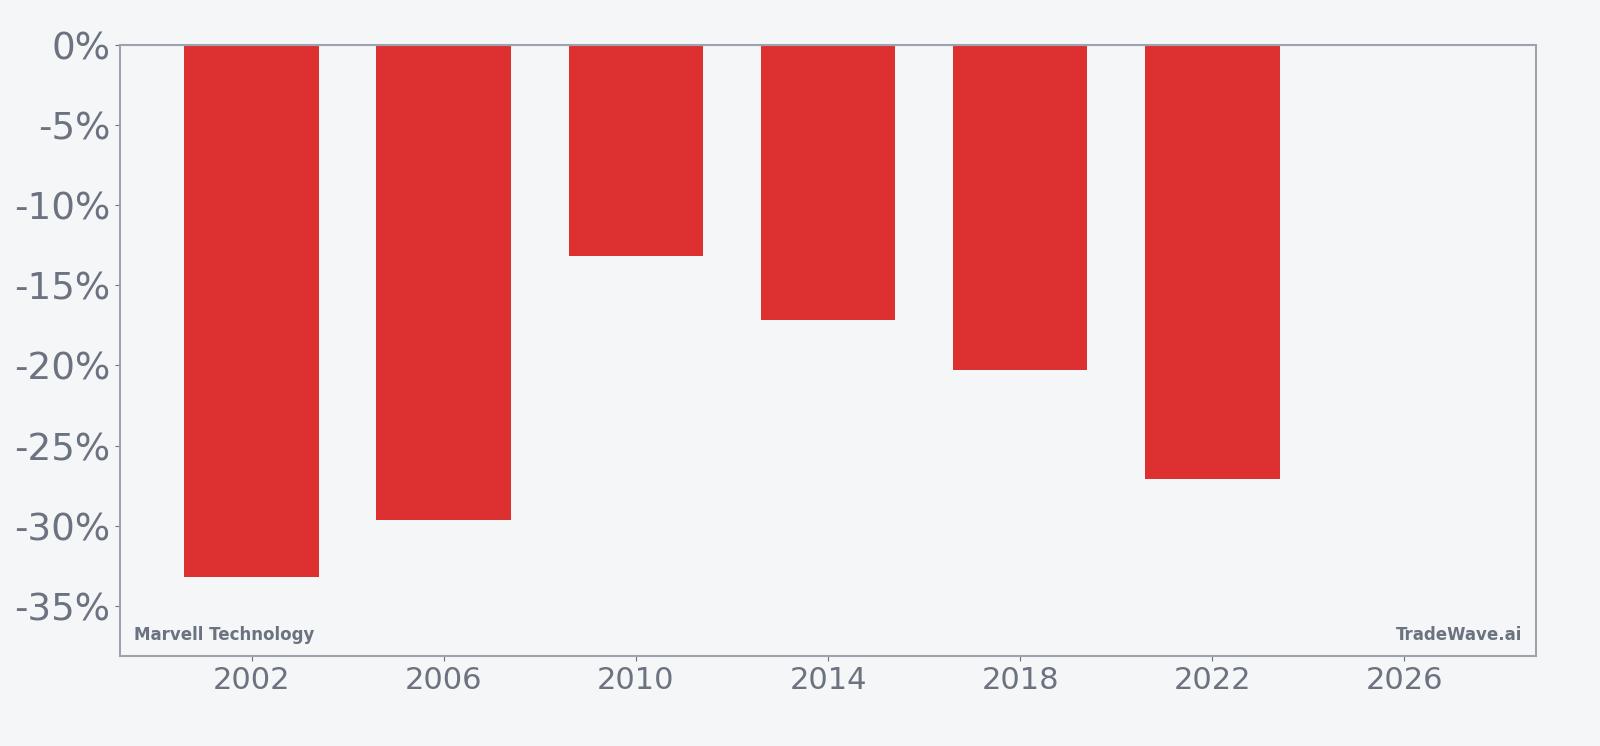
The trade direction for this setup is explicitly short. In each of the six midterm election years in the sample, a short position opened around Apr 29 and held for 202 trading days would have finished in the green, with net returns ranging from about 13% to more than 33% on the downside. The strongest year for the pattern was 2002, when the stock fell roughly 33.18% over the window, while the softest win came in 2010 with a 13.2% decline.
Average profit of 23.42% across winning years compares with a median profit of 23.67%, which tells you the distribution is fairly tight around the low-20s for this short strategy. Add it up and the cumulative return for the pattern is 249%, a sizable haul for traders who were willing to lean against the stock during midterm cycles.
The intraperiod swings have been large. Maximum favorable moves, or the best point-to-peak declines from entry, have ranged from about 5.93% to 21.07% depending on the year, while maximum adverse moves, or worst drawdowns from entry, have stretched as deep as roughly 67.82% in 2002. Even in more moderate years like 2018 and 2022, the worst adverse excursions were around 23.25% and 39.06%, respectively, before the stock ultimately finished lower for the window.
That MAE and MFE profile paints a picture of a high-volatility short window. The stock has often moved sharply against the trade before rolling over, which fits with a story of AI optimism and cyclical rallies giving way to longer digestion phases as the midterm year wears on.[5]
A second view of yearly net returns alongside best and worst intraperiod swings shows how far Marvell has tended to travel in both directions during this window.
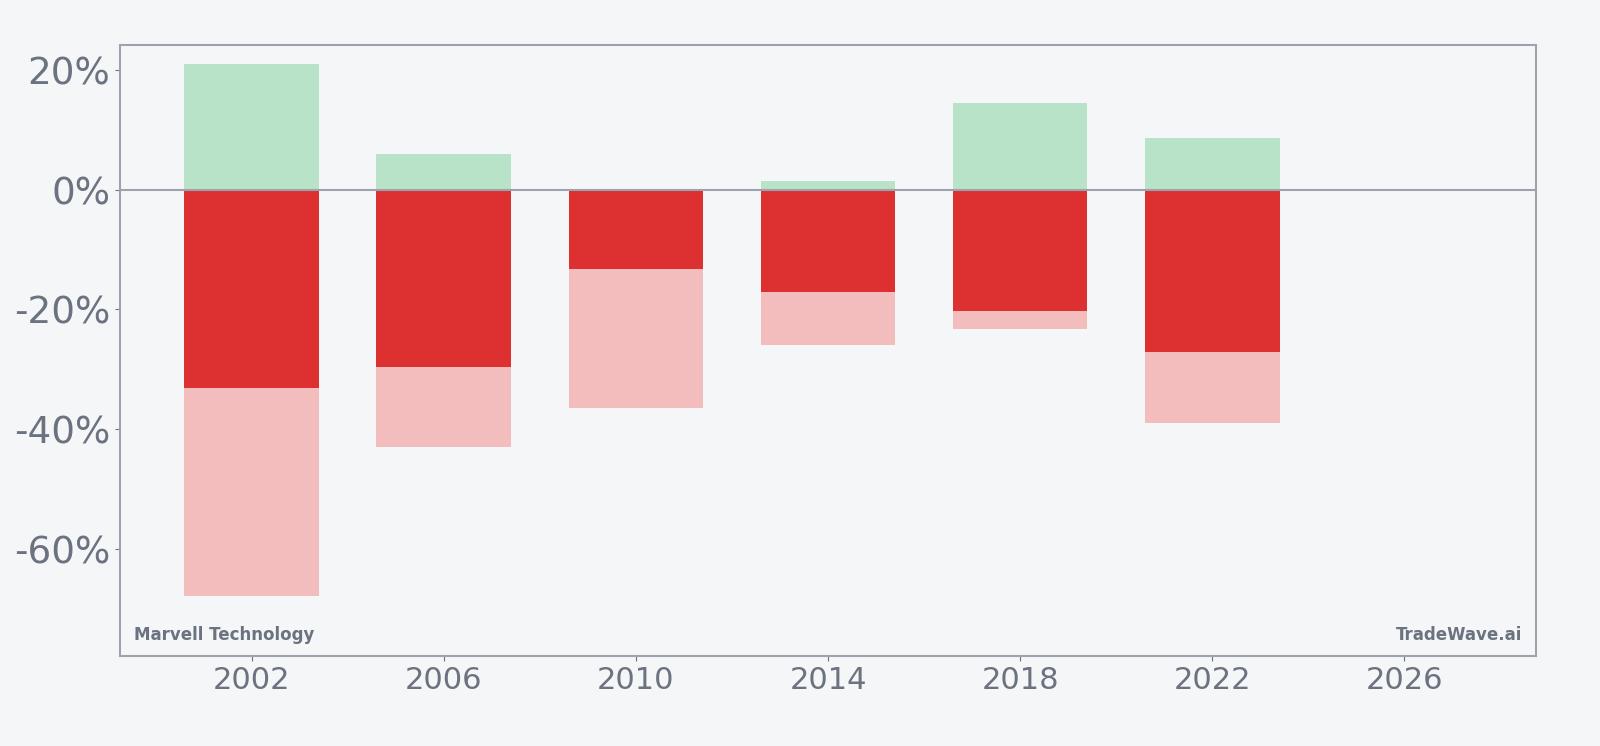
The stacked view of net results, maximum favorable excursion and maximum adverse excursion shows that the best years for the pattern combined deep eventual declines with large interim rallies. In other words, the short side has historically paid, but it has not been a smooth ride.
History does not guarantee future results; adverse excursions can be large even in winning windows, and traders should size risk accordingly.
Why does Marvell Technology (MRVL) follow this seasonal pattern?
One likely driver is the way AI and data center spending plans cluster around the political and fiscal calendar, with midterm years often bringing budget debates and pauses in large infrastructure commitments.[1] Analysts have also pointed to institutional portfolio repositioning in midterm years, when investors rotate within semiconductors after strong runs in AI leaders.[2] This pattern may reflect that combination of policy uncertainty and sector rotation, which has historically made late April through the following spring a tougher stretch for Marvell’s share price.
What is driving Marvell Technology (MRVL) today?
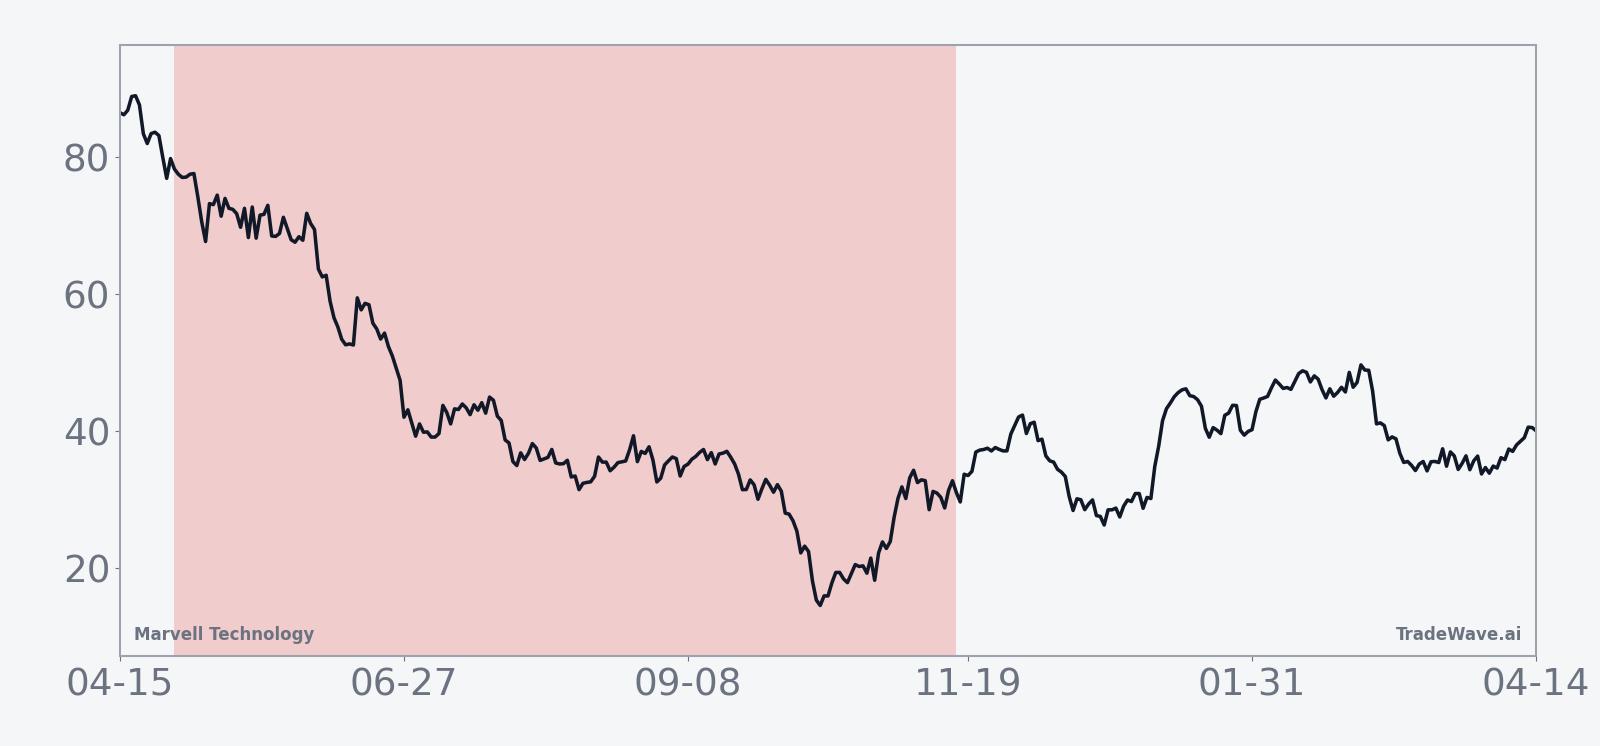
Marvell shares closed at 106.71 on Apr 2, up 7.7% on the day and roughly 27.79% over the past month, leaving the stock about 4.0% above its 52-week high and more than double its 52-week low.[3] The latest leg higher builds on a powerful move that began after Marvell reported upbeat earnings on Mar 5, with revenue up 42% year over year to $8.195 billion and guidance calling for more than 30% growth in fiscal 2027 as AI demand accelerates.[3][4]
The earnings release triggered an 18% single-day surge on heavy volume as investors recalibrated Marvell’s role in AI connectivity and data center infrastructure.[3][7] In the weeks that followed, commentary from major outlets framed Marvell as a key beneficiary of the build-out of AI-capable networks, with some analysts highlighting Nvidia’s $2 billion investment as a validation of its technology stack and long-term revenue potential.[2][5][10] That backdrop has helped push the stock into a leadership role within semiconductors, even as management has paired growth messaging with a $6 billion buyback authorization and increased insider buying to signal confidence in the trajectory.[6]
Macro conditions have also been supportive. AI demand remains a central theme for markets, with spending on data center solutions and high-speed connectivity seen as one of the more durable growth pockets in technology.[1] Within the semiconductor sector, Marvell’s strategic shift toward AI and cloud infrastructure has been credited with supporting stronger margins and a more resilient earnings profile than in past cycles.[1][4]
The chart below situates the latest move in its recent multi-month context and overlays a short-term seasonal projection.
What should traders watch as this midterm-year window approaches?
First, the calendar. The 202-day midterm election-year window opens on Apr 29, so any further upside into that date would mean the pattern is starting from an even more extended level. Traders will be watching whether Marvell can hold above the 100 to 110 zone that has defined the latest breakout or whether supply emerges as the seasonal window kicks in.
Second, the AI narrative. Earnings guidance and commentary from management framed fiscal 2027 as another year of 30% plus revenue growth, driven by AI and data center demand.[3][4] If upcoming macro data or peer results hint at a slowdown in AI infrastructure spending, that could align with the historical tendency for midterm-year digestion in high-growth semis.
Third, the Special Insight around volume and insider posture. The 18% post-earnings spike came on unusually heavy trading, and management has backed the story with a large buyback and increased insider buying.[3][6] If that supportive flow fades, or if buyback execution slows while the stock trades near highs, it would remove a key cushion just as the historically weak midterm window begins.
Finally, behavior inside the window will matter as much as the start. History shows that Marvell has often seen sharp rallies against the short before rolling over, with maximum adverse moves in some years exceeding 30% before the trade worked.[2] If the stock powers higher early in the window and refuses to give back gains, that would contradict the historical pattern; if instead rallies stall and lower highs appear against a still-bullish AI backdrop, it would look more like prior midterm cycles.
Sources
- [1] Forbes – “Should You Buy Marvell Technology Stock Today?” (Dec 30, 2025)
- [2] Seeking Alpha – “Marvell’s Growth Story Just Changed (NASDAQ:MRVL)” (Mar 31, 2026)
- [3] MarketWatch – “Marvell’s stock rockets 18% as data-center business demand grows” (Mar 5, 2026)
- [4] Wall Street Journal – “Marvell Technology Raises Sales View As AI Developers Spend on Data Centers” (Mar 5, 2026)
- [5] Forbes – “Marvell Stock: AI Forecast Sparks Massive Investor Interest” (Mar 9, 2026)
- [6] Seeking Alpha – “Marvell: Significant AI Win Coming Soon (Double Upgrade)” (Oct 6, 2025)
- [7] Barron’s – “Marvell Earnings Beat Estimates on ‘Robust’ AI Demand” (Mar 5, 2026)
- [8] Seeking Alpha – “Marvell Could Be A 'Marvellous' Buy (NASDAQ:MRVL)” (Oct 5, 2025)
- [9] Reuters – “Marvell forecasts first quarter revenue above estimates” (Mar 5, 2026)
- [10] Seeking Alpha – “ETFs tied to Marvell Technology jumped following Nvidia investment news” (Mar 31, 2026)
About this seasonal analysis
Seasonal pattern data is sourced from TradeWave.ai, which analyzes historical price behavior across annual calendar windows going back up to 30 years. Read the full data methodology or the book The 100-Year Pattern by Afshin Moshrefi (2026 edition). Past performance of seasonal patterns does not guarantee future results. This article is for informational purposes only and does not constitute investment advice.