ON Semiconductor (ON) Has Dropped in 6 of 6 Midterm Springs, Averaging 6.31% Short Profits
ON Semiconductor is stepping into a 30-day midterm-election-year window that has reliably favored short sellers, even as shares trade well below last year’s peak.

What is the seasonal pattern for ON Semiconductor (ON)?
ON Semiconductor has fallen in 6 of 6 midterm-election-year spring windows during this 30-day stretch, with an average gain of 6.31% in winning short trades.
- 6 for 6 in this window, with short trades averaging 6.31% gains across the last six midterm election years.
- The 30-day ON seasonal window starts Apr 2 and has historically favored downside moves for the stock.
- Percent Profitable is 100%, with 6 winners and 0 losers for the short-side pattern.
- Average profit per winning year is 6.31%, while the median outcome clocks in at a 5.92% move in the trade direction.
- Past windows have seen sharp swings, including maximum favorable moves above 40% and adverse excursions deeper than 30% in individual years.
- The pattern sits in the midterm election year phase, where policy uncertainty and sector rotation have often amplified volatility in semiconductor names.
According to historical data from TradeWave.ai, this specific midterm-year stretch has behaved very differently from an average month for ON Semiconductor. The next section walks through how that election-cycle pattern has played out in prior years and what it means for the current 30-day window.
How has ON Semiconductor (ON) traded in this midterm-year spring window?
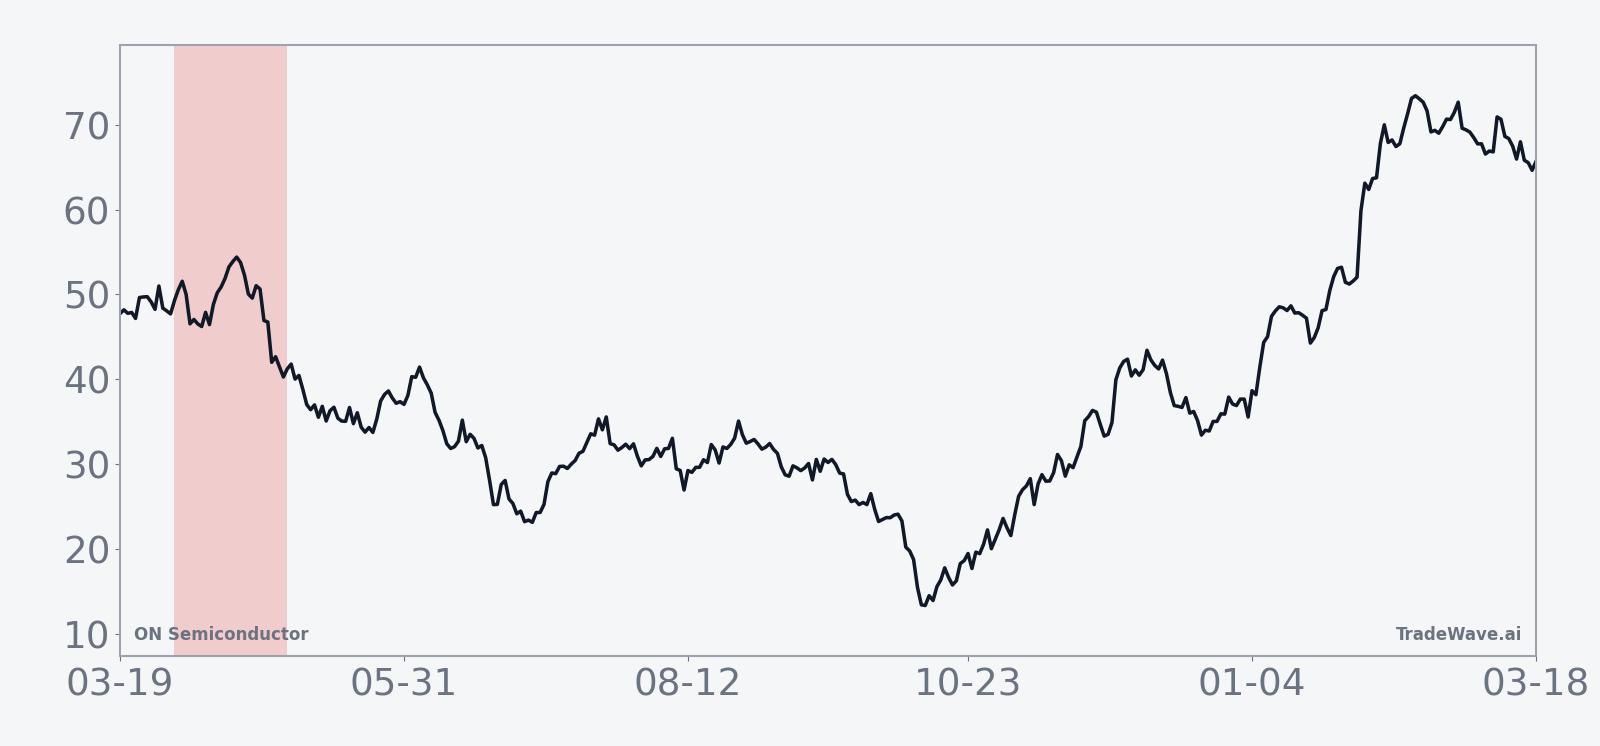
ON Semiconductor has declined in all six midterm-election-year spring windows starting around Apr 2, with short trades posting an average profit of 6.31% and a cumulative gain of 43%. Shares closed Thursday at 62.20, up 0.45% on the day and about 15.6% below the 52-week high of 73.76, leaving room on the chart if the historical pattern repeats.
Grouping the data by the presidential election cycle matters here because this window only looks at the last six midterm election years, not every calendar year. Midterm years often bring a mix of policy uncertainty, tariff noise and shifting expectations for industrial and EV demand, which can hit cyclical chipmakers like ON Semiconductor harder than the broader market.
The trade direction for this pattern is explicitly short. In other words, the “winning” years are the ones where ON drifted or dropped lower over the 30-day span, delivering positive returns for a hypothetical short position. Across those six midterm-year samples, Percent Profitable is 100%, with 6 winners and 0 losers, and the median move in the trade direction is 5.92%.
Average profit of 6.31% reflects the mean outcome across all six years, each of which finished with the stock lower than where it started the window. The annualized return of 6.21% and a Sharpe ratio of 1.2 point to a historically favorable risk-adjusted profile for the short-side setup, at least within this narrow slice of the calendar.
The TradeWave Ratio (TWR) for this pattern is 1.22, which describes how far price typically travels in the trade direction within the window, independent of the final close. That figure suggests that intraperiod moves have often extended meaningfully beyond the simple end-to-end change, creating room for active traders to manage risk and take partial profits inside the 30 days.
Intraperiod swings have been anything but mild. In 2002, for example, ON delivered a net return of -15.35% for the short trade, but the maximum favorable move reached 41.53% at one point, while the worst drawdown from entry hit -30.02%. In 2022, the net short-side gain was -6.66%, with a maximum adverse move of -15.09%, showing that even “good” years for the pattern have included painful squeezes along the way.
Looking across all six years, the maximum favorable excursion, or best point-to-peak move within the window, has ranged from modest single digits to that 41.53% spike. The maximum adverse excursion, or worst drawdown from entry, has also been sizable in several years, underscoring that this ON seasonal trend has historically come with real volatility on both sides before settling lower by day 30.
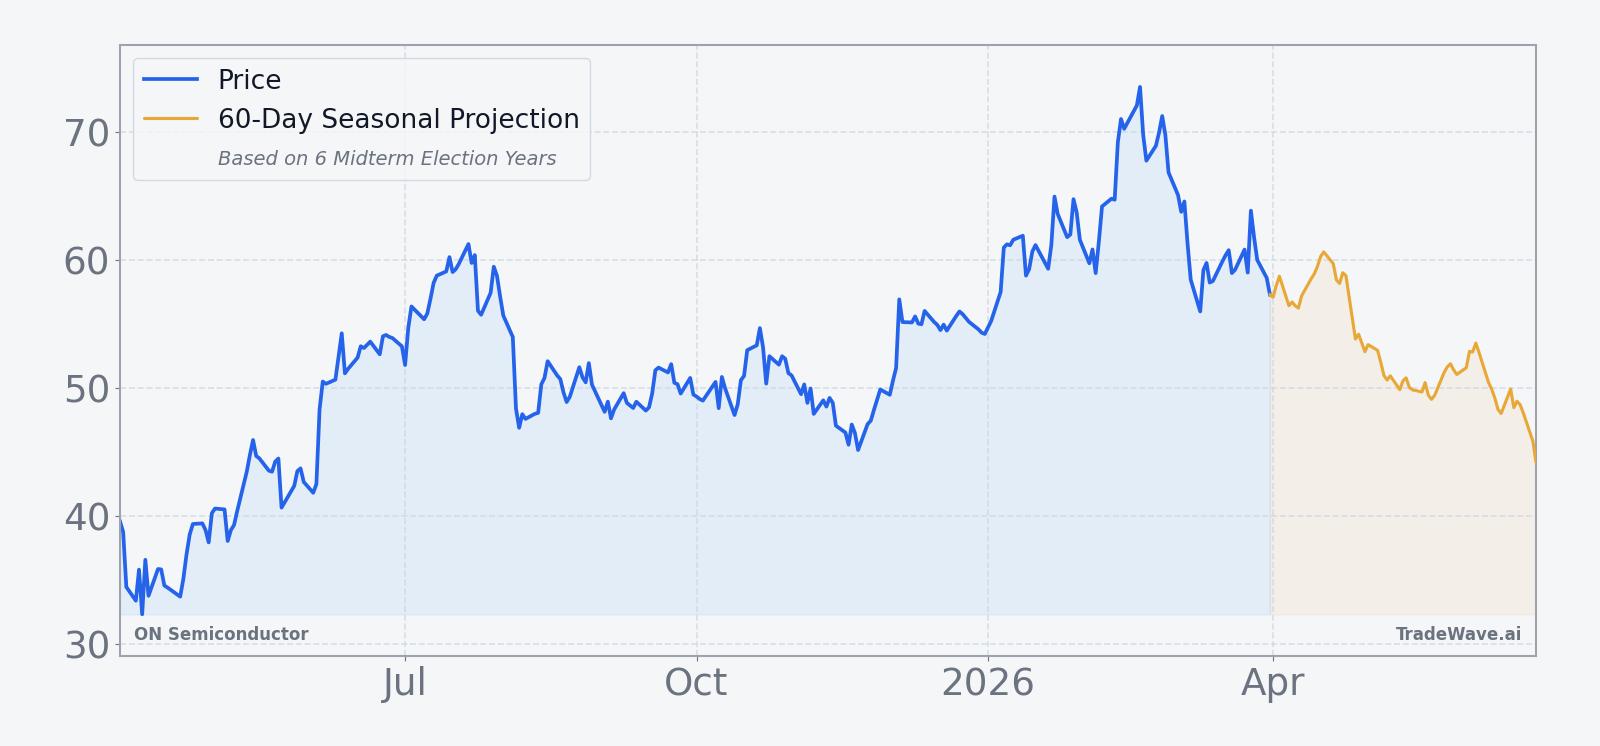
The historical seasonal trend chart for this window shows a tendency for weakness to build gradually rather than in a single air pocket. The average path slopes lower over the month, with some early chop followed by more consistent downside in the back half of the window, which lines up with the idea of investors digesting earnings and guidance while reassessing EV and industrial demand.
A second view that stacks net results with best and worst intraperiod moves shows how far ON has tended to swing before the window closes.
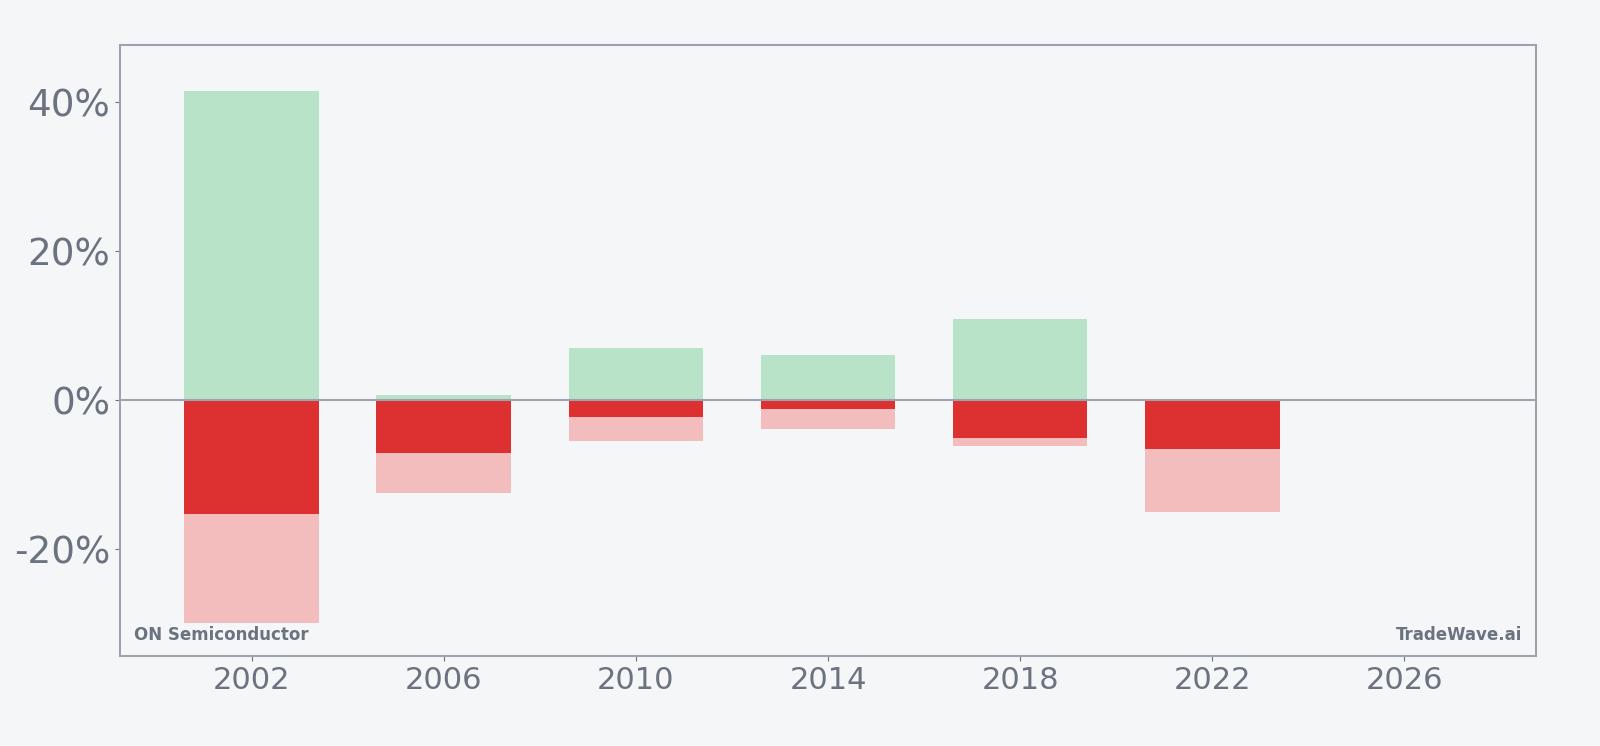
History does not guarantee future results, and maximum adverse excursions have been large in several years even when the window ultimately finished in the trade’s favor.
Why does ON Semiconductor (ON) follow this seasonal pattern?
One likely driver is the way ON’s earnings calendar and guidance often land in the early part of midterm election years, when investors are already nervous about tariffs, industrial demand and policy shifts. Analysts have also pointed to sector rotation inside the semiconductor group, as money moves between EV, analog and AI-exposed names during these periods. The result is a recurring 30-day stretch where ON has tended to absorb selling pressure while portfolios are being repositioned for the next leg of the cycle.
What is driving ON Semiconductor (ON) today?
ON Semiconductor closed Thursday at 62.20, up 0.28 on the day, after trading between 61.96 and 63.69, with volume slightly below its 20-day average of about 7.1 million shares. The stock sits roughly 15.6% below its 52-week high of 73.76 and just under its 50-day moving average of 63.34, a spot on the chart where traders often reassess whether a pullback is a pause or the start of something deeper.
Near-term sentiment is still shaped by the company’s Feb 9 earnings report, when ON missed Q4 revenue estimates at 1.53 billion dollars and guided Q1 2026 revenue to 1.44 billion to 1.54 billion, below Wall Street’s 1.51 billion-dollar expectation.[4] Adjusted EPS of 64 cents topped forecasts, but the combination of an 11% year-over-year revenue decline and softer guidance reminded investors that the post-pandemic boom in some end markets is fading.[3][4]
That report followed a more constructive stretch in 2025, when ON posted Q3 revenue of 1.55 billion dollars versus estimates of 1.51 billion and EPS of 63 cents versus 54 cents, helped by AI-related demand, even as earlier quarters showed revenue down 22% year over year.[2][5] The bigger picture is a company caught between resilient EV and AI demand on one side and a broader industrial slowdown on the other, a mix that has produced choppy trading around earnings rather than a clean trend.
Macro and sector context add another layer. Reuters reported in May 2025 that ON’s upbeat revenue forecast leaned heavily on resilient demand from EV makers despite tariff uncertainty, while more recent commentary has highlighted stabilizing end markets and growing AI-related revenue across the semiconductor space.[1][2][5] That backdrop helps explain why ON is not trading at the lows of the past year even after a revenue miss, but it also means the stock is sensitive to any fresh headlines on tariffs, EV incentives or data-center spending.
The chart below shows how ON’s latest move fits into its past year of trading, along with a 60-day seasonal projection overlay.
Sources
- [1] Reuters, "Chipmaker Onsemi forecasts upbeat quarterly revenue on resilient demand from EV makers," May 5, 2025.
- [2] The Wall Street Journal, "ON Semiconductor Results Show Stabilizing End Markets," Aug 4, 2025.
- [3] CNBC, "Stocks making the biggest moves after hours: ON Semiconductor, Upwork, Chegg and more," Feb 9, 2026.
- [4] Reuters, "Chipmaker Onsemi misses quarterly revenue estimates, shares fall," Feb 9, 2026.
- [5] Yahoo Finance, "Earnings live: Palantir stock rises modestly on strong results, Hims & Hers stock surges," Nov 3, 2025.
About this seasonal analysis
Seasonal pattern data is sourced from TradeWave.ai, which analyzes historical price behavior across annual calendar windows going back up to 30 years. Read the full data methodology or the book The 100-Year Pattern by Afshin Moshrefi (2026 edition). Past performance of seasonal patterns does not guarantee future results. This article is for informational purposes only and does not constitute investment advice.