Boston Scientific (BSX) Has Rallied in 6 of 6 Midterm April Windows, Next Starts Apr. 8
Boston Scientific is sliding toward its 52-week low just as a historically strong midterm-year April window approaches, setting up a clash between seasonality and competitive pressure.

What is the seasonal pattern for Boston Scientific (BSX)?
Boston Scientific has risen in 6 of 6 midterm-year April windows during this 12-day stretch, with an average gain of 3.84% in winning years.
- 6 for 6 in this window, with Boston Scientific averaging 3.84% gains across all six midterm-year runs.
- The upcoming 12-day trading window starts Apr. 8 and has historically favored long positions in BSX.
- Percent Profitable is 100%, with 6 winners and 0 losers in the last six comparable midterm election years.
- Average winner gains of 3.84% come with a TradeWave Ratio of 2.2 and a Sharpe ratio of 1.85, pointing to strong risk-adjusted returns.
- Intraperiod swings have included favorable moves of up to 8.79% and adverse moves as deep as about 3%, so volatility inside the window has mattered.
- The pattern sits in the early part of the midterm election year, a phase that often brings policy uncertainty but has been a bright spot for BSX in this specific slice of April.
According to historical data from TradeWave.ai, this early-April stretch has behaved very differently from an average month for Boston Scientific. The next section looks at how that pattern has played out across the last six midterm election years and what it implies for the upcoming window.
How has Boston Scientific (BSX) traded in this midterm-year April window?
Boston Scientific has risen in 6 of 6 midterm election years during this 12-day April window, averaging 3.84% gains with no losing runs. The next iteration begins on Apr. 8, with the stock last changing hands at 62.75, about 42.7% below its 52-week high of 109.50 and hovering just above a 52-week low of 61.25.[1] Recent trading has also featured an options strategy betting on the stock catching up to the broader market and a one-day volume spike to roughly six times normal levels during a sharp selloff, signaling that positioning around this name is already in motion.[1]
Grouping the data by the presidential election cycle matters here because this pattern only looks at the last six midterm election years, a phase that often brings shifting policy expectations and healthcare reimbursement debates. In that context, Boston Scientific’s midterm-year April behavior has been unusually consistent compared with the choppier action many stocks see early in the cycle.
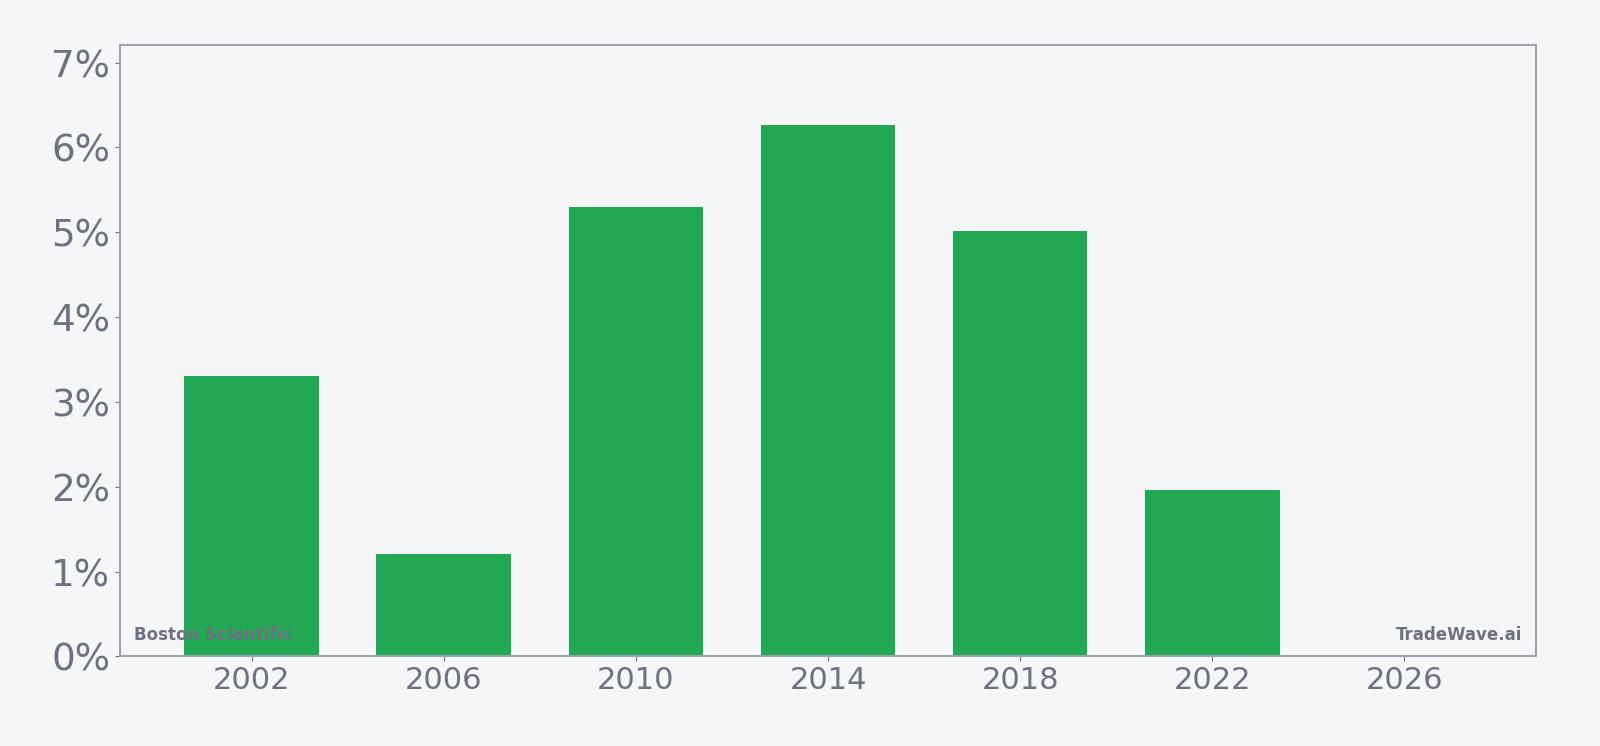
Across those six midterm years, every single run in this 12-day Boston Scientific trading window finished positive, with net gains ranging from 1.21% in 2006 to 6.27% in 2014. Average profit of 3.84% and a Sharpe ratio of 1.85 point to a historically favorable risk-adjusted profile for long exposure during this slice of April. Add it up and the cumulative return across all six windows is 25%, a solid contribution for a period that spans just over two trading weeks each time.
The per-year table shows that the strongest outcome came in 2014, when the stock gained 6.27% from entry to exit, while 2010 and 2018 also delivered more than 5% net returns. Even the softer years, such as 2006 and 2022, still finished in the green with 1.21% and 1.96% gains respectively. That mix suggests the BSX seasonal trend in this window has leaned more toward steady upside than boom-or-bust spikes.
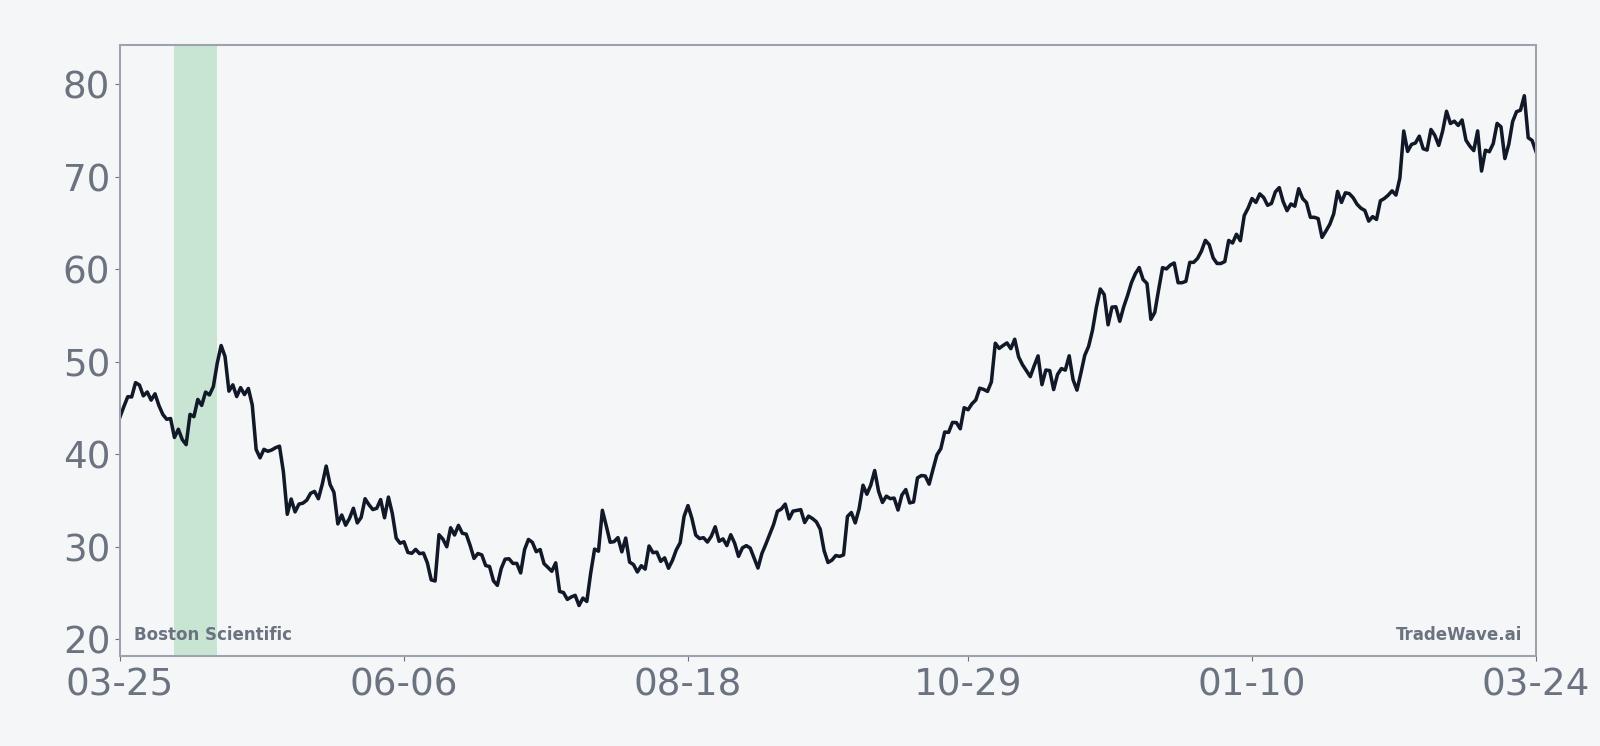
The historical seasonal average curve for this window slopes higher in a relatively smooth fashion, with most of the gains accruing steadily rather than in a single burst. That profile fits a pattern where buyers gradually accumulate exposure across the window instead of reacting to one binary event.
A stacked view of net returns alongside best and worst intraperiod moves shows how upside potential has compared with drawdown risk in each year.
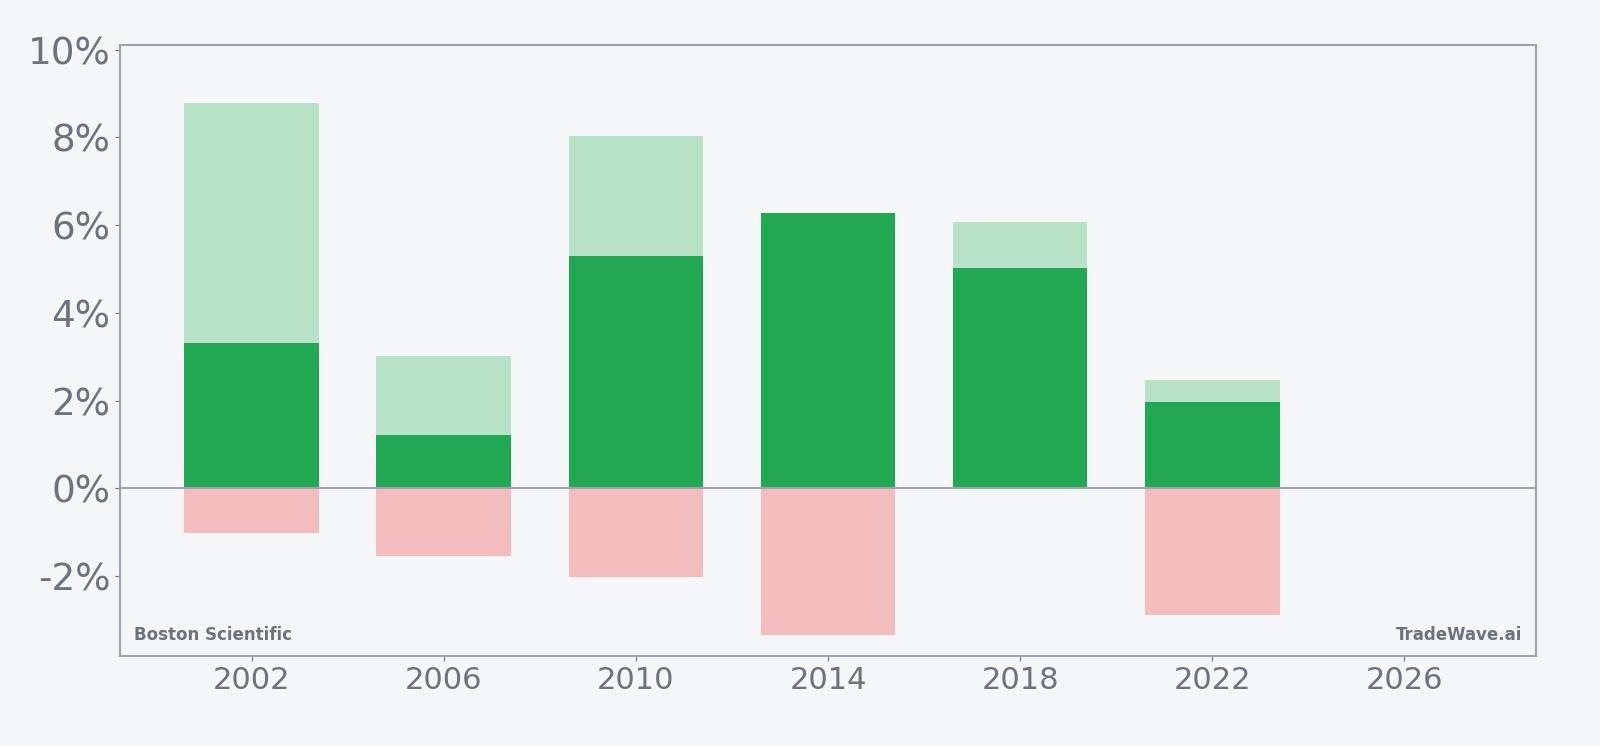
Intraperiod swings have still mattered. Maximum favorable moves have reached as high as 8.79% in 2002 and 8.02% in 2010, while the worst drawdowns from entry have ranged from about 1% to just under 3% in most years. That combination of solid upside with contained but non-trivial downside is what drives the TradeWave Ratio of 2.2, indicating that price has typically traveled meaningfully in the long direction within the window even when final closes were more modest.
History does not guarantee future results; adverse excursions (MAE) can be large even in winning windows.
Why does Boston Scientific (BSX) follow this seasonal pattern?
One likely driver is the clustering of Boston Scientific’s investor updates and product news flow around the spring, which can shape expectations for the rest of the year in midterm cycles.[2] Analysts have also pointed to steady growth in cardiovascular and MedSurg devices as a reason institutions lean into the name when macro and policy headlines are noisy but fundamentals look durable.[2] This pattern may reflect portfolio managers using early midterm-year volatility to add to high-conviction medical device holdings before the pre-election year, which has often been friendlier for risk assets.
What is driving Boston Scientific (BSX) today?
Boston Scientific shares closed at 62.75 on Apr. 1, down 0.3% on the day and roughly 15% lower over the past month as the stock slid from a 52-week high of 109.50 toward a recent low near 61.25.[1] The pullback follows a period when the company lost its monopoly premium in electrophysiology, shifting to a duopoly that erased a chunk of market value as investors reassessed how much they were willing to pay for its growth story.[1] In February, Boston Scientific also reported higher profit and double-digit sales growth but paired it with soft full-year guidance, a combination that pressured the stock despite strong operational metrics.[2] The same stretch saw trading volume spike to roughly six times the three-month average during a sharp decline and an options strategy emerge that effectively bet on the stock catching up to the broader market, underscoring how sentiment has swung from crowded long to more tactical positioning.[1]
The chart below situates the latest move against the past year of trading and a 60-day seasonal projection.
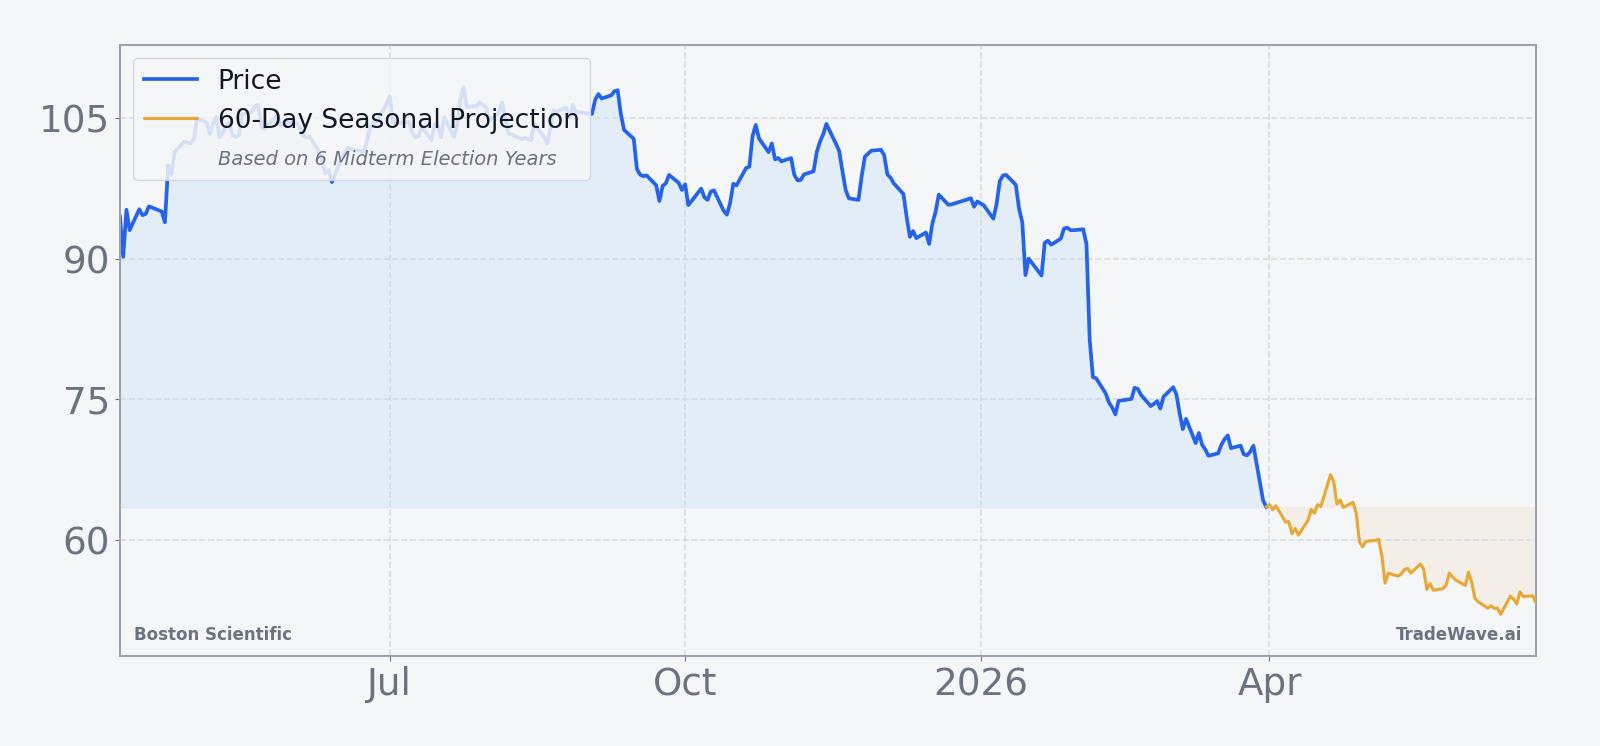
Fundamentally, Boston Scientific still sits in a growth pocket of the medical devices sector, with cardiovascular revenue up 18% and MedSurg up 12% in the latest reported quarter, and management guiding to 10.5% to 11.5% sales growth for the year.[2] That backdrop has kept the stock in many long-term growth portfolios even as near-term competition in electrophysiology and guidance conservatism have taken some shine off the story.[1][2] The tension heading into this midterm-year seasonal window is clear: the historical BSX seasonal trend has been strongly positive in early April, but the stock is entering it from a position of technical weakness and elevated options and volume activity.
What should traders watch in this upcoming window?
For this 12-day Boston Scientific trading window starting Apr. 8, the first thing to watch is whether the stock can hold above or reclaim the low-60s area that has marked recent support. A firming tape there would align with the historical pattern of steady gains across the window, while a decisive break below the 52-week low would mark a clear departure from prior midterm-year behavior.[1]
Second, monitor how the stock trades around any incremental news on electrophysiology competition or device launches. In past cycles, strong product narratives have helped investors look through macro and policy noise, which may be one reason this specific April window has skewed positive even in the more volatile early part of the midterm election year.[1][2]
Third, keep an eye on options flow and volume. If the earlier catch-up options strategy and the six-times-average volume spike were the start of a larger repositioning, continued heavy call buying or sustained high turnover would suggest that institutions are leaning into the seasonal tailwind rather than fading it.[1] On the other hand, a fade in activity or a shift toward protective puts during the window would signal that traders are using any seasonal strength to reduce risk instead of add it.
Finally, because this pattern sits in the early midterm election year, policy headlines around healthcare reimbursement, regulation and fiscal priorities could inject extra volatility into an otherwise constructive seasonal backdrop. If Boston Scientific can navigate that noise while respecting the historical BSX seasonal trend in this window, it would reinforce the idea that this early-April stretch remains a reliable spot for the stock’s long-term growth story to reassert itself.
Sources
About this seasonal analysis
Seasonal pattern data is sourced from TradeWave.ai, which analyzes historical price behavior across annual calendar windows going back up to 30 years. Read the full data methodology or the book The 100-Year Pattern by Afshin Moshrefi (2026 edition). Past performance of seasonal patterns does not guarantee future results. This article is for informational purposes only and does not constitute investment advice.