Micron Technology (MU) Has Fallen in 9 of 10 Midterm Windows, Averaging 21% Short Profits
Micron Technology is racing higher on AI demand even as it approaches a midterm-year seasonal window that has historically rewarded short sellers and delivered sharp swings.

What is the seasonal pattern for Micron Technology (MU)?
Micron Technology has fallen in 9 of 10 midterm-year windows starting around early May, with an average 23.74% gain for the short side in winning years.
- 9 for 10 in this window, with shorts averaging 23.74% profits in winning years across the last 10 midterm election cycles.
- Seasonal trade direction is short from May 2 for 164 trading days, covering much of the midterm year into the following phase.
- Percent Profitable is 90%, with 9 winners and 1 loser for the short setup in this Micron Technology trading window.
- Including every year, Avg Profit - All is 21%, reflecting one modest losing year against several large downside moves.
- The worst intraperiod drawdowns have reached more than 50% in some years, underscoring how volatile this MU seasonal trend can be.
- TradeWave Ratio of 1.69 and a Sharpe ratio of 1.08 point to a historically strong but risk-heavy short pattern in this semiconductor seasonal outlook.
According to historical data from TradeWave.ai, Micron’s behavior in midterm election years has shown a distinct seasonal bias that most investors never see in standard earnings or valuation work.
How has Micron Technology (MU) traded in this midterm-year window?
Micron Technology has delivered profitable short trades in 9 of the last 10 midterm election years during a 164-day window that begins on May 2, with winning years averaging 23.74% gains for the short side. Today the stock closed at 366.24, down 0.4% on the session, up about 58% year to date and roughly 22.3% below its 52-week high of 471.34.[1] Options traders recently leaned heavily into bullish calls ahead of Micron’s March earnings, pricing in an 8% to 9% move and signaling that positioning around this name can flip quickly when catalysts hit.[9]
Grouping Micron’s history by the presidential election cycle shows this pattern is specific to the midterm year, not just any random stretch on the calendar. Pattern phase is labeled as the last 10 midterm election years, while the calendar today sits in the early part of the current midterm year, so the upcoming window overlaps a period when policy uncertainty and rate debates often run hottest.
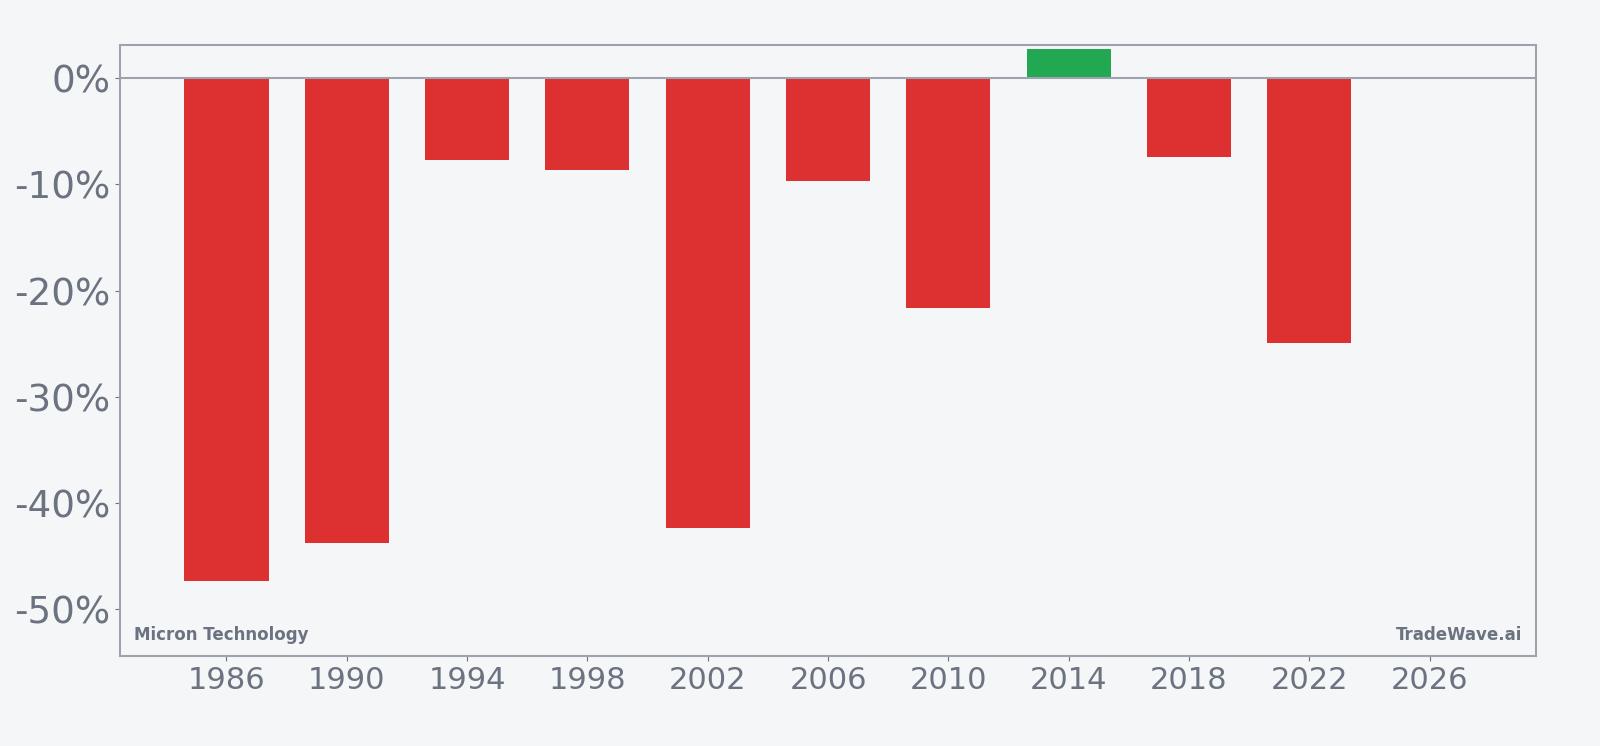
This seasonal window begins on May 2 and spans 164 trading days. Historically, during this period Micron Technology has tended to reward short positions, with 9 winners and just 1 losing year for the short side and a 90% Percent Profitable record. The average winner has produced a 23.74% gain for shorts, while including every year in the sample brings Avg Profit - All to 21%, which is still a large move for a single seasonal regime.
The per-year table shows how extreme some of those down years have been. In 1986, a short entered at 1.36 and exited at 0.72, a net return of about -47.37% for the stock and a very strong outcome for the short, with the worst intraperiod drawdown from entry reaching -57.9% before the window closed. In 2002, another midterm year, Micron fell about -42.34% from entry to exit, with the worst adverse excursion from the short’s perspective limited to -51.37%, again underscoring how deep the stock’s declines have been in some cycles.
The one losing year for the pattern came in 2014, when Micron rallied 2.74% from entry to exit, turning a small loss for shorts despite a maximum favorable move of 32.46% at one point in the window. That profile shows how timing inside the window has mattered: even in the lone losing year, there was a sizable intraperiod drop before the stock squeezed higher into the close of the regime.
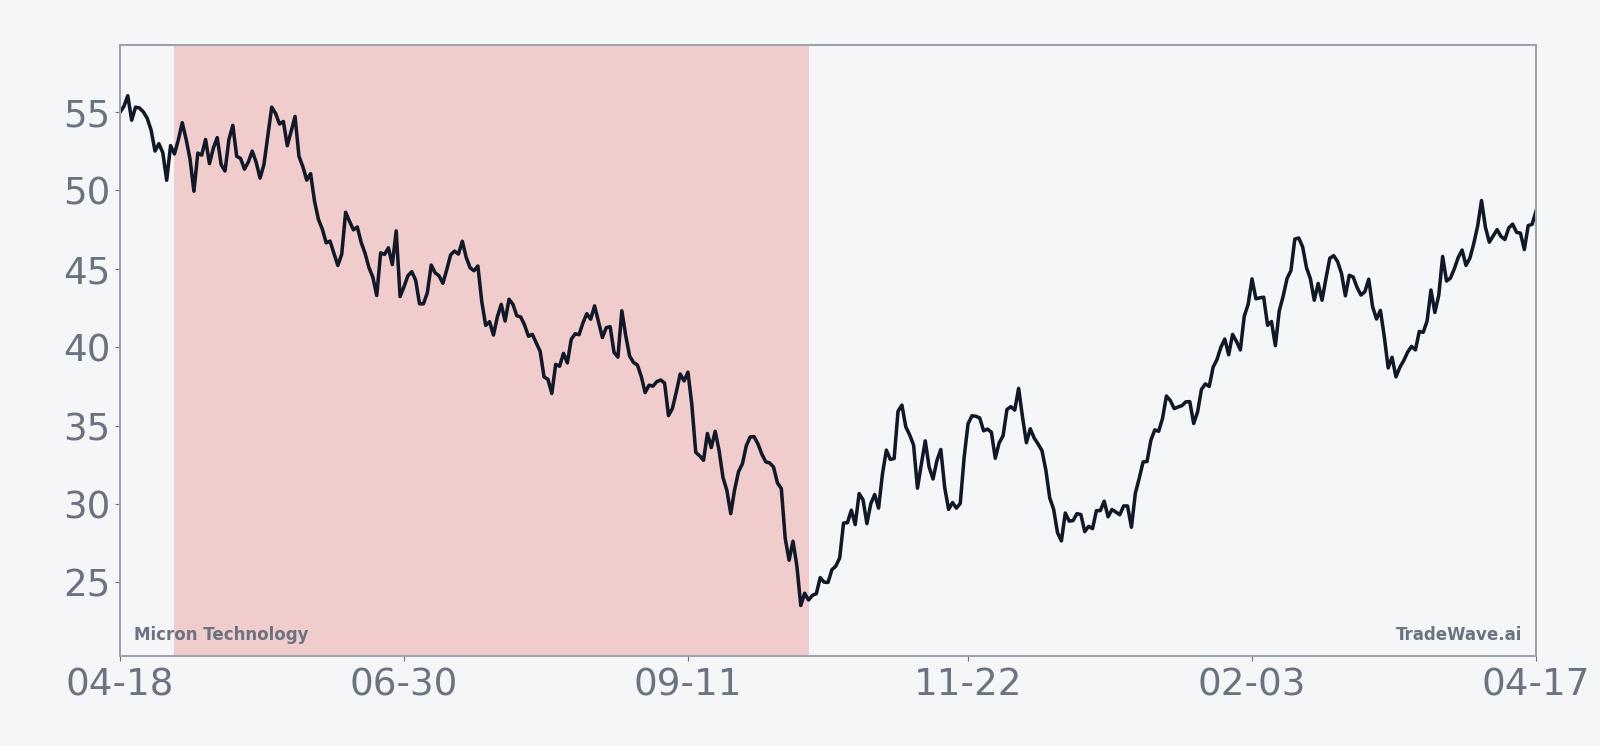
The historical seasonal average trend line slopes lower across much of the window, with the bulk of the downside accruing in the middle third of the period. Early days often show choppy action, followed by a more persistent drift lower, then a tendency to stabilize or even bounce late as the market transitions toward the year before the presidential election.
A second view that stacks net returns with best and worst intraperiod moves helps show how far Micron has typically swung inside this window.
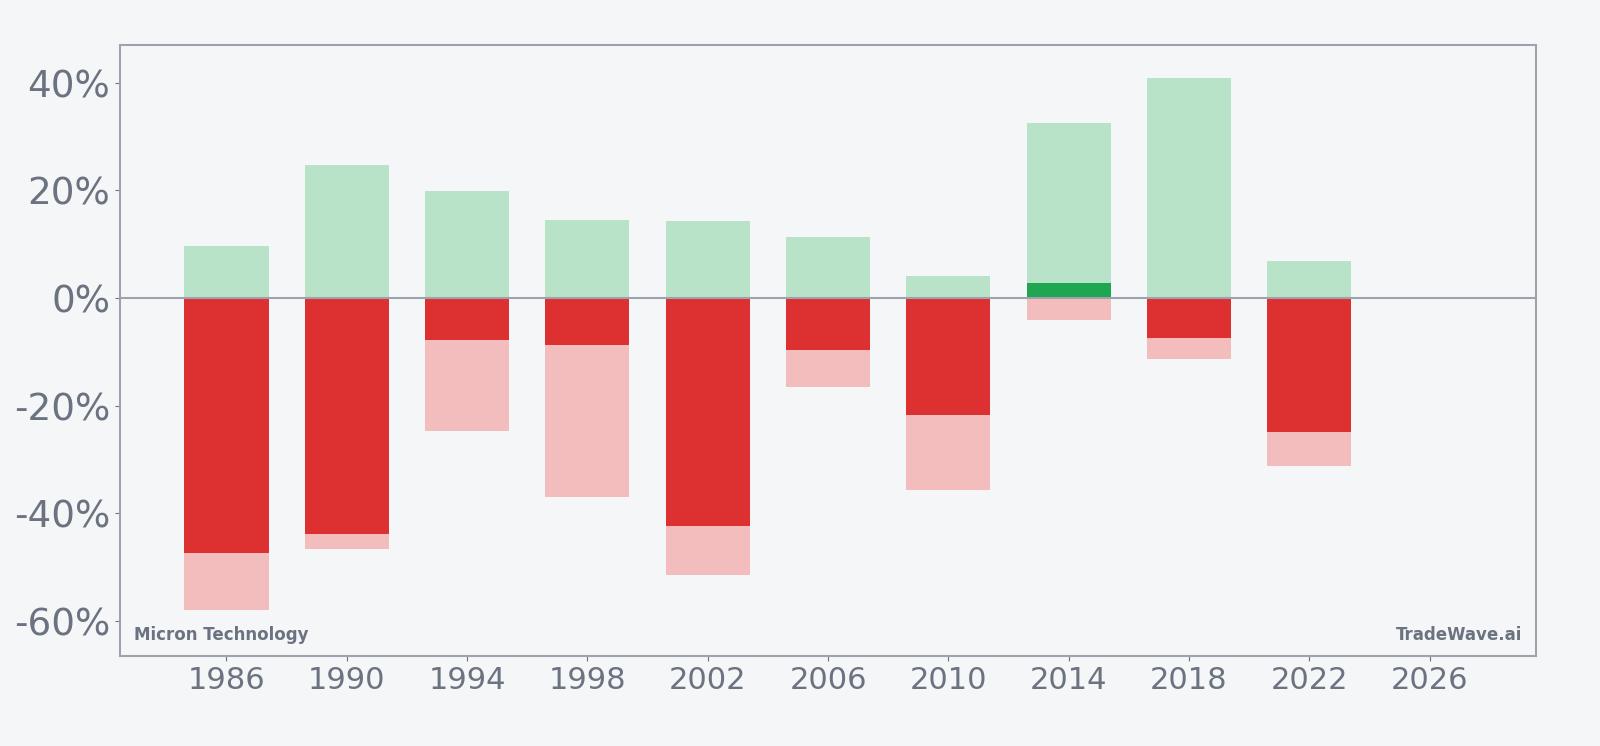
The stacked net, maximum favorable move and maximum adverse move bars show a high-variance environment: in many years Micron has offered shorts large favorable swings while still posting meaningful countertrend rallies inside the window. Large maximum adverse excursions in 1986, 1990 and 2002 highlight that even in strong down years, the stock has not moved in a straight line, and rallies against the short have sometimes been sharp before the broader decline reasserted itself.
History does not guarantee future results, and maximum adverse excursions can be large even in winning windows, so traders using this pattern need to respect the potential for sharp countertrend moves.
Why does Micron Technology (MU) follow this seasonal pattern?
One likely driver is how Micron’s earnings calendar and capital spending plans line up with the midterm election year, when policy debates around fiscal stimulus, trade and regulation can shift investor appetite for cyclical semiconductors. Analysts have also pointed to the memory market’s tendency to swing from shortage to glut on a roughly multi-year cadence, which can intersect with this window as pricing power fades or supply ramps.[8] The pattern may also reflect institutional portfolio repositioning around the midyear point, when big funds reassess exposure to high-beta AI and memory names against a changing macro and policy backdrop.
What is driving Micron Technology (MU) today?
Micron shares slipped 0.4% to 366.24 on Friday, extending a modest pullback even as the stock remains up about 58% year to date and roughly 22.3% below its 52-week high of 471.34.[1] The move comes in the wake of a blockbuster Q2 fiscal 2026 report on Mar 18, when Micron posted revenue of $23.86 billion versus estimates of $19.51 billion and earnings of $12.20 per share against a $9.00 consensus, powered by AI infrastructure demand for high-bandwidth memory and data center products.[1] Despite that beat, the stock fell more than 4% around the release as investors took profits after a historic run, even as analysts broadly praised guidance that called for Q3 revenue of $33.5 billion and EPS of $19.15 with gross margins near 81%.[2][4]
In the days leading into that report, options markets were leaning hard to the upside, with bullish call positioning and implied pricing for an 8% to 9% post-earnings move, a reminder that Micron has become a favored vehicle for traders looking to express views on the AI build-out.[9] At the same time, short interest sat at about 2.61%, a relatively low level that leaves room for positioning to rebuild if the seasonal pattern and any signs of a memory downcycle start to bite.[3] On the fundamental side, bulls argue that AI-driven demand and supply constraints could keep pricing firm, while skeptics warn that a memory downcycle could arrive sooner than expected as capacity comes online and customers digest inventory.[2][8]
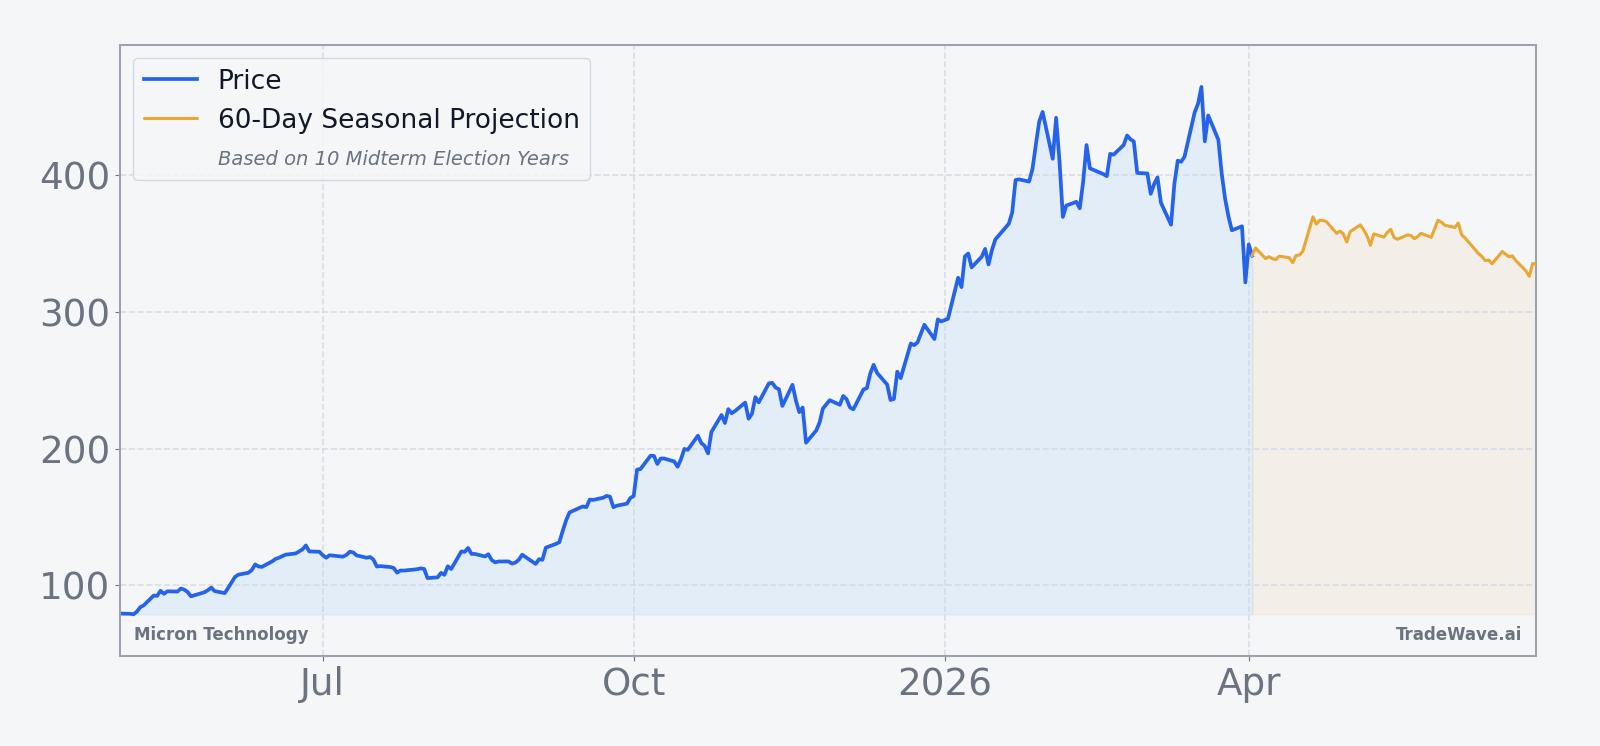
The chart below situates the latest pullback against Micron’s powerful 12-month rally and a 60-day seasonal projection overlay.
What should traders watch as this Micron Technology seasonal window approaches?
First, the calendar: the 164-day midterm-year window tied to this pattern begins on May 2, so the next few weeks are about watching how Micron behaves as it transitions from a powerful AI-led uptrend into a historically weak stretch for the stock. If shares continue to grind higher or hold near current levels into the start of the window, the contrast between price momentum and historical seasonality will become more pronounced.
Second, the policy and macro backdrop matters. Midterm election years often bring noisy debates over spending, industrial policy and export controls, all of which can affect sentiment toward US memory and AI hardware suppliers. Any shift in expectations for interest rates or fiscal support that hits high-beta tech could interact with this MU seasonal trend, either reinforcing or offsetting the historical pattern.
Third, traders should keep an eye on options flow and short interest as the window opens. If bullish call activity like the pre-earnings surge in March reappears while the stock stalls or rolls over, that could set up a more volatile tug-of-war between momentum buyers and seasonality-aware sellers.[9] Conversely, a steady rebuild in short interest from the current low base would signal that more investors are leaning into the historical pattern and positioning for a choppier or weaker stretch.
Finally, price levels will be key. On the upside, the 52-week high near 471.34 is the obvious reference point for any renewed AI euphoria, while on the downside, traders will watch how Micron behaves on pullbacks of 20% or more inside the window, given how often prior midterm years have produced deep intraperiod swings. If the stock sells off in line with the historical seasonality and then stabilizes late in the window, that would fit the pattern; a sustained breakout through the highs would mark a clear departure from the past.
Sources
- Seeking Alpha, "Micron Just Smashed Estimates - Buy The Dip (NASDAQ:MU)", Mar 18, 2026
- Seeking Alpha, "Micron slides as investors take profits after historic run; analysts praise guidance (MU:NASDAQ)", Mar 19, 2026
- Seeking Alpha, "Micron Q2 Earnings Preview: Expect Another Monster Quarter (NASDAQ:MU)", Mar 14, 2026
- Yahoo Finance, "Micron stock falls more than 4% despite Q2 earnings beat amid growth concerns", Mar 19, 2026
- Yahoo Finance, "Analysts Lift Micron Price Targets Ahead of Quarterly Earnings", Dec 17, 2025
- Seeking Alpha, "Micron stock jumps after raising Q4 guidance (MU:NASDAQ)", Aug 11, 2025
- Seeking Alpha, "Micron: Memory Downcycle Sooner Than Expected (NASDAQ:MU)", Mar 16, 2026
- Seeking Alpha, "Micron options lean bullish ahead of earnings with ~8% move priced in", Mar 18, 2026
About this seasonal analysis
Seasonal pattern data is sourced from TradeWave.ai, which analyzes historical price behavior across annual calendar windows going back up to 30 years. Read the full data methodology or the book The 100-Year Pattern by Afshin Moshrefi (2026 edition). Past performance of seasonal patterns does not guarantee future results. This article is for informational purposes only and does not constitute investment advice.