Bath & Body Works, Inc. (BBWI) Has Rallied in 8 of 9 Midterm Spring Windows
Bath & Body Works, Inc. is entering an 8-day midterm-year seasonal window with a strong bullish track record just as the stock trades well below its 52-week high and investors weigh softer sales guidance and legal overhangs.

What is the seasonal pattern for Bath & Body Works, Inc. (BBWI)?
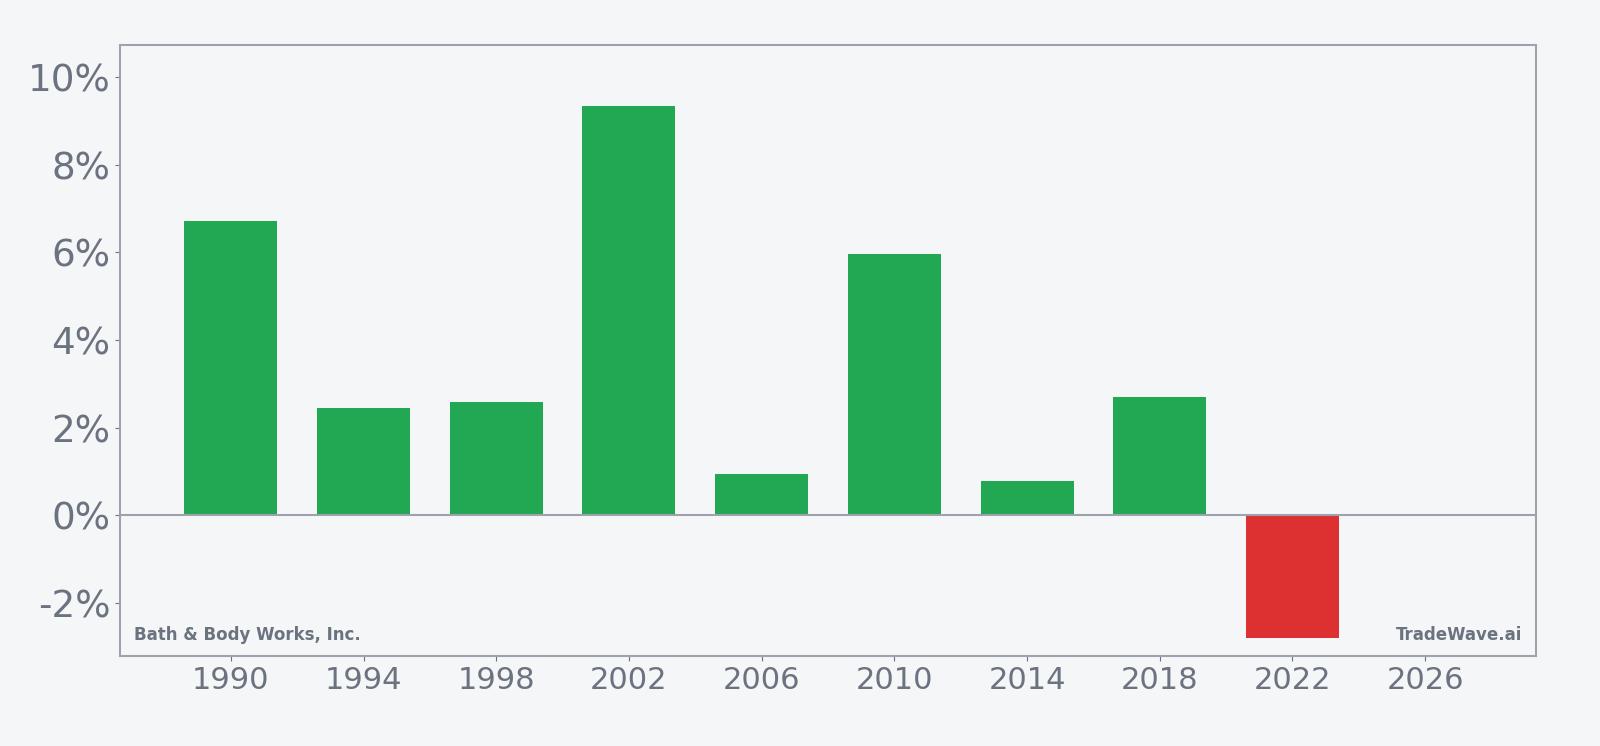
Bath & Body Works, Inc. has risen in 8 of 9 midterm-year spring windows during this 8-day stretch, with an average gain of 3.94% in winning years.
- 8 wins and 1 loss in this window, with winning years averaging 3.94% gains and a 3% average when all years are included.
- The current 8-day trading window begins Apr 1, 2026 and covers the last 9 midterm election years in the dataset.
- Percent Profitable stands at 89%, with 8 winners and 1 loser across the historical sample.
- Average loss in the lone down year was -2.8%, showing that setbacks have been smaller than the typical upside move.
- Intraperiod swings have been meaningful, with several years showing sharp peak run-ups and notable drawdowns before finishing higher.
- The TradeWave Ratio of 2.31 and a Sharpe ratio of 0.86 point to a historically favorable but still volatile long setup in this Bath & Body Works, Inc. trading window.
According to historical data from TradeWave.ai, this early-April stretch for Bath & Body Works, Inc. has behaved very differently from an average month on the calendar. The next section looks at how that election-cycle pattern lines up with today’s setup.
How has Bath & Body Works, Inc. (BBWI) traded in this midterm-year April window?
Bath & Body Works, Inc. has posted gains in 8 of the last 9 midterm election years during this 8-day window starting Apr 1, with an average winner return of 3.94%. Shares closed Tuesday at $18.67, flat on the day and about 43.1% below their 52-week high of $32.83, leaving plenty of room between current levels and last year’s peak.[4]
The presidential election cycle matters here because consumer stocks often trade differently in midterm years than in election or pre-election years, as policy noise and spending expectations shift. This pattern phase captures the early part of midterm election years, a stretch that can be choppy for the broader market but has historically been constructive for this specific Bath & Body Works, Inc. trading window.
For a long setup, that 89% Percent Profitable figure means only one of the last nine midterm-year iterations finished lower, and that down year lost 2.8%. Average gains of 3.94% in winning years compare with a 3% average when all years are included, so the single loser drags the all-in number down only modestly. The Sharpe ratio of 0.86 suggests the risk-adjusted profile has been solid rather than spectacular, but the consistency of positive outcomes stands out for such a short window.
Intraperiod behavior has not been smooth. In 2002, for example, the stock finished the window up 9.34%, with the maximum favorable move matching that final gain but only after enduring a worst drawdown of -5.73% from entry. In 2022, the lone losing year, BBWI still saw a peak run-up of 2.44% before reversing to a -2.8% net loss, with a maximum adverse move of -6.93%. That mix of strong rallies and sharp setbacks is typical of a high-variance retail name even inside a bullish seasonal pattern.
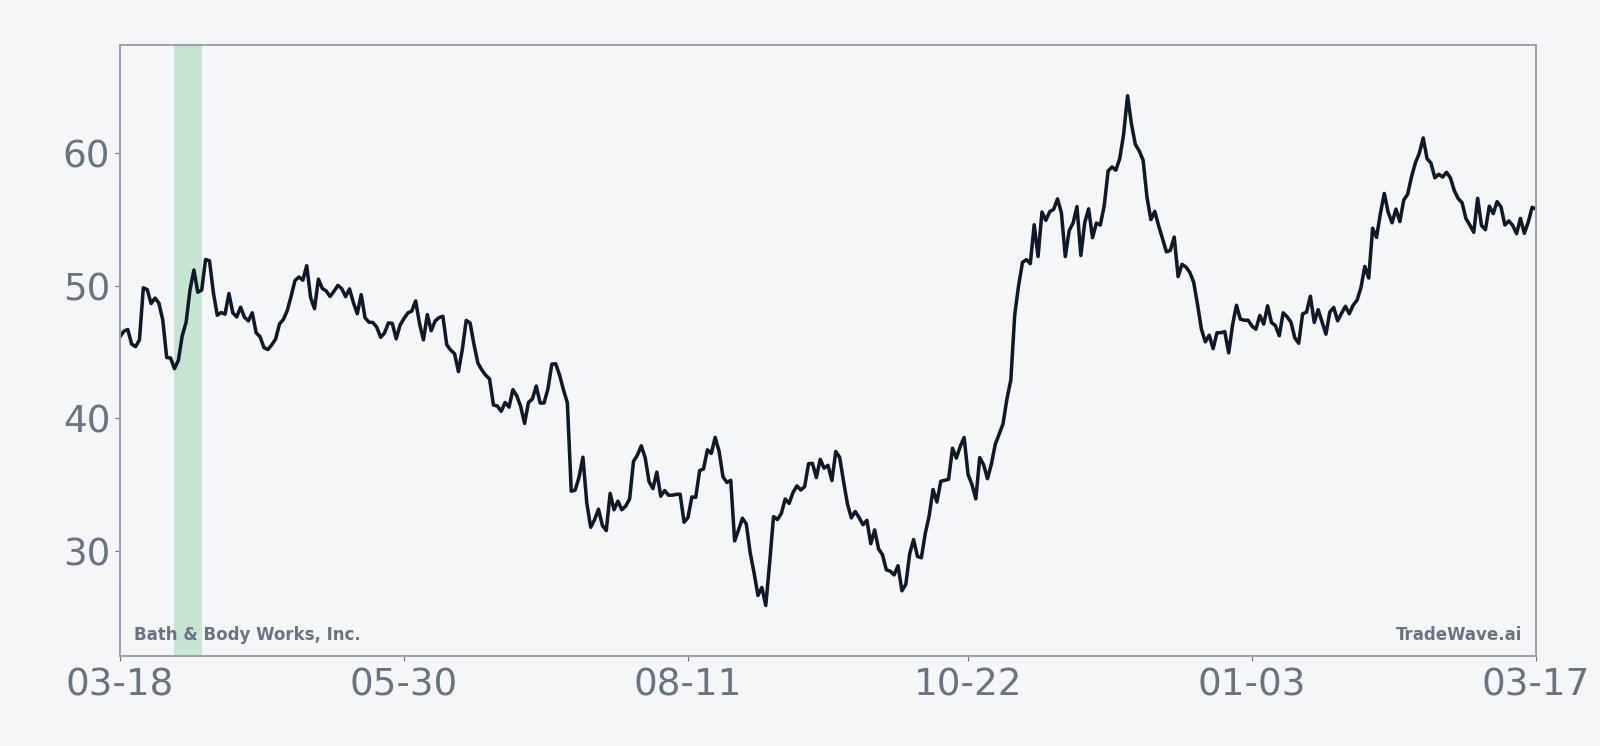
The historical seasonal average trend shows gains tending to build steadily across the eight sessions rather than spiking on a single day. The curve slopes higher from day one, with only modest mid-window dips, which suggests that in many years the stock has drifted up through the period instead of relying on one outsized move.
A closer look at yearly net returns alongside peak run-ups and worst drawdowns shows how that average masks some big swings under the surface.
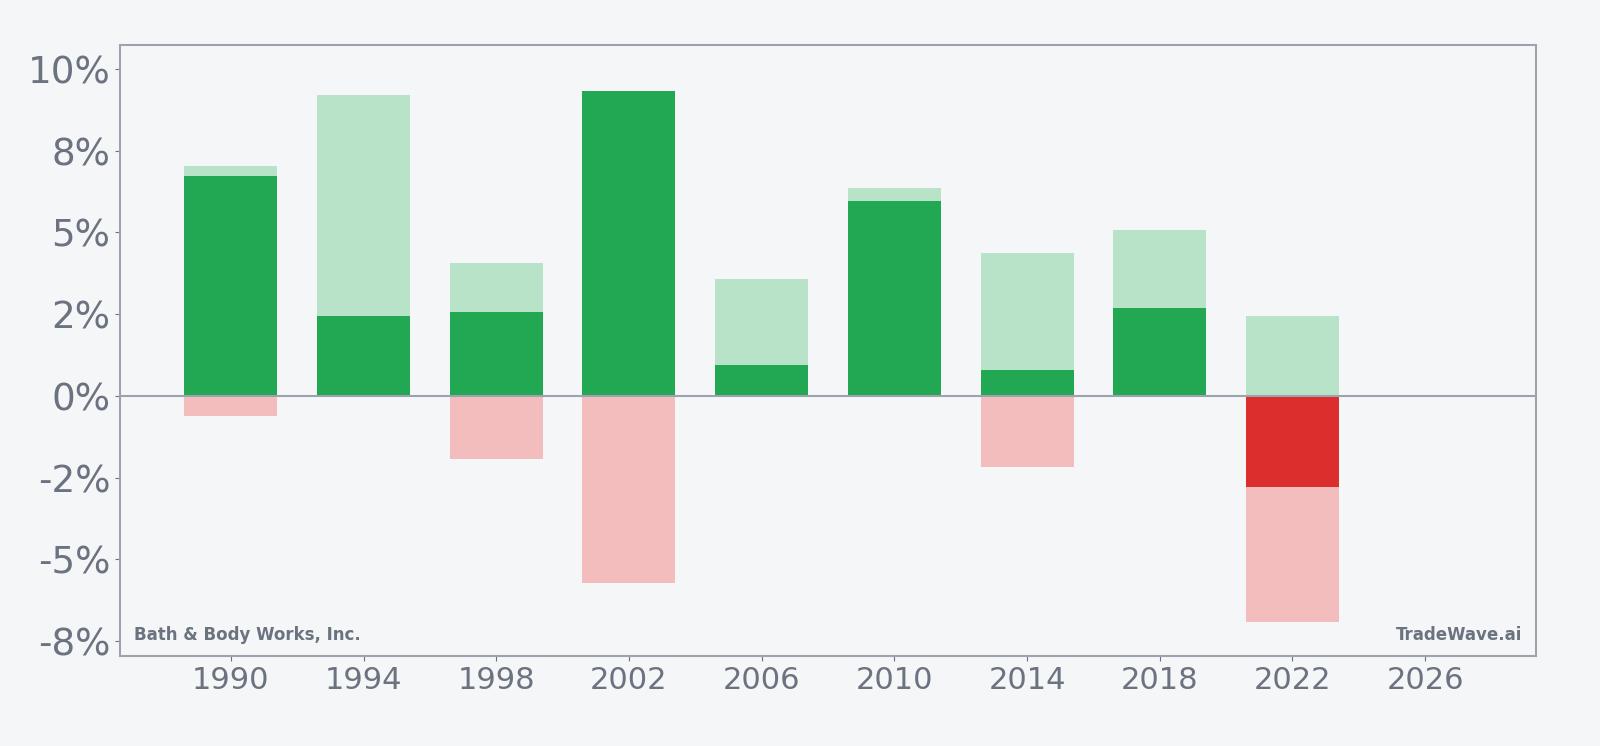
The stacked net, maximum favorable excursion and maximum adverse excursion bars show that in most years BBWI has enjoyed sizable peak rallies within the window, often larger than the final net gain, while downside excursions have usually been smaller but still meaningful. Large positive maximum favorable moves combined with contained but noticeable maximum adverse moves fit a profile where the long side has historically been rewarded, yet traders have had to sit through volatility to capture it.
History does not guarantee future results; adverse excursions can be large even in winning windows, and past seasonal strength does not eliminate stock-specific or macro risk.
Why does Bath & Body Works, Inc. (BBWI) follow this seasonal pattern?
This early-April midterm-year pattern may reflect consumer spending cycles and how investors position around spring promotions and upcoming earnings updates for specialty retailers. One likely driver is portfolio rotation as funds rebalance exposure to discretionary names after the holiday season and before the summer travel period. Analysts have also pointed to broader sector rotation in midterm years, when policy uncertainty and rate debates can push investors toward or away from mall-based retail at specific points on the calendar.
What is driving Bath & Body Works, Inc. (BBWI) today?
BBWI finished Tuesday unchanged at $18.67 on roughly 6.8 million shares, leaving the stock down 16.76% over the past month and trading below its 50-day moving average of $21.45 as well as its 20-day average volume of about 6.0 million shares.[4] That slide accelerated after the company cut its outlook and flagged weaker demand for candles and fragrances, with management in early March forecasting a steeper decline in annual sales as consumers pull back on non-essential purchases.[4]
In early March 2026, Bath & Body Works warned that annual sales would fall more than previously expected, citing waning holiday demand and pressure on discretionary spending, and the stock has struggled to regain momentum since that update.[4] The company is still working through the fallout from a tough 2025, when revenue slipped and net income dropped, and investors are also watching a securities class action effort tied to disclosures between June 2024 and November 2025, which adds a legal overhang even if any ultimate damages remain uncertain.[1][3][5]
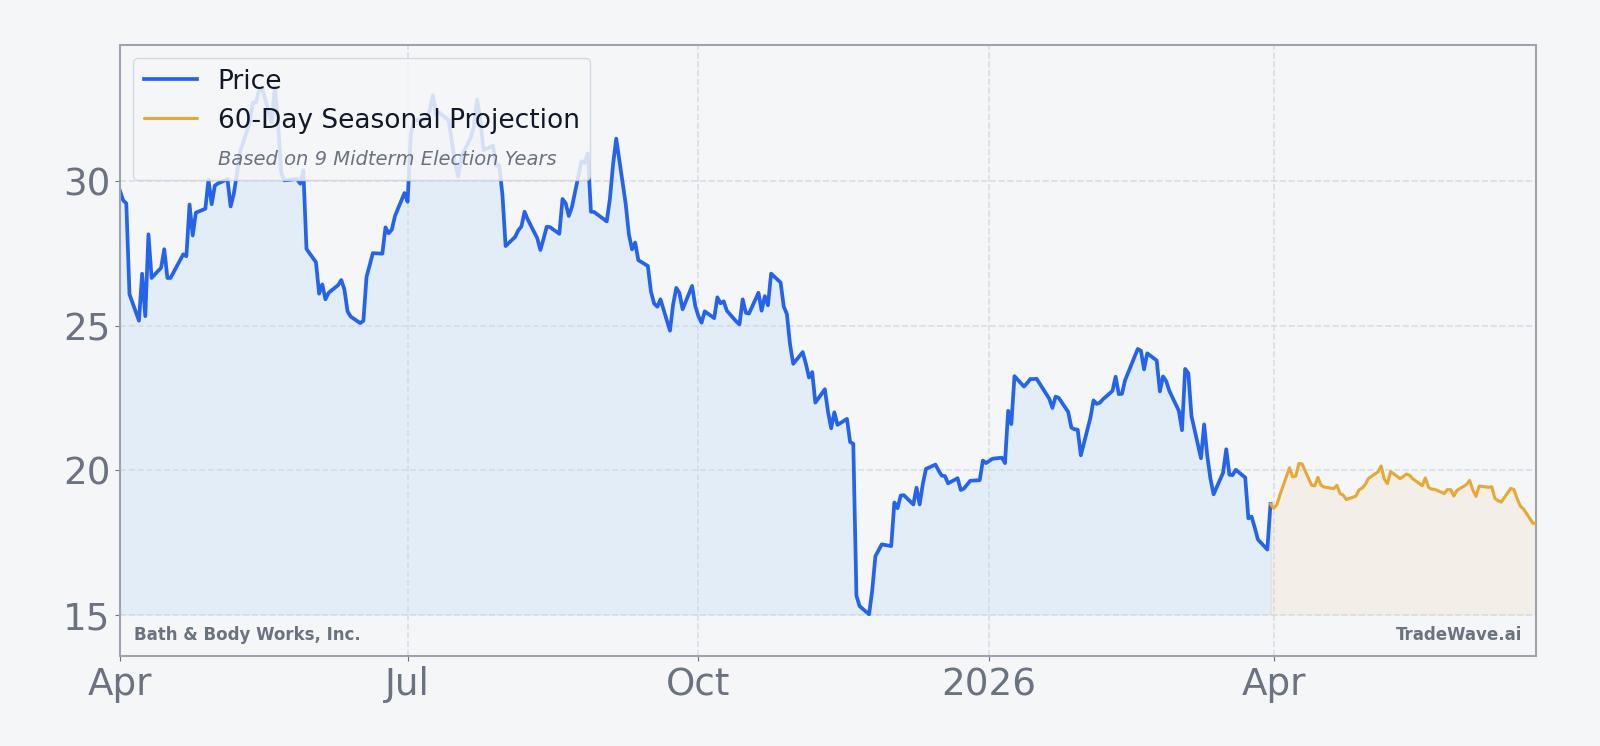
The chart below shows how that fundamental reset has intersected with BBWI’s longer slide from last year’s highs and the next 60 days of seasonal projections.
What should traders watch in this BBWI seasonal window?
For this 8-day stretch, the key test is whether BBWI can stabilize above recent lows and start to mirror its historical tendency to grind higher through early April. Price action around the $18 level, which sits well below the 50-day moving average, will show whether sellers remain in control or if bargain hunters lean into the seasonal tailwind.[4] Any fresh commentary on consumer demand or promotional intensity from retailers in the same mall-based cohort could also sway sentiment, given the macro backdrop of weaker non-essential spending.[2][3][4]
Traders will be watching intraday swings closely against the historical pattern of sizable peak run-ups and moderate drawdowns inside this window. A move that quickly pushes BBWI higher with contained downside would line up with the 8-for-9 win record, while another sharp fade from early strength would look more like the 2022 outlier. Add it up: how the stock behaves over these eight sessions will tell investors whether this midterm-year seasonal edge can still matter for a retailer working through softer sales and legal noise.
Sources
- Morningstar: DEADLINE ALERT: Faruqi & Faruqi, LLP Investigates Claims on Behalf of Investors of Bath and Body Works (Jan 17, 2026)
- Forbes: Bath & Body Works Stock To $10? (Oct 16, 2025)
- Reuters: Bath & Body Works forecasts sales dip as holiday demand wanes; shares plunge (Nov 20, 2025)
- Reuters: Bath & Body Works forecasts steeper decline in annual sales (Mar 4, 2026)
- Morningstar: BBWI Investors Have Opportunity to Lead Bath & Body Works, Inc. Securities Fraud Lawsuit with the Schall Law Firm (Jan 15, 2026)
About this seasonal analysis
Seasonal pattern data is sourced from TradeWave.ai, which analyzes historical price behavior across annual calendar windows going back up to 30 years. Read the full data methodology or the book The 100-Year Pattern by Afshin Moshrefi (2026 edition). Past performance of seasonal patterns does not guarantee future results. This article is for informational purposes only and does not constitute investment advice.